

Bitcoin Trading Alert originally sent to subscribers on November 3, 2016, 11:54 AM.
In short: no speculative positions.
Bitcoin is now getting more attention as the currency has shot up in the last couple of weeks. In an article on Bloomberg,we read:
It's happening again. Bitcoin has locked step with gold and taken to the skies as uncertainty about the U.S. election increases volatility in global markets. It is, in short, acting as a haven.
(...)
Aside from facing obsolescence and the threat of competing with actual currencies, the volatility of Bitcoin has to be off-putting for serious investors. During any given period, the digital currency swings three to five times more violently than gold, hardly the behavior expected from a haven asset.
If all that weren't enough reason to look elsewhere for an investment to fall back on in the event of a market sell-off, the performance of Bitcoin after Brexit should be. In the two weeks that ensued the vote, gold rallied 8.2 percent while Bitcoin moved a measly 1.3 percent higher.
So, Bitcoin is getting the attention of major media outlets. This is a bearish indication as it shows that the interest in Bitcoin might be peaking. At the same time, it’s not a deal breaker as it doesn’t actually mean Bitcoin is hitting the headlines. It simply means that mainstream media are picking up the news about the recent appreciation.
The article takes a position that Bitcoin might be on its way out, which we don’t necessarily agree with. At the same time, it suggests that the volatility of Bitcoin might be scary for investors. This seems to be pretty accurate. The way Bitcoin swings both to the upside and to the downside, might be prohibitive as far as investors such as mutual funds are concerned (not to mention the fact that they wouldn’t invest in Bitcoin as it is not regulated the way other assets are). There’s nothing one can do about the volatility of Bitcoin. Regulation won’t help immediately. It is only with long-term efforts at regulating Bitcoin and making it accessible to both individual investors and institutions, we might see the volatility decrease. This doesn’t seem to be coming in the nearest future.
For now, let’s focus on the charts.
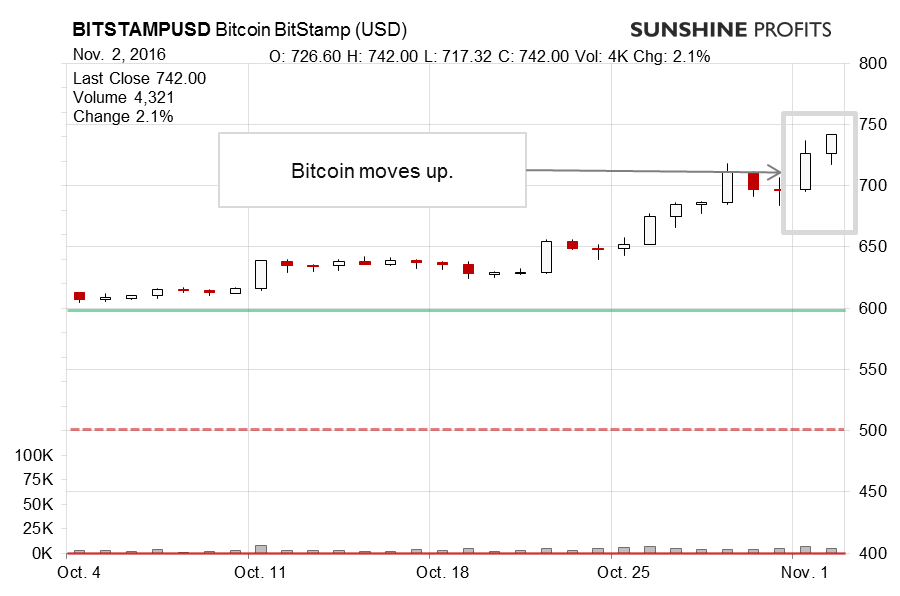
On the long-term BitStamp chart, we see more appreciation. In our previous alert, we wrote:
We now have a confirmed breakout, however, Bitcon has yet to confirm a move above $700. The situation has become a lot more bullish based on the recent price action, mostly on the price action in the last couple of days. At the same time, we have volume weaker than what we would expect of a strong move to the upside, above recent resistance. Another slightly worrying factor is that we see the RSI above 70 and it might actually be coming down below this level (it’s too soon to tell, though).
We saw a little bit more appreciation, however, the volume was not spectacular. It was relatively high but not really close to what we saw during major tops. This is one indication that the move up might not be over yet. At the same time, we do have some more bearish indications.
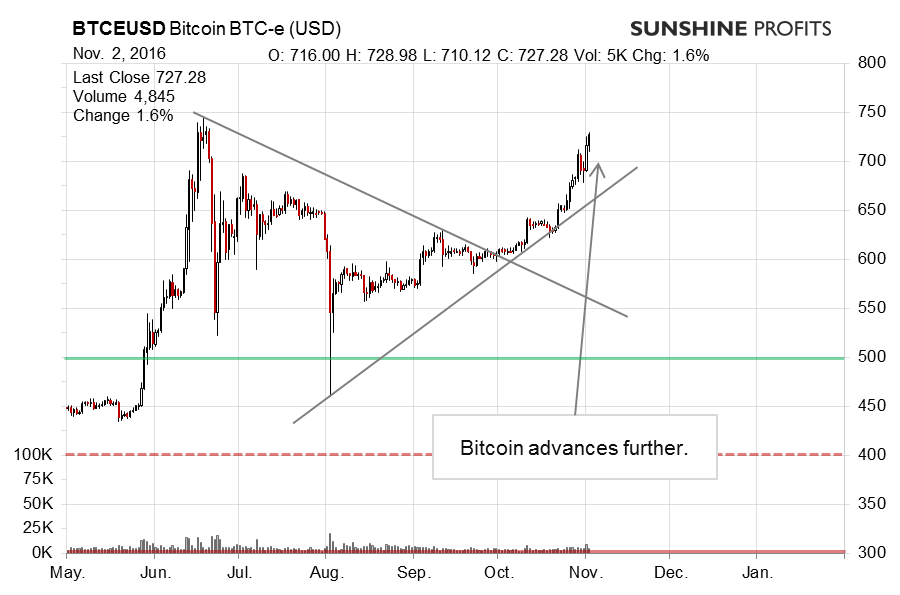
On the long-term BTC-e chart, we also see a move up. Our recent comments:
Bitcoin is now well above the previous support and also above the quite important $660 level. So, what’s stopping us from going long, hypothetically? The main reason is that Bitcoin is now at a potentially very important resistance line, the one based on the all-time high (formed back in 2013) and the June 2016 top. This is the most important line we have seen Bitcoin at in months. If we see a break above it, Bitcoin might shot up to the June 2016 high or even higher. At the same time, the hitherto rally already seems a bit overextended, which might suggest that the resistance line will trigger a downswing. The exact fashion in which Bitcoin will trade around this line might have important implications for traders for the next couple of weeks/months. If Bitcoin goes above this line, corrects and stays above it, we might have an excellent buying opportunity on our hands. Conversely, if the currency fails to move above the line or moves above it and reverses back below, we might witness a tremendous shorting point. Our general sense is that the latter might be more probable, given the fact that Bitcoin-focused media are currently raving about new highs and even about the possibility of Bitcoin going back to $1,000. At the same time, this is not a very strong indication (the same kind of attention in mainstream media could be considered one), so we are not leaning toward either option very strongly. One way or another, it seems that the next couple of days (or weeks if Bitcoin trades sideways) might be the most important point in months, in our opinion.
Our previous analysis is still up to date with one important change. Bitcoin went above the mentioned important resistance line (2013 high – July 2016 top), back below it (this is when our last alert was posted), then back above and sharply down in the direction of the line (still above it, though). The implications are still quite bullish for BTC-e. On BitStamp, however, a similar line gives a completely different conclusion. Namely, Bitcoin is back below this line and quite visibly so. On both exchanges we have Bitcoin going out of the overbought territory as far as the RSI is concerned. This might be a bearish hint. If we were to see a slip back below the long-term resistance line across exchanges, we might open hypothetical short positions. This is not the case just yet, however, we might see important changes in days or even hours. Stay tuned.
Summing up, in our opinion not having speculative positions might be favorable at the moment.
Trading position (short-term, our opinion): no positions.
Thank you.
Regards,
Mike McAra
Bitcoin Trading Strategist
Bitcoin Trading Alerts
