

Square, a payment company, is playing around with Bitcoin. In an article on CNBC, we read:
Jack Dorsey's company is testing support for bitcoin through its Cash payments app.
"We're exploring how Square can make this experience faster and easier, and have rolled out this feature to a small number of Cash app customers," a Square spokesperson said via email to CNBC. "We believe cryptocurrency can greatly impact the ability of individuals to participate in the global financial system and we're excited to learn more here."
The test does not allow individuals or businesses to send or accept bitcoin, Square said.
Shares of Square spiked more than 5 percent Wednesday to a record high as one Wall Street firm was quick to recommend the stock on this potential development. The stock closed up 2.3 percent at $40.66 a share.
We are always skeptical when we hear something like: “Stock X has rallied because Y.” It is very hard to pinpoint specific reasons behind a given move. We’re not saying that the Bitcoin news was not the reason why Square went up. We’d simply rather say that it is a possibility rather than certainty as it might be gleaned from many media stories. The same goes for the “Bitcoin goes up because of the Square move” story. Wait, does Bitcoin affect Square or does Square affect Bitcoin? Which one is it? Or is it both? You can immediately appreciate the subtlety of any reasonable answer. While the Square story reads well and for precisely this reason is featured heavily in the media, the recent price move might have implications for the Bitcoin market beyond the possible temporary impact of the news.
For now, let’s focus on the charts.
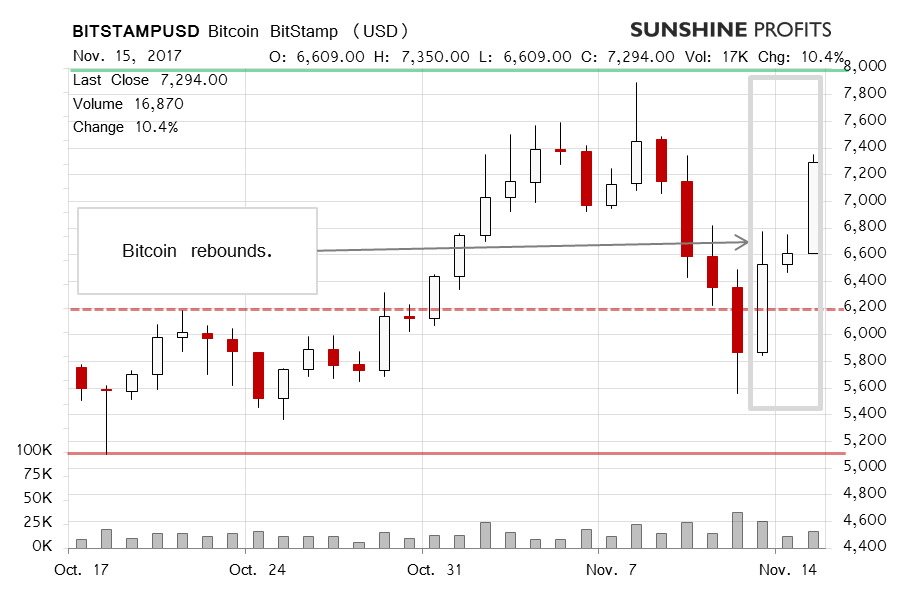
On Bitstamp, we saw very interesting and potentially quite important action as Bitcoin went down hard, and then came back with a vengeance. What might this mean for the Bitcoin market? Recall our recent comments:
The move up was partially reversed with Bitcoin falling steeply to around $5,500 yesterday. Bitcoin went below the 23.6% Fibonacci retracement level ($6,206) before coming back above this level today. This might mean that all the bearish indications have been nullified, particularly since yesterday’s move was completed on significant volume, at least in comparison with what we have seen in the last couple of weeks.
Depending on what move you precisely look at, we can draw several 23.6% Fibonacci retracements. Bitcoin, however, went back above the level we mentioned previously and also above all the 23.6% retracement levels we have considered writing this article. And it did so in a quite visible manner. This means that the situation is now decidedly more bullish than it was only a couple days ago.
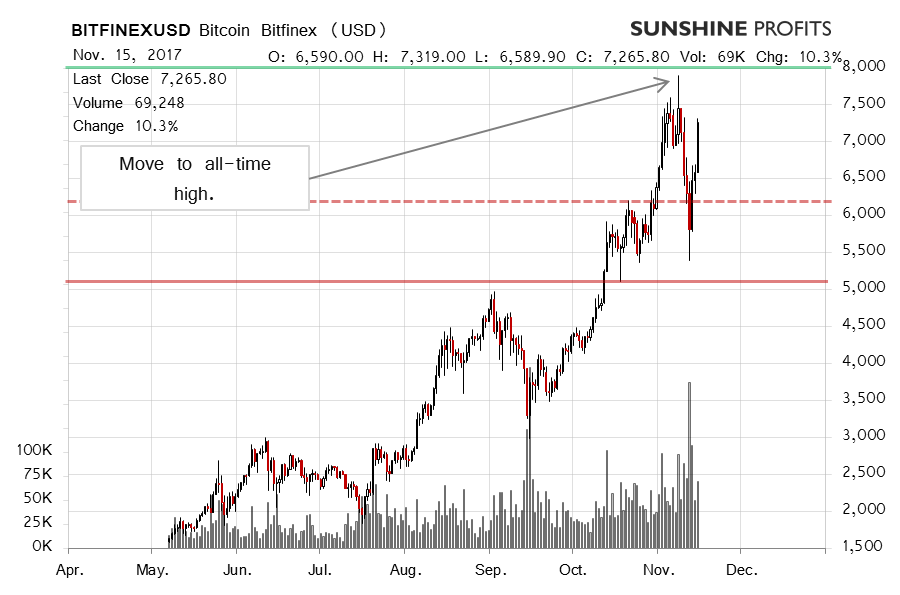
On the long-term Bitfinex chart, we see the recent rebound very clearly. In our previous alert, we wrote:
Right now the situation is very different than what we saw previously. Right now, the situation is one in which we’re right after a very strong move to the downside but with no meaningful breakdowns. In other words, the very recent depreciation is significant in terms of price and volatility but not necessarily when compared to the overall rally back from around $1,000. It seems that a continuation of a move to the upside and a new all-time high might be in the cards. The next day or two might be critical in determining the next possible move.
It turns out that a move up was in the cards and that the recent invalidation of the breakdown below the 23.6% retracement (it almost doesn’t depend on which precise retracement we use). Also, depending on the time horizon, we saw a breakdown below the 38.2% retracement and a rebound. All this is quite important in and of itself. There are at least two additional factors to consider now, both of the bullish. Firstly, Bitcoin is not overbought in terms of the RSI. This might mean that there is still ample room for the currency to go up. Secondly, the recent local bottom was formed on very significant volume, which can be clearly seen on the chart. Combining these facts leaves us with a potentially bullish picture for the short-term, in our opinion.
If you have enjoyed the above analysis and would like to receive free follow-ups, we encourage you to sign up for our daily newsletter – it’s free and if you don’t like it, you can unsubscribe with just 2 clicks. If you sign up today, you’ll also get 7 days of free access to our premium daily Gold & Silver Trading Alerts. Sign me up!.
Thank you.
Regards,
Mike McAra
Bitcoin Trading Strategist
Bitcoin Trading Alerts
