

Bitcoin is now a lot more popular among mainstream investors than it was only a couple days ago. This is perhaps evidenced by the fact that the digital currency made its way to Bloomberg Markets homepage. In the short piece we read:
Bitcoin rose as much as 5.8 percent to an all-time intraday high of $2,999.98. The virtual currency has tripled its value since the beginning of the year amid greater acceptance of the blockchain technology that underpins the exchange method, global political uncertainty and increased interest in Asia. Skeptics have said that there may be a bubble in the making as bitcoin has repeatedly broken records without showing signs of slowing.
Interest of mainstream media
It’s hard to call this in-depth analysis and the note is still buried in the amount of info on the page but the more interesting part than the note itself is that Bitcoin is now in the focus of mainstream media. It is usually characteristic to see such pieces of news right at the tops. Does this mean that the top is in? Not necessarily, however, even if it’s not, current developments in the market point to important outcomes.
For now, let’s focus on the charts.
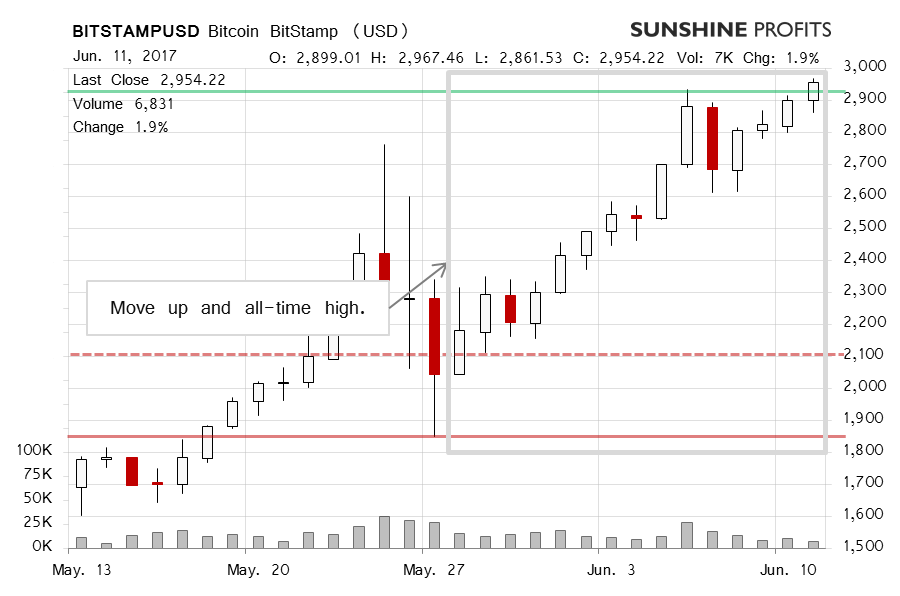
On BitStamp, the situation has almost become boring – new high every couple of days. Recall our previous comments:
Quite importantly, the volume on which the top was made was relatively significant. The volume on which the top was corrected yesterday was less pronounced. The move today (….) has been to the upside but the volume has been relatively weak to mediocre. This makes the short-term picture cloudy.
Bitcoin has gone up some more since our previous alert was posted but the move was not on huge volume. The cloudiness of the picture remains in place since the currency reached yet another all-time high, just below $3,000 but the move today has been mostly to the downside and on strong volume (this is written around 11:30a.m. ET). Even though all this has “bearish” written all over it, there’s still more to the situation.
Yet another new all-time high
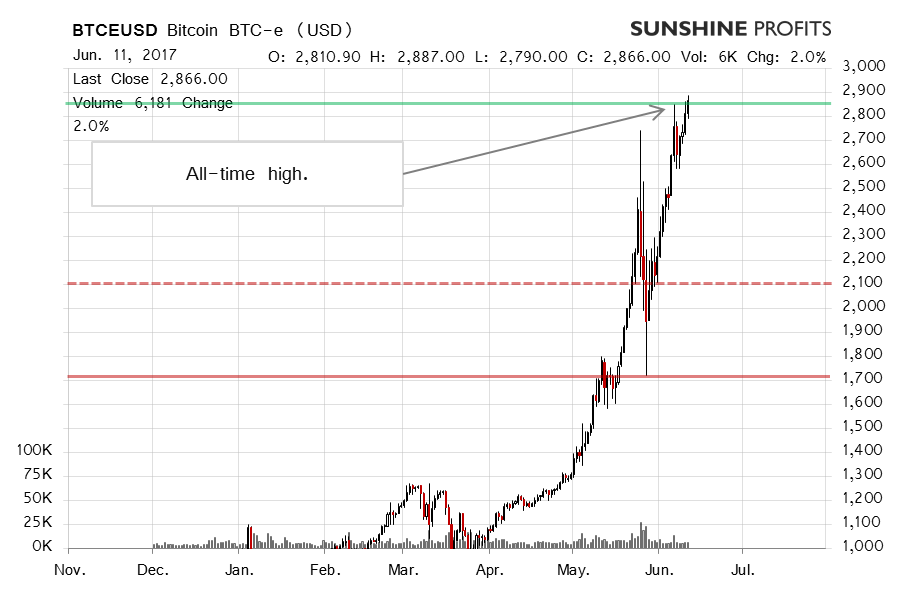
On the long-term BTC-e chart, we see the move up and its extreme magnitude. The situation is almost as incredible as it has ever been before. Recall our recent comments:
The situation is now less bearish in terms of the price move, however, it has also become even more extreme than it was a couple of days ago. Right now, Bitcoin is still at $2,700. In terms of the 3-day and one-week RSI Bitcoin is now extremely overbought. The situation now is getting close to the levels where it was in late 2013 at the previous very significant top. Could Bitcoin go further up from here? Yes. As such, we prefer to wait a little bit more before opening hypothetical short positions.
We’re up from where we were a couple of days ago and the situation is more extreme in terms of the price, and possibly volume, but the move down today has not been enough to turn the situation around and we might still see a rebound to the upside. If this doesn’t materialize soon enough, we might consider shorts without an additional move up. This is not the case yet. Stay tuned!
Thank you.
Regards,
Mike McAra
Bitcoin Trading Strategist
Bitcoin Trading Alerts
