

Bitcoin is making headlines now. In an article on CNBC, we read:
Bitcoin rocketed higher Thursday, crossing the $15,000 mark just 10 hours after topping $14,000.
The landmark happened on the Coinbase exchange at 10 a.m. London time on Thursday, and it traded as high as $15,200 on that platform.
That said, there are often significant price differentials on different bitcoin exchanges. CoinDesk, a widely regarded industry site, still showed the cryptocurrency below the $15,000 level, according to its average of prices across leading exchanges.
Bitcoin now has a market value of more than $256 billion, meaning it would rank among the 20 largest stocks in the S&P 500.
So, Bitcoin went up a lot. And in this case, a lot mean around 50% in the last couple of days. This also means going 50% up from a recent all-time high at $10,000. No wonder the currency is now hitting the CNBC website, Bloomberg, Reuters and so on. Both the price action and the sentiment seem very extreme at the moment. This is reflected from various viewpoints.
For now, let’s focus on the charts.
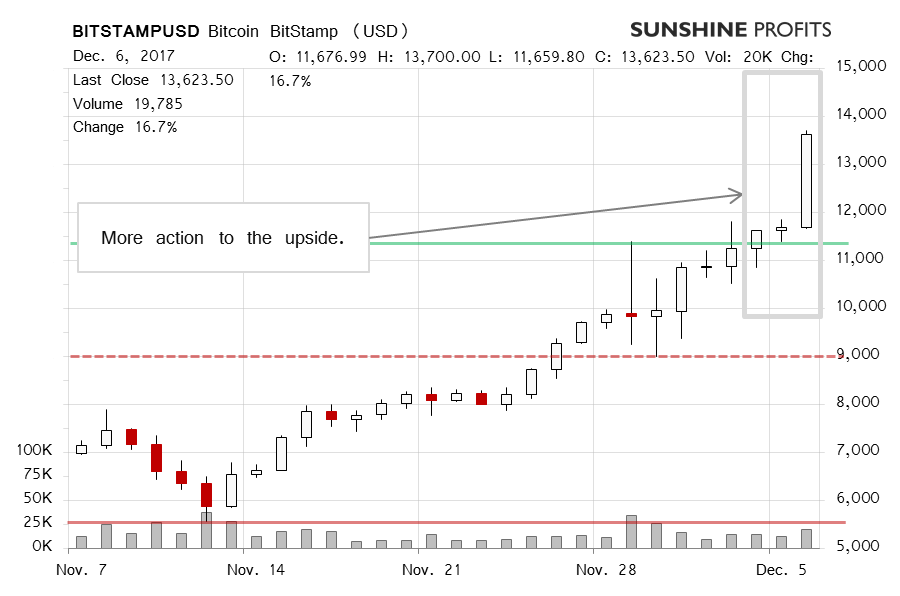
On BitStamp, we see a move to over $13,000. Actually, today’s action is not visible on the chart and Bitcoin went up to almost $15,000. Recall our recent comments:
The relative “indecision” of Bitcoin was partially clarified one day after our alert was published with Bitcoin going above $10,000 again and managing to stay above this level in the following days. This is a slightly bullish indication. We can add another bullish one. Namely, Bitcoin corrected to the 38.2% Fibonacci retracement level (around $9,164) based on the previous move up, went below this level and quickly reversed and moved to the all-time high, and above it. Does this mean that the situation is now unequivocally bullish? Not really, but we might see further confirmations.
Confirmations followed but the action itself was pretty hectic in terms of price moves. Now, with $15,000 in sight, it seems that the action might have actually been a bit too hectic for the move to continue much further without a pause or correction. Is it really the case that Bitcoin went too high, too far in too short a period of time?
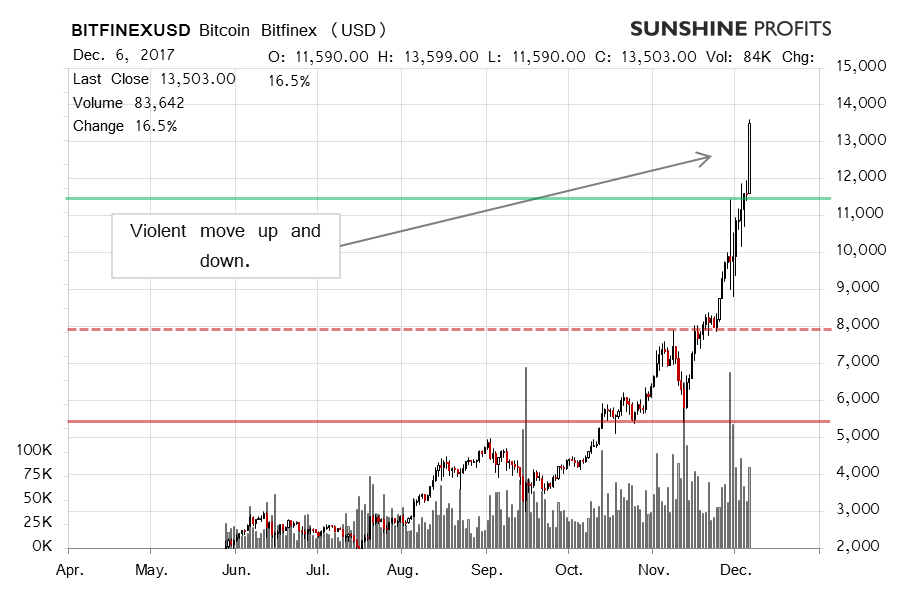
On the long-term Bitfinex chart, the move up is almost self-evident. In our recent comments, we wrote:
At the moment of writing these words (...), we have Bitcoin at over $11,000 but below yesterday’s all-time high. If we compare this with the previous all-time high of $11,441, we saw a move above this level to $11,874 (the most recent all-time high) but the move was reversed and Bitcoin came back below $11,441. This means that the recent breakout has not been confirmed yet, in our opinion. If we see a more decisive move above $11,441, we might consider hypothetical longs once again.
A decisive move above $11,441 followed but Bitcoin left this level in the rearview mirror, perhaps a bit too quickly, at least for now. It is perhaps not so surprising to see Bitcoin appreciate around 50%, but once we combine this with the fact that this occurred already pretty well into a sizable rally, and the fact that mainstream media are picking up on the move, we might have a bearish indication on our hands. In other words, we might see at least a pause, and quite possibly a more sizable correction.
If you have enjoyed the above analysis and would like to receive free follow-ups, we encourage you to sign up for our daily newsletter – it’s free and if you don’t like it, you can unsubscribe with just 2 clicks. If you sign up today, you’ll also get 7 days of free access to our premium daily Gold & Silver Trading Alerts. Sign me up!.
Thank you.
Regards,
Mike McAra
Bitcoin Trading Strategist
Bitcoin Trading Alerts
