
Based on the January 13th, 2012 Premium Update. Visit our archives for more silver articles.
Our last weeks comments on the possible rally in gold (January 13th, 2012) are still up to date, so we will begin this essay with a quote from the aforementioned essay and then we will move to the silver market.
( ) we see that gold is about to reach the upper border of the declining trend channel and its 50-day moving average. We could see a pause and possible consolidation around this $163 price level. The outlook will remain bullish here unless a top forms and a decline is seen on significant volume. On the other hand, if the decline takes place above the $163 level and takes gold no lower than to this particular level, it would be a very bullish development and we would likely consider adding to long positions.
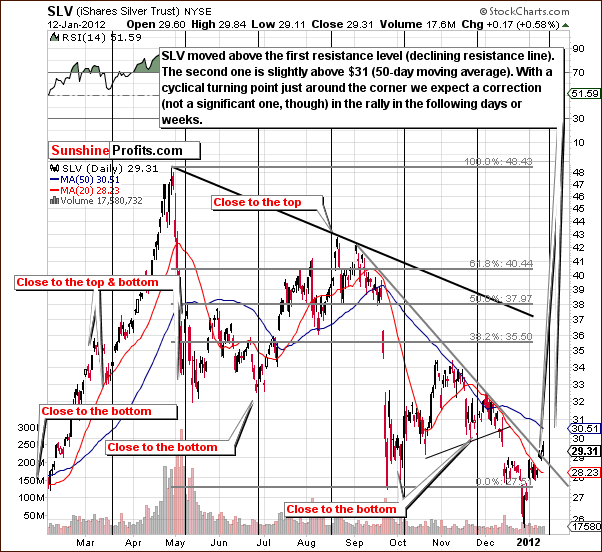
Because both the silver and gold short-term charts have similar implications regarding a short pause (however based on different factors; these factors are discussed in more detail in our full analysis), it is more probable that we will see just that.
As mentioned earlier, todays technical part is devoted to silver. Well start with the analysis of the very long-term chart (charts courtesy by http://stockcharts.com.)
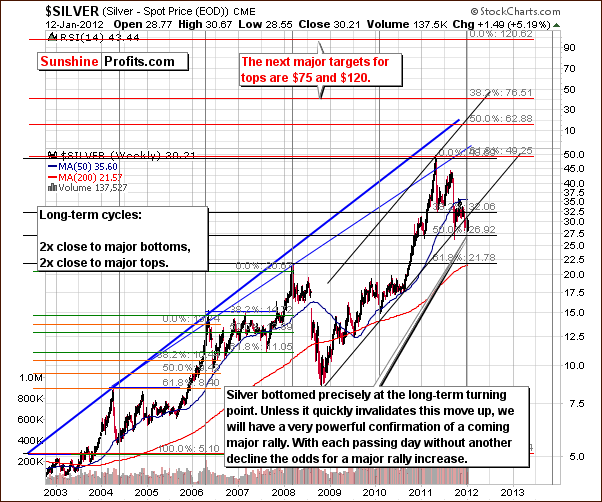
In the very long-term chart for silver, we begin by reemphasizing the importance of a recent development. Silver bottomed right at the very long-term cyclical turning point and prices have moved higher since. The lack of any additional declines has clearly confirmed that the bottom is in and greatly increases the odds of a rally from here.
This appears to have been a major bottom, perhaps as significant as the one seen late in 2008 which was followed but what could be described as pretty much a two and one-half year rally with prices rising more than 500% through early 2011.
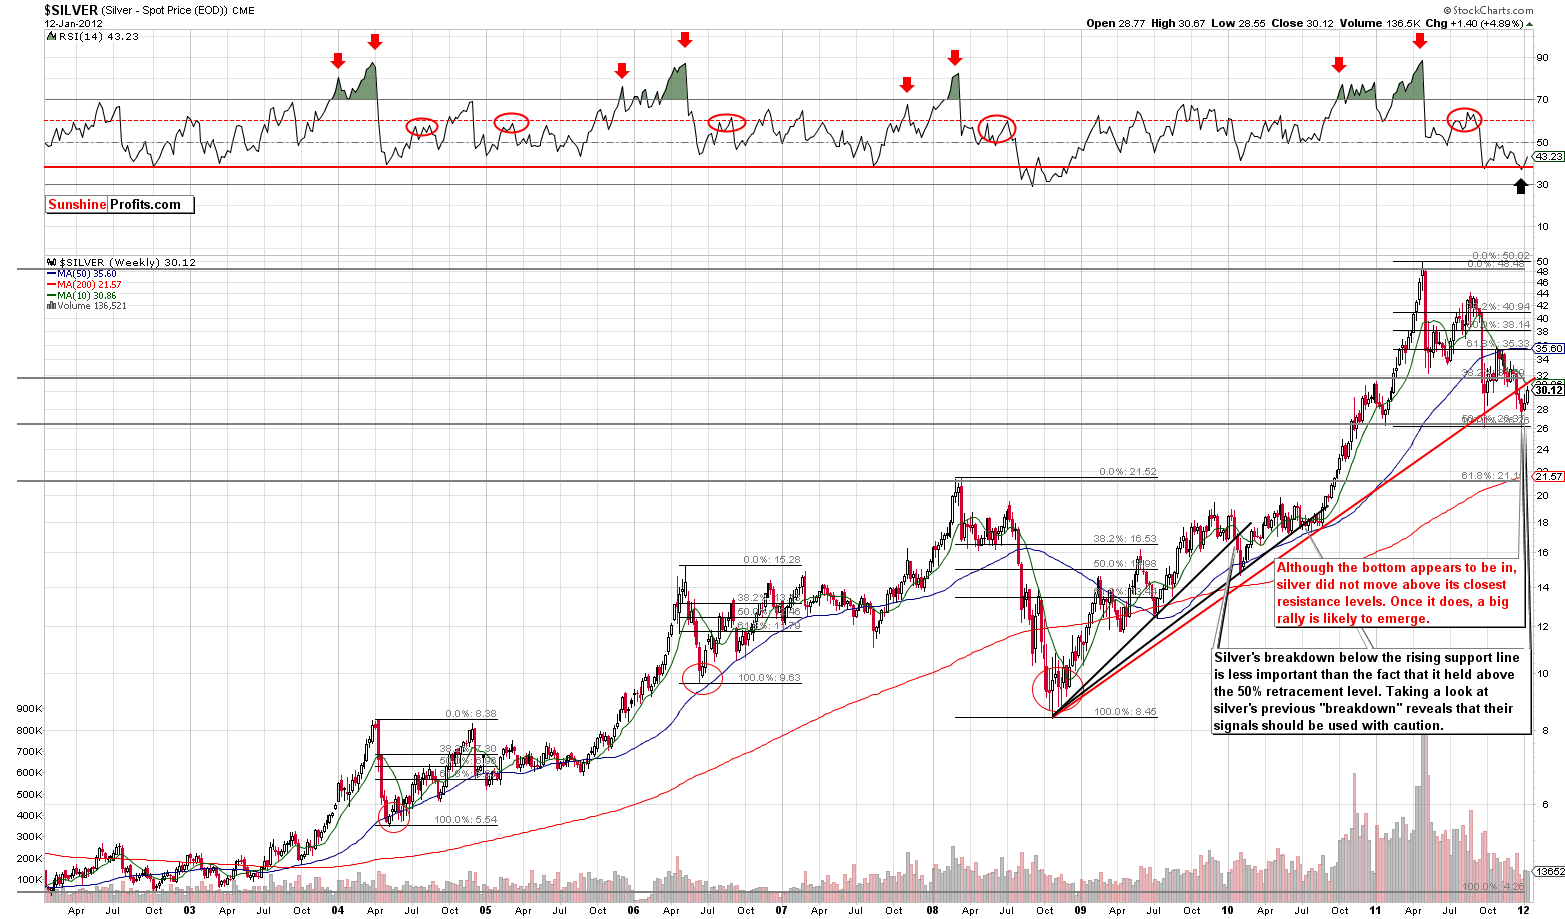
In the second very long-term chart (if youre reading this essay at www.sunshineprofits.com, you may click on the above chart to enlarge it), we see that the bottom appears to be in here as well, and silvers price is close to a resistance level which is indicated above by the rising red line. This line also coincides with the 10-week moving average (green line). The RSI level also suggests that the bottom is in, but we prefer to see an additional move to the upside above the resistance levels - before calling the situation more bullish than it is right now. It is bullish anyway, but at this point we see no reason for increasing the size of the long position.
Looking at silvers short-term chart, it seems that a consolidation is possible here as we are fast approaching a cyclical turning point. One possibility is that we could see a local top followed by a correction, a bottom, and a subsequent rally. It might be similar to what weve seen at the end of November 2011, only this time it would be a pause during an upswing.
Summing up, silvers medium- and long-term outlook is bullish. From the short-term perspective, a consolidation or pause in the rally appears likely.
To make sure that you are notified once the new features are implemented, and get immediate access to my free thoughts on the market, including information not available publicly, we urge you to sign up for our free e-mail list. Sign up for our gold & silver mailing list today and you'll also get free, 7-day access to the Premium Sections on my website, including valuable tools and charts dedicated to serious PM Investors and Speculators. It's free and you may unsubscribe at any time.
Thank you for reading. Have a great weekend and profitable week!
P. Radomski
--
The latest Premium Update starts with an overview of the various gold-related events around the world. News comes from Athens, Mumbai, London, Philippines, Germany, and Hollywood.
The main part of our analysis focuses on the recent rally and what we can expect of the precious metals market in the near term. Gold and silver markets provide different signals and their combination increases the probability of a certain outcome. What is more, gold itself appears to be following a certain pattern which allows us to estimate how much higher it can go before a significant correction takes place.
Additionally, we analyze mining stocks' performance relative to gold, elaborate on the company's valuation method that means comparing company's gold reserves to its market cap, and comment on the possibility of a deflationary scenario based on problems in Europe. We encourage you to Subscribe to the Premium Service today and read the full version of this week's analysis right away.
