

Every now and then we see some kind of anomaly on the precious metals market. Sometimes it’s particularly useful and sometimes it’s just something random. Yesterday was one of those days when something didn’t seem right. The USD Index rallied, silver declined, mining stocks declined and yet, gold closed the session higher. What can we infer from this uncommon event?
Unfortunately, not much. It was just one day when gold behaved in this way, so at this time we have no reasons to believe that gold’s one-metal rally was anything important. One thing that was visible in the gold market and that wasn’t visible in other parts of the precious metals market was gold’s breakout above the triangle pattern. Consequently, yesterday’s strength might have simply been a consequence of the breakout and we already described it yesterday. We wrote that we could see an upswing, but we don’t think it will be anything major, for instance a move to the October high. So, in a way, nothing changed, even though the relative moves during yesterday’s session might have raised many eyebrows.
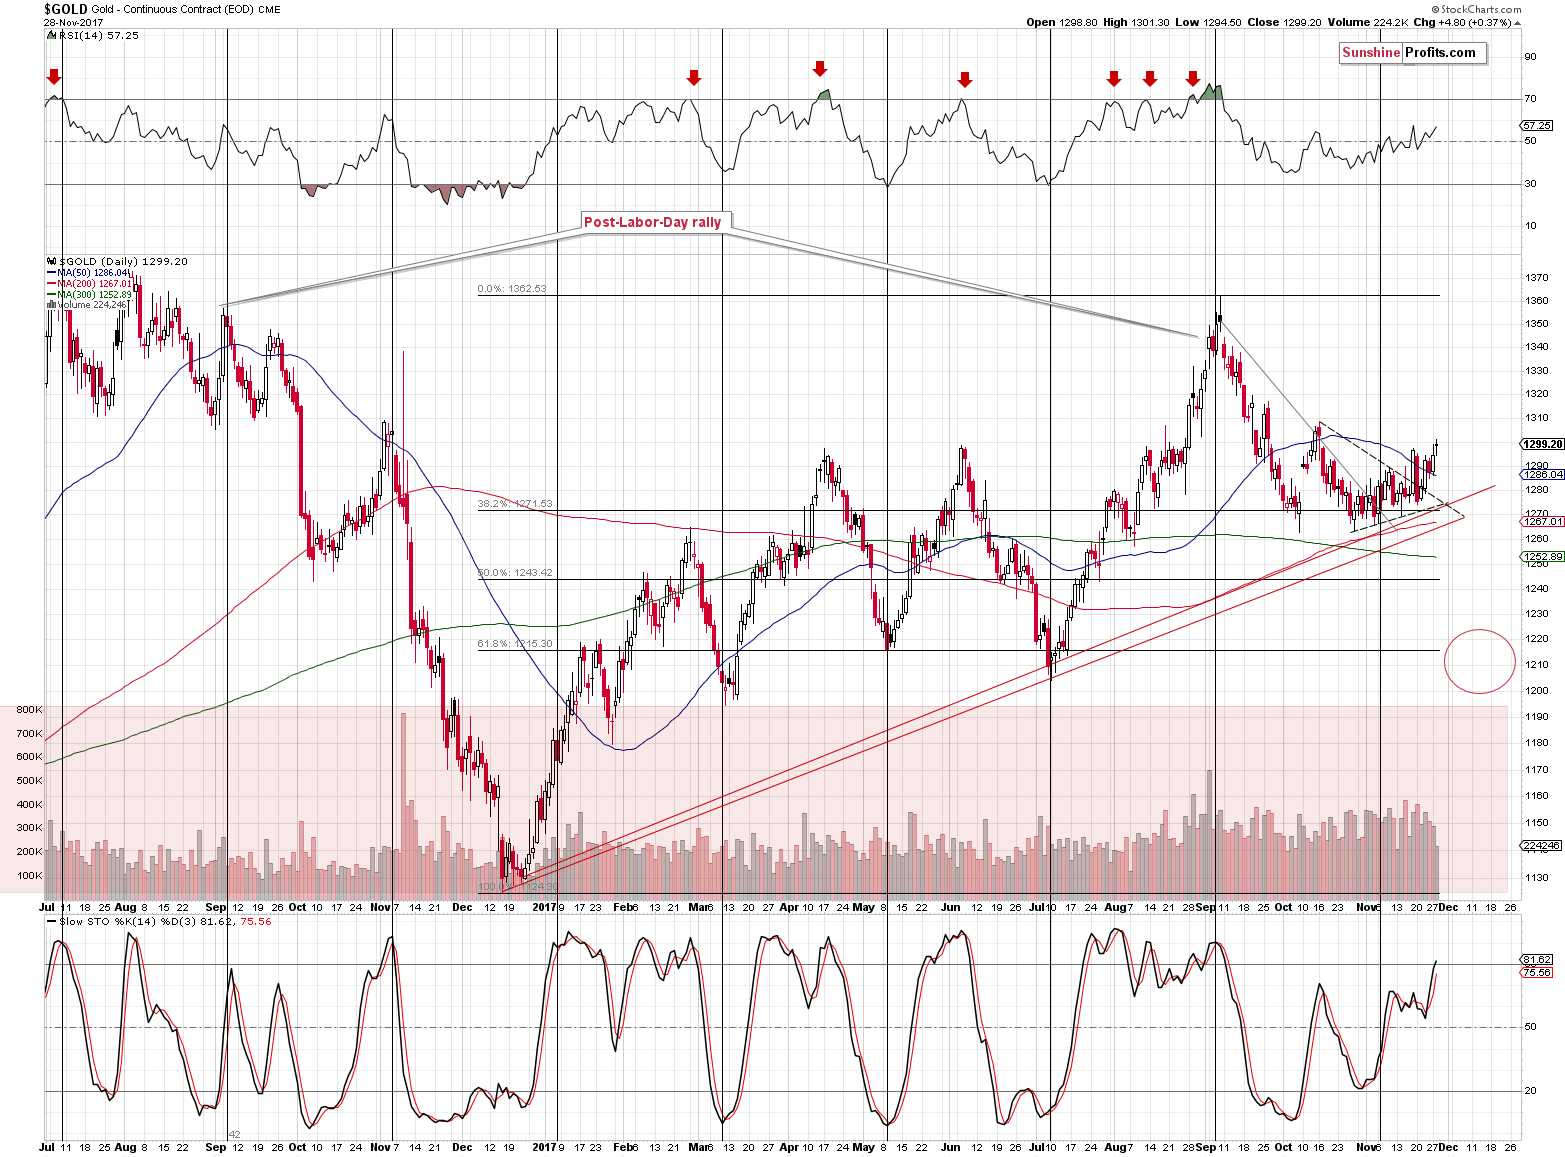
Let’s take a closer look at the gold chart for details (chart courtesy of http://stockcharts.com).
In yesterday’s alert, we wrote the following:
Gold moved higher on declining volume yesterday, but overall it continues to move back and forth below the $1,300 level. Its move above the 50-day moving average and then 2 closes above are somewhat similar to the October top. The Stochastic and RSI levels are similar as well. The above is a weak, but still, bearish sign. Even though Stochastic is at similar levels, we can see that the current reading is higher. In a way, even though the price of gold is lower, the above means that gold is closer to being overbought now, than it was in October.
On a bullish note, gold confirmed the breakout above the triangle pattern, which could result in a short-term rally. Still, we don’t expect the upswing to take gold much higher – the October high seems to be a likely target if gold’s rally continues. Again, that’s a big if, as based i.a. on the 61.8% Fibonacci retracement in the USD, the latter could rally immediately and gold could decline immediately as a result.
While Monday’s volume during the upswing was relatively low, the volume that we saw yesterday was very low. This, plus the fact that both silver and mining stocks declined, suggests that gold’s rally was most likely accidental – not an indication of a looming rally.
Having said the above, let’s discuss the situation in gold’s main adversary (after all, they tend to move in the opposite ways), the USD Index. If the latter was about to take a dive, we might still expect gold to soar. But is it likely?
No.
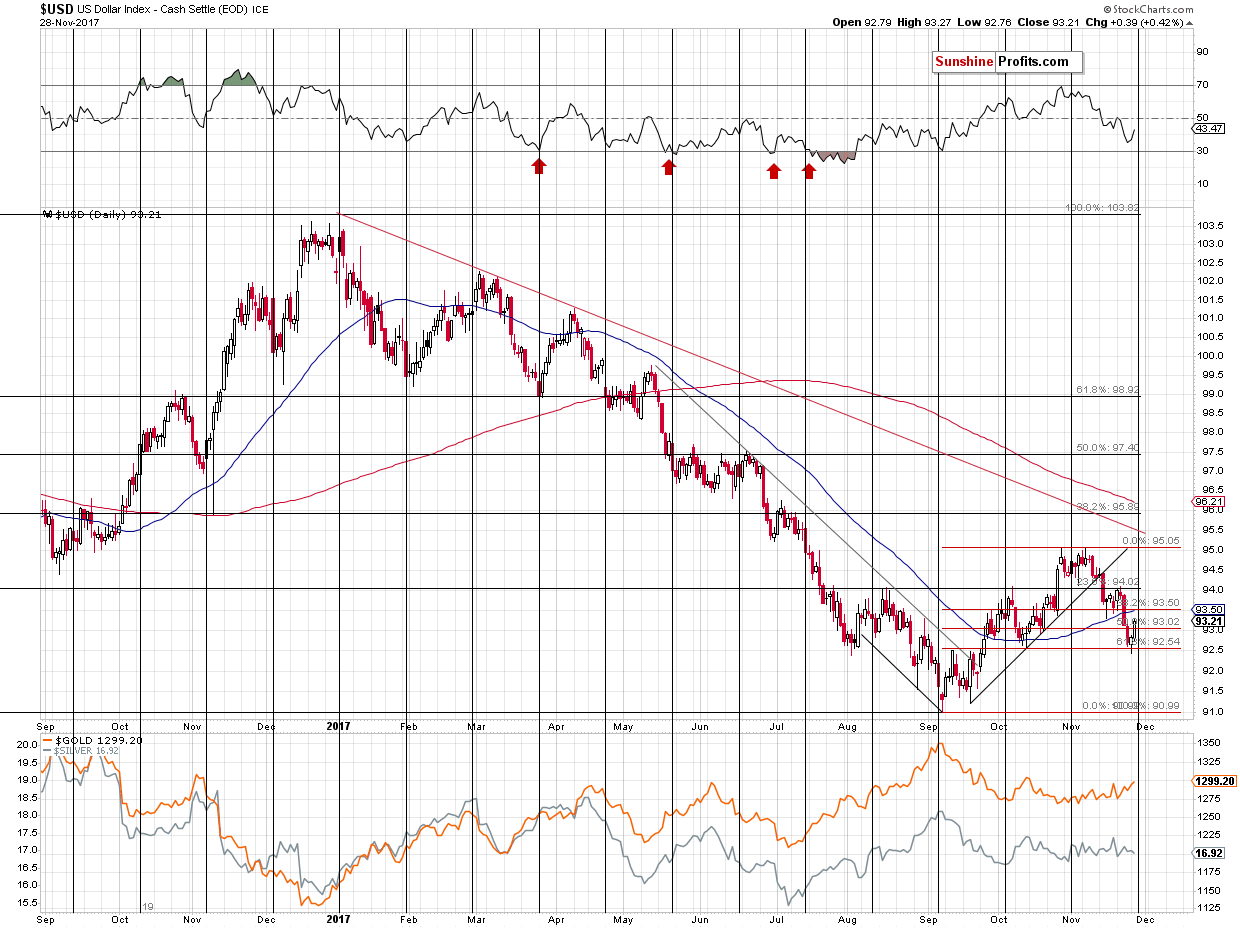
The USD Index moved lower in the past few weeks, but not in the past few days. In Monday’s alert, we wrote about a possible move below the 61.8% Fibonacci retracement level and a subsequent invalidation – that’s exactly what we saw during Monday’s session. The reversal took place quite close to the cyclical turning point, which further increases the odds that the bottom is really in and yesterday’s rally further confirmed it.
This is likely also based on the analogy in terms of time to the previous corrections in the early parts of major rallies in the USD.
One of the reasons due to which we expect the USD Index to rally in the coming months is the analogy to its behavior during previous series of rate hikes. The USD didn’t start to rally immediately after the rates were increased in the recent past and while it may seem surprising, this is exactly how things developed in the past. There was a specific delay in the USD’s reaction and it seems that it will also be the case this time. If the history is to repeat itself, it seems that the series of rate hikes is going to trigger a massive rally in the USD Index any week now.
But didn’t USD Index just decline for a few weeks? Doesn’t it invalidate any bullish implications here?
That’s a very good question and we decided to take a closer look at the analogy to the previous major bottoms and the early parts of major rallies. It is often said that time is more important than price and we analyzed the previous upswings and the early corrections with the above in mind. Namely, we checked how long the initial rallies lasted and how long the USD was correcting. You will find the details below:
- 1998 – 1999: the initial rally: 6 weeks, followed by 2 weeks of declines
- 1999 - 2000 the initial rally: 7 weeks, followed by 5 weeks of declines
- 2005 - the initial rally: 6 weeks, followed by 4 weeks of declines
- 2008 - the initial rally: 7 weeks, followed by 5 weeks of declines
- 2009 – 2010 - the initial rally: 4 weeks, followed by 3 weeks of declines
- 2011 - the initial rally: 10 weeks, followed by 2-5 (unclear) weeks of declines
- 2014 - 2015 - the initial rally: 4 weeks, followed by 4 weeks of declines
- 2016 - the initial rally: 4 weeks, followed by 3 weeks of declines
- 2017 (current upswing) - the initial rally: 7? weeks, followed by 4? weeks of declines
The initial rallies lasted between 4 and 10 weeks with the 10 number being the outlier. The average is 6, while the most recent rally either took 7 weeks (quite in tune with the past patterns) or it’s not over yet with 10 weeks so far. If it’s not over, then it would need to rally for an additional week or two, thus making the entire rally even longer than the previous outlier at 11 or 12 weeks (or longer).
Is it therefore possible that the rally will still continue before a bigger correction is seen? Yes. Is it likely? No. Based on the above time analogies it’s more likely that the initial rally is already over and we are after 3 weeks of declines.
Is the above good or bad? Both. It’s good, because we’re likely closer to the big decline in the precious metals market than it first appeared, but it’s bad because we may not get a meaningful and tradable corrective upswing in the precious metals sector after the USD Index moves close to the 96 level. Ultimately, it’s not really a matter of deciding whether the current environment is better or worse, but adapting to it and tweaking the strategy so that it remains up-to-date with the most recent observations. After all, trading is like a game of poker - at times you will get a good hand and at times you will get a back hand, but by having a good strategy toward both situations you’ll likely come out ahead over time.
So, what’s the likely follow-up action from here? If we are indeed after 3 weeks of declines, then if we can estimate how long the rally is likely to last, we could check how long it should take, additionally, for the USD to bottom.
The average length of the correction is between 3.5 and 3.875 weeks depending on the interpretation of the 2011 action. We are already after 4 weeks.
What if instead of using the average, we take into account the most similar cases - where the initial rallies took 6 or 7 weeks. In this case we get an average of 4 weeks (based on 2, 5, 4, and 5 weeks). 5 weeks is the most common analogy (half of the cases), though.
Finally, what if we assume that the most recent rally (2016) is most likely to be repeated as it’s most similar fundamental-wise? In this case, we should expect the decline to take 3 weeks. In other words, it could be over.
All in all, if we average the above approaches, it seems likely that we have either already seen the final bottom in the USD or we’re going to see it this week. Next week is also a possible time target, but it’s not as likely.
Summing up, gold’s rally that we saw yesterday is either inconsequential, if we focus on its performance relative to the rest of the precious metals market, or actually bearish, if we focus on it on a stand-alone basis and compare it to the size of the volume. Moreover, let’s not forget that even though the USD Index declined visibly in the past weeks, mining stocks were unable to invalidate the breakdown below the rising resistance line and the implications remain bearish. There are many signs pointing to a big move lower in the coming weeks and it seems that any short-term strength will be reversed sooner rather than later, especially if the decline in the USD Index is already over. The odds for the latter increased based on yesterday’s rally and the analogy to the previous early parts of major upswings.
We hope you enjoyed today’s analysis, even though it might appear controversial. If you’d like to receive follow-ups, we invite you to subscribe to our Gold & Silver Trading Alerts.
Thank you.
Sincerely,
Przemyslaw Radomski, CFA
Founder, Editor-in-chief, Gold & Silver Fund Manager
Gold & Silver Trading Alerts
Forex Trading Alerts
Oil Investment Updates
Oil Trading Alerts
