

Sounds crazy, right? But from time to time crazy is something that does indeed take place, and these are the times when the prepared are much more profitable than those who were caught with their guard down. There is one analogy that points to the possibility of seeing such a big move in the price of crude oil. What if?
Yesterday, the U.S. Energy Information Administration showed that crude oil inventories rose less than analysts had forecast. Was that a bullish news? In our opinion, absolutely not, because it was the second-straight weekly build in crude stockpiles, which together with rising U.S. production (which reached 10.37 million bpd last week) doesn’t bode well for higher prices of black gold.
Why? If American drillers will continue their activity, the U.S. will replace Russia as the world’s top oil producer. Such situation will likely put pressure on the producers (which have been cutting output due to the earlier agreement in previous months), increasing the risk that they would lose shares in the oil market. What could be the implications of such a development? In our opinion, such an environment will be very unfavorable to oil bulls and they could have problems keeping the price not only above $60, but also above the psychological barrier of $50.
Does it mean that another crude oil’s price war is just around the corner? It's hard to predict – especially as we do not have a crystal ball that would give us a clear answer to this question. Nevertheless, we have charts, which can whisper something interesting about the future of black gold. So, let’s jump into the technical picture of the commodity.
Good Evening, Oil Traders
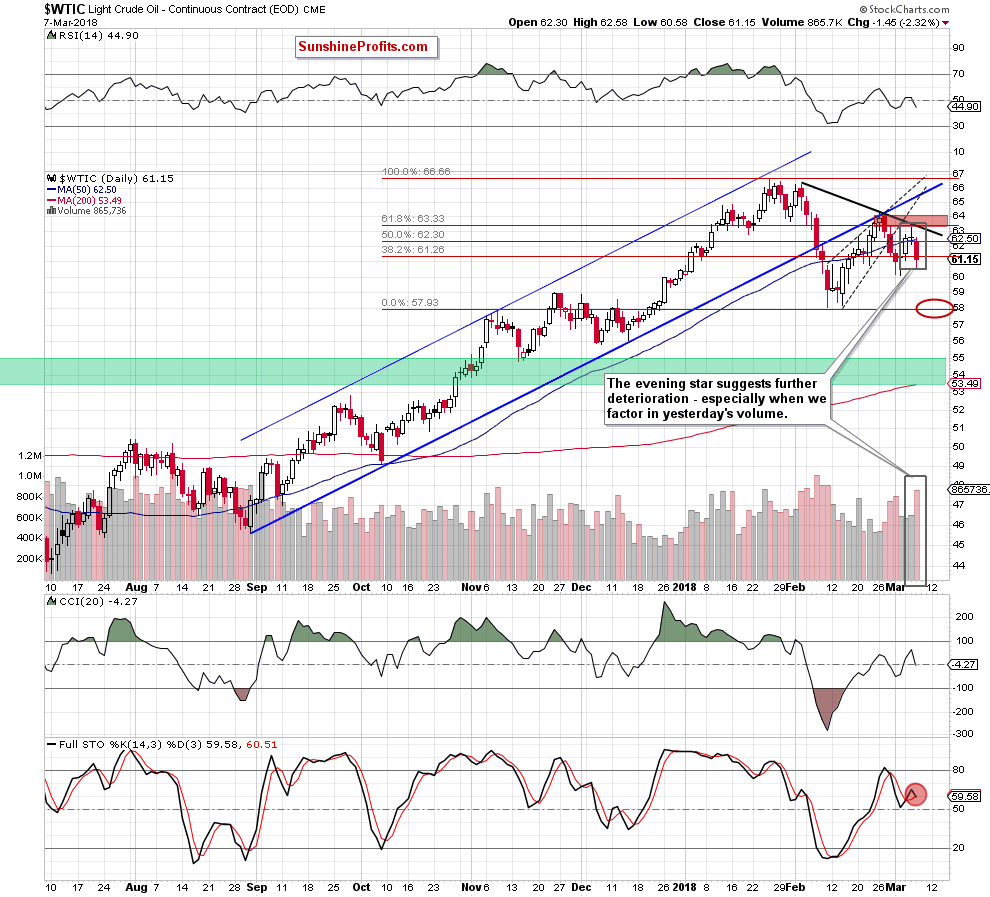
In the previous alerts we wrote that even though the price of crude oil moved higher, it was unlikely that a bigger upswing would follow due to the red resistance zone. This zone was (and still is) based not only on the late-February high, but also on the 61.8% Fibonacci retracement level.
The resistance held. In fact, it was the lower of the above-mentioned resistance levels (the retracement) that kept the rally in check.
What’s new?
Several things.
The first thing that catches the eye, is the fact that yesterday’s decline was accompanied by huge volume – bigger than any daily volume that we saw this month and bigger than any volume that accompanied the previous daily upswings in more than a month. That’s a classic bearish signal.
The second thing is the sell signal from the Stochastic indicator. It’s not profound yet, but it’s present, so we can say that based on it the outlook deteriorated a bit.
Finally, the last 3 sessions taken together create something called the evening star reversal. Since the move that we saw immediately before the formation was up, this reversal has bearish implications.
Overall, the outlook for black gold’s price, based on the above short-term chart, deteriorated.
But aren’t short-term less important than the long-term ones?
Indeed, but the latter doesn’t paint a bullish picture either.
Engulfing Pattern and a Peculiar Analogy
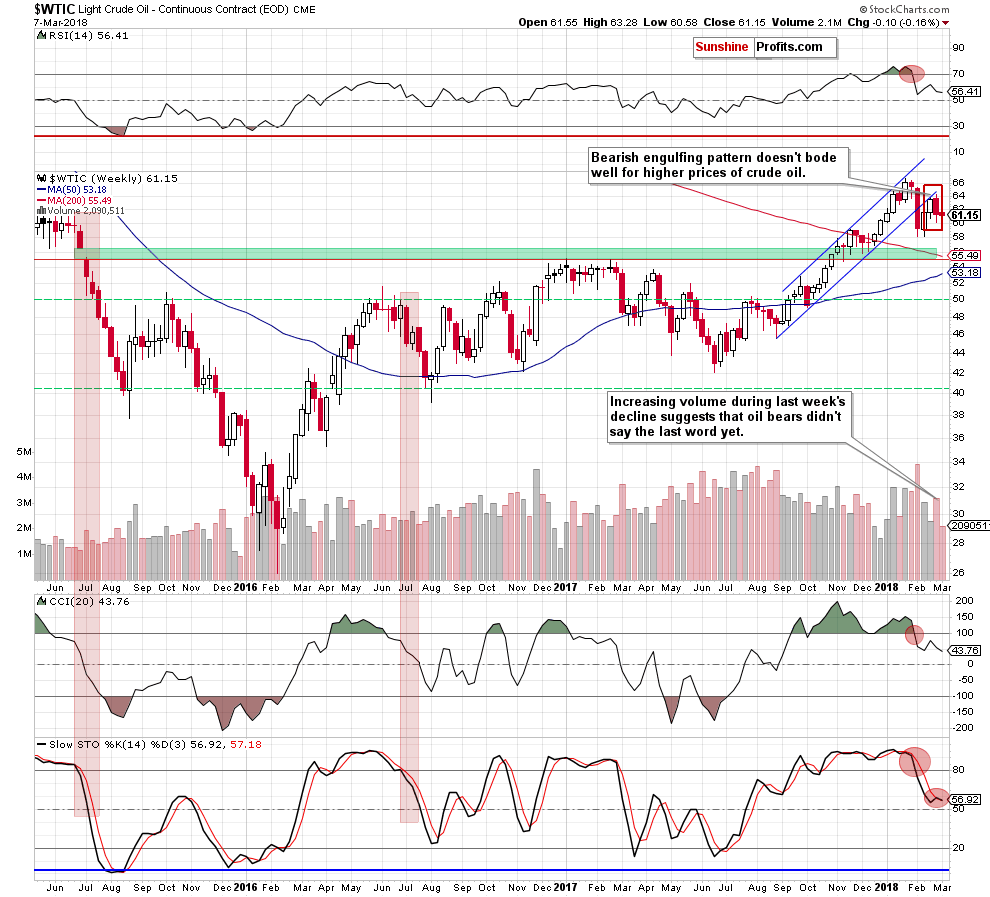
Last week, we saw a bearish engulfing pattern on quite significant volume, which paints a bearish picture for the following weeks. The crude oil is only a bit lower so far this week, so it doesn’t seem that the implications have played out just yet.
Moreover, the sell signals from the weekly CCI and Stochastic indicators remain in place and implications of both are bearish as well. In particular, the situation in the Stochastic is interesting. It moved back to its signal line but didn’t move above it.
The last two times when we saw something similar was in June 2015 and June 2016 (note the red rectangles on the above chart). In both cases the narrowing between the indicator and its signal line meant the final stage of consolidation before another downswing. It was particularly significant in 2015 – the black gold declined more than $10 in just a month.
Truth be told, the history doesn’t have to repeat itself to the letter, but based on the long-term indications, it seems that we shouldn’t trust the upswing that we saw earlier this month.
Will we see crude oil at about $50 shortly? It’s too early to say that. It’s certainly possible based on the above-mentioned analogy, but we would need to see additional bearish confirmations to say that such a huge downswing is indeed very likely. For now, it seems better to focus on a smaller downswing and taking advantage of it.
Summing up, the outlook for crude oil remains bearish and we have both: short- and long-term signals that support it. We could see some short-term volatility based on today’s comments from Mario Draghi and on tomorrow’s US jobs report but in light of the signals that we discussed today, it doesn’t seem that a lot will change regarding the outlook.
If you enjoyed the above analysis and would like to receive daily premium follow-ups, we encourage you to sign up for our Oil Trading Alerts. Sign up now!.
Thank you.
Nadia Simmons
Forex & Oil Trading Strategist
Przemyslaw Radomski, CFA
Founder, Editor-in-chief, Gold & Silver Fund Manager
Gold & Silver Trading Alerts
Forex Trading Alerts
Oil Investment Updates
Oil Trading Alerts
