
Over a month ago I wrote an essay entitled "The January Effect of another January disaster?", in which I commented on the Fed’s recent statement regarding employing all available tools to promote the resumption of sustainable economic growth and to preserve price stability.
I stated that All available tools most likely means increasing the money supply in the most tricky ways, not only by keeping the interest rates low. This is not bullish for USD and it is bullish for gold.
We surely did not need to wait long for a confirmation. According to the recent statement from The Powers That Be, they decided to... (that's right, you guessed it) provide much more money than was previously announced. The Federal Reserve said it would expand the size of a key lending program to as much as $1 trillion from $200 billion. This makes one think - if they are becoming dramatically more desperate on a monthly basis, then what else do they know that we don't? Whatever that is, it is most likely bullish for the precious metals, which are generally known as a safe haven during crises.
Part of this essay is based on the Market Update sent on Feb 11-th, however points raised a week ago, are still relevant today. It seems that the abovementioned news served as a catalyst to a new upswing in the precious metals market. Since my previous essay on market timing was posted, gold gained over $100 and silver gained over $2. These levels are substantially higher, than when I suggested getting back on the long side of the precious metals market. This rally has taken gold almost $200 higher within one month, so it is natural for one to expect at least a modest pullback from here. Please take a look at the following chart (all charts courtesy of www.stockcharts.com
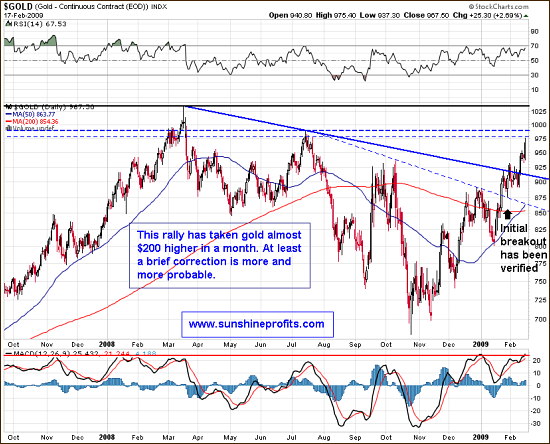
Usually, a strong upswing or downswing moves in a given direction until it encounters some kind of obstacle on its way. Think about it as a solid dam that stops massive amount of water or a fruit that falls from a tree but is naturally stopped, when it hits the ground. However on the financial markets, it is not the water is being stopped, nor the solid ground that stops a falling fruit - it is human psychology that sets the boundaries. After all, people create markets and emotionality is what all of us share, whether we like it or not. There are various techniques to assess what price level will be able to stop a rally or a decline at a particular time, but one of the most common techniques, and also the most intuitive one is drawing a resistance/support line from previous highs/lows. The more important high/low we draw a line from, the more important the resistance/support level is.
On the other hand, the longer a particular rally has been rising, and the more rapid upswing that was, the more vulnerable the market gets to a fast reversal once it touches an important resistance level. This phenomenon can be explained by the fact that rising prices attract speculators and momentum traders, which makes the price rise even faster. This attracts even more speculators and so on. This takes place until someone thinks “hey, I’m not sure if these prices will rise further” and sells. The price stops rising and momentum players run for cover creating another top. When will someone think that prices may not rise further? Exactly at the resistance levels. At the same time, the more profits momentum players have generated, the more likely will they be to close their positions.
Since we have now advanced almost $200 in gold during a short period, it is likely (naturally not guaranteed) that this will happen soon, or that the top has already been put. The above chart presents possible resistance levels that today seem to be capable of stopping this rally. I notified my registered Users that I have closed my speculative long positions on Feb 17-th, as the risk / reward ratio was no longer favorable. Of course, we may go higher from here, but the probability of that taking place is much lower today, than it was the case just a few weeks ago. At the same moment, the profits that could be made by going speculatively long here are rather limited, since we have advanced so strongly in the past weeks. While it does not seem that shorting the precious metals sector is justified here (especially given the fact that this position would be taken against the major trend, which is up) today, it is true that limiting one’s exposure at least temporarily might prove profitable.
Please allow me to digress here - if you already are one of our registered Users but did not receive Market Updates from us due to technical reasons, you can read these messages in the Weekly Commentary section.
Getting back to the current situation on the precious metals market, the point made above is justified by more reasons than just one chart. We are in the situation, where many different factors point to the same conclusion – that we are nearing a top. There is no definite “top” signal, but the “temporary overbought” signal comes from many sources – that is enough to close a speculative long position, but rather not enough to open a short one. Please take a look at the chart below:
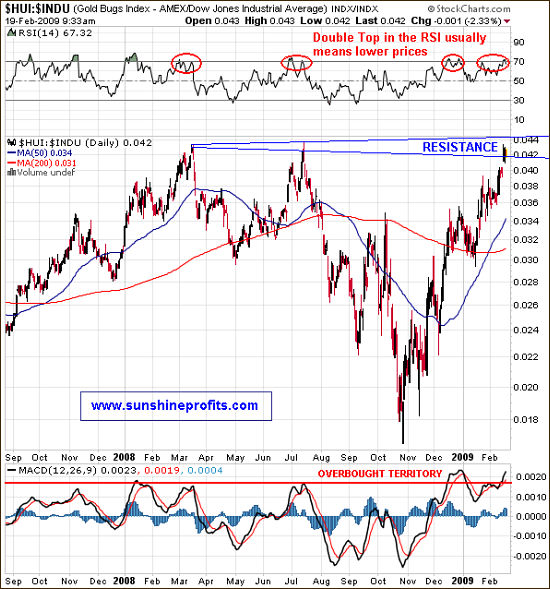
An additional reason to close long speculative positions is that the HUI to DJIA ratio is now at the important resistance level. This ratio emphasizes how much PM stocks are outperforming the general stock market. As this ratio decreases it suggests lower PM stocks' prices unless the general stock market rallies strongly. Even in this case, it is doubtful that a strong upswing in the gold and silver stocks would follow.
Besides the fact that the ratio itself is at the level that suggests a temporary pullback, the corresponding indicators have also signaled that a turnaround is coming. The upper indicator, the Relative Strength Index has formed a double top, which was the case during previous local tops in the PM market. The lower Moving Average Convergence/Divergence indicator is now above the level that has previously successfully predicted coming declines.
Summing up, although undervalued from the long-term perspective, the precious metals market seems to have reached a strong resistance line after an almost $200 rally. This, along with other factors suggests that a local top may be very near.
Of course the market might prove me wrong, as nobody can be right 100% of the time. Should my view on the market situation change substantially, I will send an update to the registered Users along with suggestions on how to take advantage of it. Register today to make sure you won’t miss this free, but valuable information. You’ll also gain access to the Tools section on my website. Registration is free and you may unregister anytime.
Again, if you already are one of our registered Users but you do not receive Market Updates from us due to technical reasons, you can read these messages in the Weekly Commentary section.
P. Radomski
Back