
Another year of the precious metals bull market is behind us. However one decides to describe it, nobody can deny that it was full of epic events. First, gold reached the $1000+ level, precious metals stocks topped, and then started a 70% decline. The size of the steep decline was unprecedented, and so was the following rebound. During the last 2 months, the value of gold stocks has doubled, however the question now is whether this rally is going to last much longer.
No asset can go straight up or straight down and a pause in the gold stocks should be expected. Are we there yet? I think that a local top in the PM stocks within the next few days is quite possible. Of course it is not imminent, as short-term calls are always subjective and you should do your own research before opening or closing any position. Having said that, I am going to show you several charts (courtesy: stockcharts.com) on which I will explain my point of view. The first one is the USD Index chart.
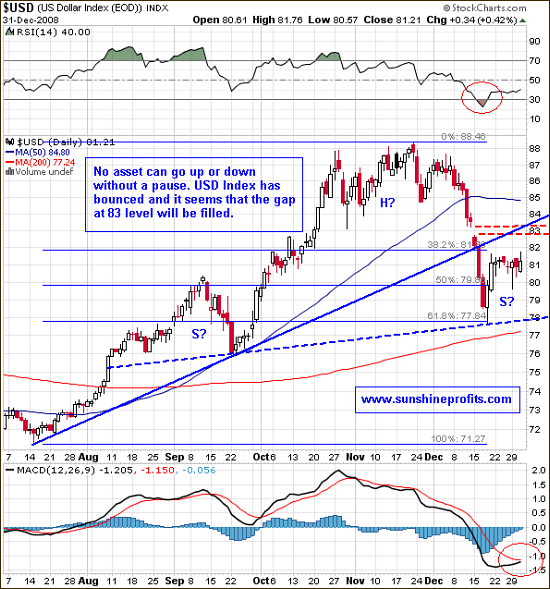
Back in November, the charts favored a parabolic rise to the 90+ area, but as always, one must remain flexible and use the information that the market gives us, instead of telling the market what it should do.
If the situation on the world stock markets will indeed begin to improve, as the charts are suggesting right now, ECB and BOE may not want to cut their interest rates as aggressively as they indicated earlier. Quoting the Fed's latest statement "The Federal Reserve will employ all available tools to promote the resumption of sustainable economic growth and to preserve price stability". "All available tools" most likely means increasing the money supply in the most tricky ways, not only by keeping the interest rates low. This is not bullish for USD and it is bullish for gold.
After breaking the trend line, USD Index stopped at 78, which is the Fibonacci 61.8% retracement level (yes, I sent out an Update just as the USD Index approached that level). The medium- and long-term trends are now bearish, but it seems that the previous trend line will now be verified as a resistance level. At the same time I expect the USD Index to fill the gap around the 83 level. The RSI indicator has already signaled a substantial undervaluation and now MACD is about to cross its moving average. This would be another short-term bullish signal for the buck.
What implications does this have on gold stocks? This sector usually (not always, though) goes in the opposite direction to the USD Index. Since it is the short-term strength that is probable in USD, then gold stock should correct. Let’s see if charts support this view. I have used the GDX ETF as a proxy for gold stocks, as it enables us to analyze volume – which would not be the case with the HUI Index.
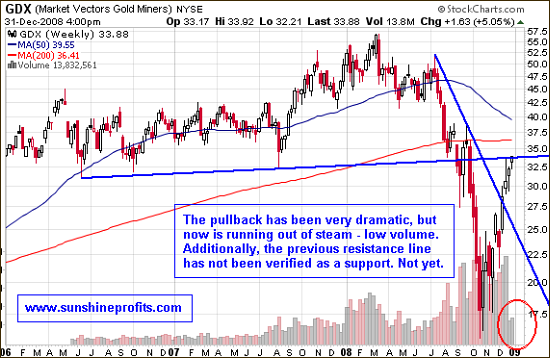
The above chart clearly does not invalidate the previous statement. The precious metals stocks have been rising very sharply and as they have now reached the long term resistance levels. The volume has been very small, which suggests that this rally’s end is near. If the PM stocks form a local top in a few days, where can we expect them to go? One of the most probable targets is the previous resistance level – the descending blue trend line. More details can be found by zooming in to the daily view.
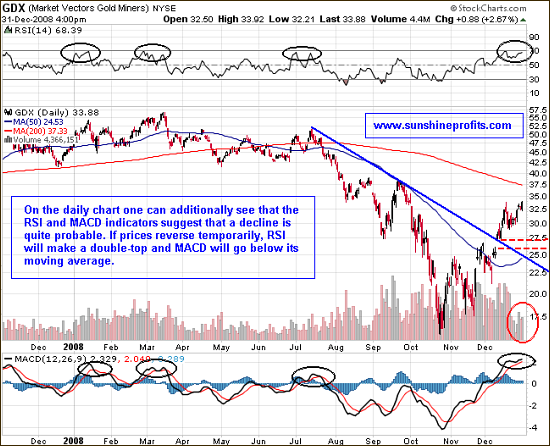
Once again, one can see that the volume has been very small in recent days – less people are willing to purchase PM stocks. What was not visible on the long-term picture is that there is an open gap around the 26 level that should get filled, if we get a pullback. It is located just above the support level that is created as a combination of the previous trend line and the 50-day moving average.
The standard RSI and MACD indicators confirm that we are probably near a local top. RSI is about to make a double top, which meant declines in the past. The short-term bearish signal is also generated by the MACD indicator, as the signal is about to break through its moving average. This is analogical situation to the one on the dollar market, only this time the direction is opposite.
Before entering a specific trading position I usually wait for my indicators to confirm other methods of analysis. This allows me to enter trades at the most profitable risk/reward combination. Although the price may change direction without the confirmation, the probability that such a turnaround will materialize is smaller in this case.
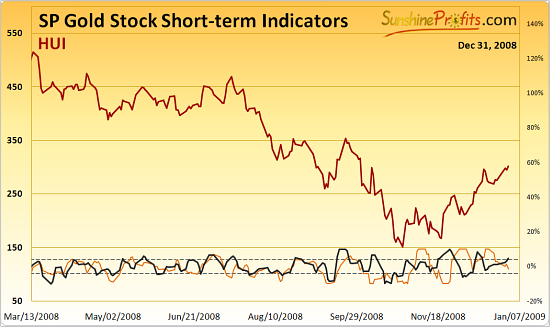
Both indicators (orange and black) are independent and a signal is generated only if both of them go above the upper dashed line (gold stocks are overbought), or below the lower one (gold stocks are oversold). Please note that I designed it with short-term trading signals in mind.
Currently it was not signaled that the top might already be in place, so if the prices are to reverse, it should take another few days.
Summing up, in the previous year, we experienced the most dramatic correction in this precious metals bull market up to date. The plunge was rapid, and so is the pullback that we have seen over the last 2 months. As nothing moves straight up or down, we might expect a pullback in the current rally, and there are several signs that the local top is near.
Of course the market might prove me wrong, as nobody can be right 100% of the time. Should my view on the market situation change substantially, I will send an update to the registered Users along with suggestions on how to take advantage of it. Register today to make sure you won’t miss this free, but valuable information. You’ll also gain access to the Tools section on my website. Registration is free and you may unregister anytime.
P. Radomski
Back