
This essay is based on the Premium Update posted on May 9th 2009. Visit our archives for more gold articles.
There was hype and hope in the financial markets this week when results of the much anticipated bank stress test were revealed. Just as I had suggested in the last week's Premium Update, the results were better than expected. The federal government announced essentially that 10 large banks will need to raise about $75 billion in additional capital - a substantial sum under any circumstances - but less than many investors had expected.
In one of the essays posted on Yahoo! we can read the following:
U.S. regulators told 10 of the biggest U.S. banks late on Thursday to raise a total of $74.6 billion, which was less than investors once feared and helped lift European and U.S. bank shares on Friday.
It seems to me that Friday's move was not significant enough to attribute directly to the news of the stress test results. I wrote last week that the key factor will be how the market will perceive these reports. Now we know that the tests did not come as a shock to the market, and in fact, their influence is barely visible in the charts. The significant point is that these tests turned out to be a tempest in a teapot. Their release did not change the fundamentals nor the technical picture as far as the general stock market is concerned. There has been a noticeable effort by U.S. government officials to convey confidence and calm. Consumers, investors and businesses are being lulled by a sense of stability. The financial markets may be reflecting too much optimism and if confidence falls again, it will be that much more difficult to restore. With the Obama honeymoon coming to an end, it will be interesting to see how the markets move without government influence.
Moving on to the technical side of the market, the last week was the week of initial breakouts, which have not yet been confirmed. Let's begin with the general stock market. We need to look at the broad market to get more clues to the big picture. Charts are courtesy of stockcharts.com.
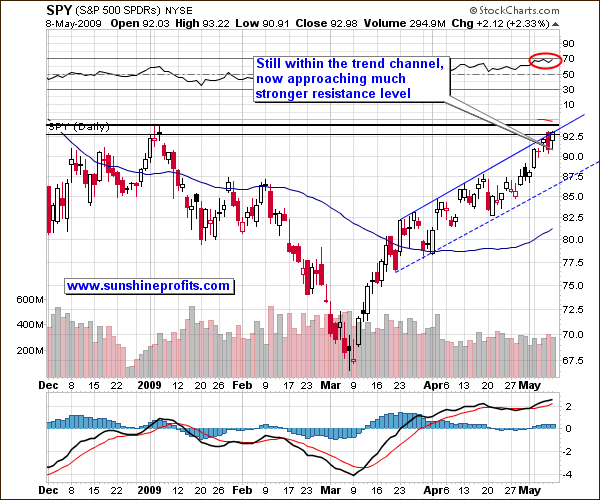
Signals from the broad market are usually more meaningful as they are a better proxy for the whole market and not just for the Blue-Chips. If we look at the SPY chart, (the ETF that tracks the S&P 500) we see that we are testing one resistance level and are just approaching a much stronger one. This foreshadows a pullback. Gold has been moving rather in tune with the general stock market in the last few days, so it indicates that gold may also to pull back.
The only issue that concerns me with this analysis is that the bullish case hasn't been fully played out in the media, leaving room for additional upside. I constantly read the financial news in print and the Internet and I haven't seen too much bullish commentary. This paucity of bullish sentiment, however, is not in itself a necessary condition for a top to form.
As I mentioned last week, the USD Index is once again more important short-term factor for the short-term moves in the price of gold, than the general stock market is. This week, we have witnessed a particularly interesting development on the dollar market.
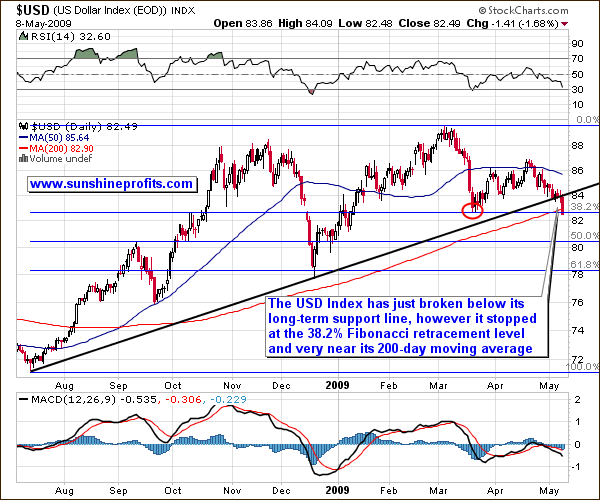
One way to look at it is The dollar whipsawed against the major currencies in early Friday trading following a key US labor report that many traders saw as a sign that the relentless pace of job losses was beginning to level off slightly. In the midst of all the grim unemployment news, some economists saw glimpses of a bottom in the latest dour news of job losses. Naturally, there might have been other, psychological reasons, but the bottom line is that the long-term trend line has been broken.
A look at the US dollar index indicates that although a sell-off is more likely than it was a week ago, it is still not a foregone conclusion. The odds of a further decline are not high until we see the price close below the previous support line for three consecutive days, or a bounce to the support line touching it, and then declining again. We will need to wait for additional confirmation.
Dollar has just declined sizably, which contributed to a rise in the value of the precious metals. Please take a look at the following chart for more details.
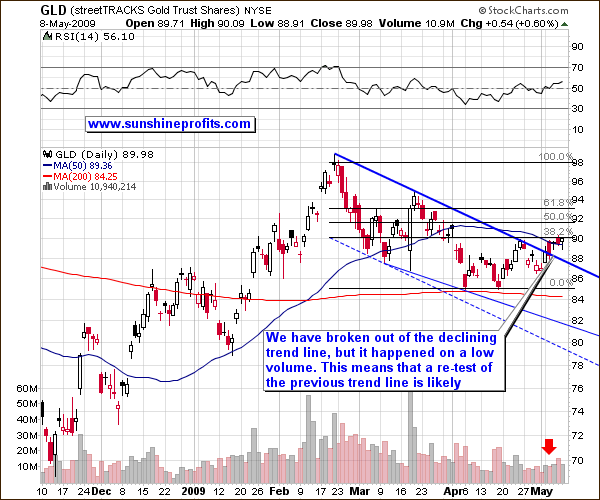
A look at the Gold chart shows that should the previous trend line hold - this could provide us with a chance to close short positions and open long positions in this sector. Gold prices are likely to retreat in a few days, but then rally to more robust levels. This could correspond to a similar test of the USD market. Higher gold prices are i.a. result of the debasement of paper currencies happening all over the world. Nearly every federal government in the world is printing money as if the world is about to run out of paper. We all know there is no such thing as a free lunch, and gold price reacts accordingly.
Summing up, although gold, silver and the USD Index have just broken out, these breakouts have not yet been verified. Volume is a major factor here, so it's difficult to say in advance what may happen this week. As far as the long term is concerned - there are no changes here. I believe it is best to remain invested right now - after my suggestion to complete long-term purchases near the April bottom. Please note silver's strong performance since I wrote about it being in particularly favorable long-term situation before the end of April.
Of course the market might prove me wrong, as nobody can be right 100% of the time. To make sure that you know my thoughts (including information not mentioned here) on the market as soon as I post them, I suggest signing up for my free mailing list. Sign up today and you'll also get 24 hours of access to the Premium Sections on my website (including tools and charts dedicated to PM investors and speculators), which I believe you will find interesting. It's free and you may unregister easily.
In other news, I am happy to announce that we have just added an additional feature to our Tools section (The Correlation Matrix) that will help you in your investing strategies. With this tool you can check what are the key markets that may have the biggest "influence" on the sector that you are interested in (metals, PM stocks, juniors) in coming days/weeks/months. It should prove particularly useful in detecting the catalyst for either breakout or breakdown, which consequently should increase the odds of making the correct decision regarding your portfolio. The Correlation Matrix is based on the table included in the last week's essay.
P. Radomski
--
The results of the bank "stress test" have been released, but their overall impact on markets has been rather limited and this is one of the things that I wrote about this week.
