
This essay is based on the Premium Update posted on May 30th, 2009. Visit our archives for more gold & silver articles.
This year's bad economic news overshadowed the aspect of geopolitical risk, which again reared its ugly head over the past few weeks. North Korea has just conducted a new nuclear test and fired short range missiles. Iran has made several moves that in slower news cycles would have dominated the headlines. Israel, worried about the situation in Iran, is conducting a five day drill, dubbed 'Turning point 3," to prepare Israel's rapid response capabilities in the event of simultaneous missile strikes and terrorist attacks. All this is bad enough without mentioning other flash points, such as Afghanistan, Pakistan, Nigeria and Venezuela.
Yes, geopolitical risk is back. It never went away, we just overlooked it while being inundated with the worst financial news in recent memory. However, faithful subscribers to Sunshine Profits Premium Service have gold and silver in their portfolios and that makes us feel a bit safer, at least financially. Remember the Golden Rule: he, who owns the gold, makes the rules. Moving on to the technical side of the analysis, I'll begin with the silver market.
Silver
I covered the white metal in one of the previous essays (April 20th), in which I wrote that silver formed several cup-and-handle patterns. The implications at that time were that once silver completes this pattern, the following move would be substantial. Since I first wrote about it a month ago, silver did indeed complete a cup-and-handle pattern and did move 30% higher. (There is nothing like a good cup to make a trader happy when proven right.)
On the other hand, since this move has been swift, it is natural to expect some kind of a consolidation. There were signs that a local (short-term) top may have formed during the past several weeks/days, but none proved to be the true top. However, now we are approaching a long-term resistance level, more significant than its short-term counterparts. Charts are courtesy of stockcharts.com.
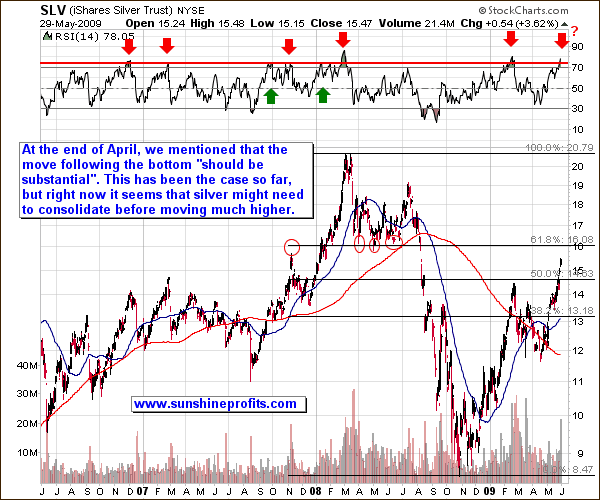
The first thing to notice when looking at the lower portion of this chart, is that silver, always known to be volatile, has grown even more so this past year. This can be partly attributed to the big-pullback effect that we have seen in the entire precious metals sector, and to the plunge in the general stock market which dragged virtually every asset class much lower.
Why did this happen? The answer can be found in terms such as "deleveraging" and "fear." When all hell broke loose last year, massive amount of money were needed to be raised immediately by hedge funds and other financial institutions to cover losses on the stock and futures markets. When in a desperate need for cash to offset gargantuan losses, a hedge fund manager will sell everything in sight, no matter how favorable the fundamental situation might look in a particular asset, such as silver, for example. Once investors see the plunging prices of their favorite investment, they tend to forget the reasons why they bought silver in the first place and that they planned to hold it for a long time. Driven by fear, they sell, sell, sell, usually near the bottom.
It was only several months ago when we experienced a massive plunge in precious metals and mining stocks. Since the plunge was severe while the precious metals market fundamentals remained bullish, we saw a sizable rebound in the entire sector. Those, who sold their holdings began to realize that this was just a temporary downswing and were eager to buy back - as the fundamentals are still intact.
During especially emotional periods in the stock market, we can see every asset class move in the same direction, driven by emotion rather than logic and analysis. Once the smoke clears and emotions subside, most investors begin to look at the fundamentals rather than relying on gut-feelings. They get back to the logical side of the market, which in this case, means back to investing in the precious metals.
If we take a look at the silver chart, we see that silver is just about to reach the $16 level. I have used the SLV ETF as a proxy for the silver market. The price of spot silver is about 1% higher than the value of this fund, so the resistance price level is not much affected given the size of the preceding move and the fact that the resistance is "around" the $16 level rather than precisely on it. This situation is caused by the fact that apart from the classic 61.8% Fibonacci retracement level which points to the $16.08 (SLV ETF) level, we have seen several bottoms and tops around this price level. I have marked them on the chart with red ellipses. Please note that price has not stopped precisely at $16, but it has hovered around it many times.
Gold Stocks/General Stock Market
The GDX:SPY ratio measures the way PM stocks perform compared to the general stock market. The ratio can be analyzed technically just like any other chart. By doing so, we can gain additional insight. At times, we may be able to spot something otherwise not visible when analyzing these markets separately.
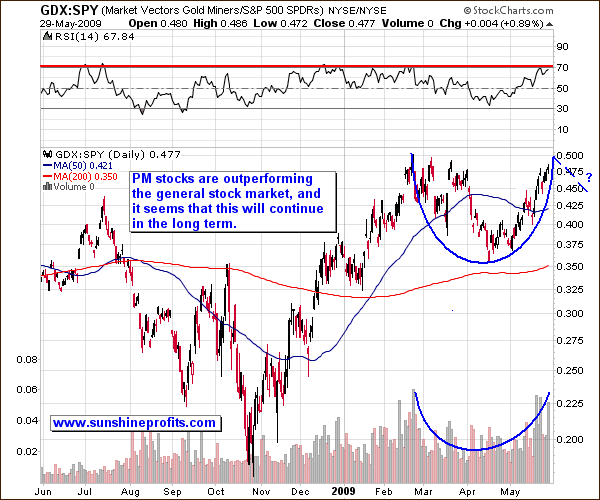
If you recall, I already mentioned earlier in this essay that silver has completed its cup-and-handle pattern and moved much higher afterwards. It seems that a similar cup pattern is visible on the GDX:SPY ratio chart. It is not yet very certain that the full formation will materialize, and we are still missing the "handle" part of the formation. In previous weeks I have emphasized that a correction in the PM sector is likely. Should it take place, the GDX:SPY ratio would also most likely decline. In other words, if we get a correction in gold, silver and mining stocks, that event would most likely create the "handle" in the cup-and-handle pattern. Should this cup and handle formation complete, the implications for the PM sector in the medium-term would be important and positive, as the move following a cup-and-handle pattern is often substantial. Additional details will be made available to our Subscribers once we complete this formation or it will be canceled in any way.
The key question is what will happen to the general stock market? Of course, it is much too early to make any calls, but with the correlation table, we'll be ready to take the appropriate action either way.
Summary
The precious metals market has been rallying very strongly in the past several weeks, which has happily contributed to increasing our net worth through our long-term holdings. Still, at the moment, it seems that the prices of precious metals and corresponding stocks have gone too high, too fast, and a healthy correction is likely. Although prices of gold, silver and mining stocks are reaching their own resistance levels, such a correction will most likely be caused by some kind of catalyst, most likely a strong move in the U.S. Dollar, or in the general stock market.
To make sure that you get immediate access to my thoughts on the market, including information not available publicly, I urge you to sign up for my free e mail list. Sign up today and you'll also get free, 7-day access to the Premium Sections on my website, including valuable tools and charts dedicated to serious PM investors and speculators. It's free and you may unsubscribe at any time.
P. Radomski
--
This week we see the return of geopolitical risk and go into great depth to discuss what may lie ahead for the precious metals sector, with emphasis on silver. We also analyze technically the correlation between gold stocks and the S&P Index. There is an interesting pattern forming which could be important for PM investors and speculators.
