
In my previous commentary, I emphasized the fact that the dollar has not broken down decisively from its trend channel, which therefore remains up. This situation has changed in the recent days. Consequently, the aim of this essay is to explain what implications the recent developments have on the precious metals market’s technical picture. Naturally, prior to posting this essay, I have sent out a Market Update, in which I explained my preferred way of dealing with this situation.
The U.S. Dollar Index has broken below the trend line and closed there for 5 consecutive trading days confirming the breakdown. The breakdown below the 50-day moving average is not confirmed yet, so the situation remains rather unclear. Therefore, in order to determine the most probable short-term outcome for the gold stocks I will focus on other key factors. These are gold and the major world stock indices.
Before I proceed with my analysis, here’s a quick reminder regarding my methodology. The fundamental factors decide where each market goes eventually; however in the short term it is the emotions and psychological mechanisms that determine the direction in which the price is headed. The human psychology changes very slowly, so the situation when a particular price pattern repeats is not only probable, but can also be profitably traded. Usually more similarities between two situations mean higher probability that the outcome will also be alike.
As far as gold is concerned, I indicated that we may be beginning another downleg, similar to the one we’ve seen in October. It seems that this might have been correct, but a bit premature. Please take a look at the chart (all charts courtesy of stockcharts.com) below for more details.
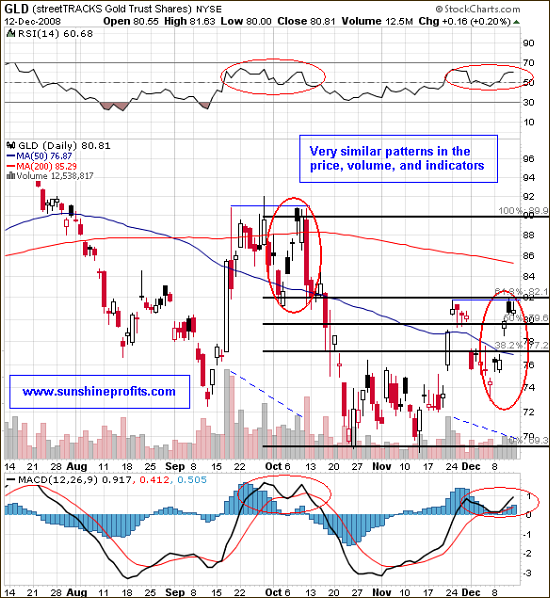
In order to present you with the volume which is also similar in both periods, I used the GLD ETF as a proxy for the price of gold. First of all, take a look at the way the price of GLD shaped prior to the sizeable October decline, (even with emphasis on daily movement) – marked with a red ellipse. Now please take a look at its recent performance, also marked with a red ellipse. These periods are almost identical! Naturally, the size of the rally preceding the September / October top was bigger, but the overall shape of the whole upleg is indeed very similar to what we have experienced recently. This true not only for the ‘double top’ pattern that materialized after a very sharp upswing, but also when one compares the daily returns from the marked areas (here symbolized as white and black candles). This indicates that a sharp sell-off is likely in the gold market.
I used the ‘double-top’ description – that is, if we get one, as at the moment of writing this commentary, it is not certain that this is indeed a top. This is probable as the history tends to repeat itself to a considerable extent, however there are also factors pointing to the fact that the opposite may be true this time. During the previous several months the price of gold has been rather positively correlated to the price of gold – it usually moved in the same direction. There are no convincing evidence that this has changed, so if the stock markets rally, we might expect the same type of movement in the precious metals.
I used the plural form intentionally, as the majority of world’s main stock indices have broken out of their downtrends. The previous resistance levels are now being tested as support. A brief test confirmed the breakout, but given the size of the previous decline, I would prefer to see a breakout of a confirmation on a very strong volume. Nonetheless, the trend lines have been broken and this is a bullish development. Below you will find charts of several stock indices which emphasize the moment of breakout and testing the new support.
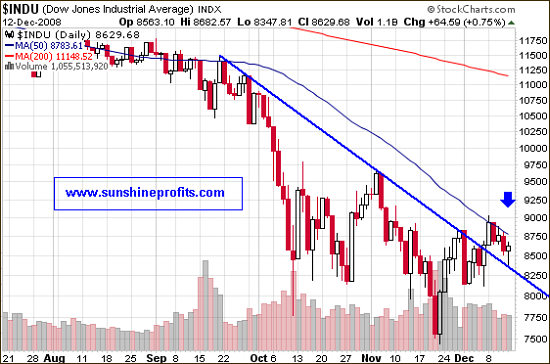
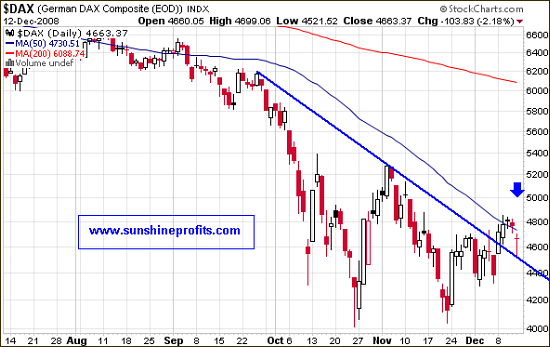
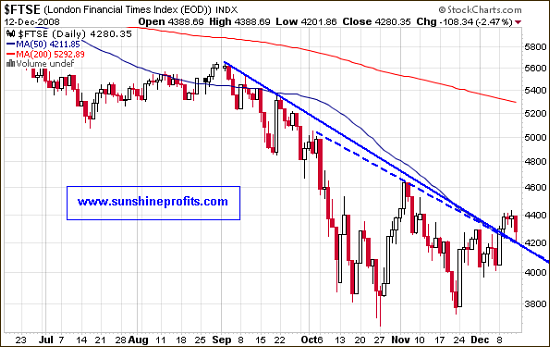
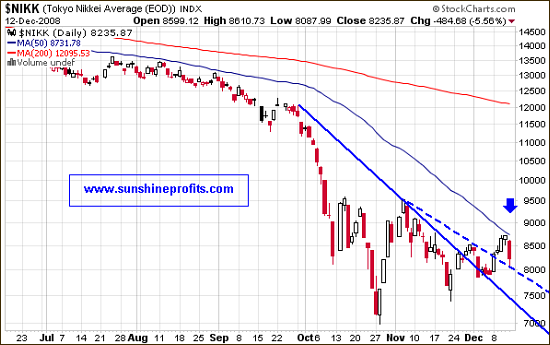
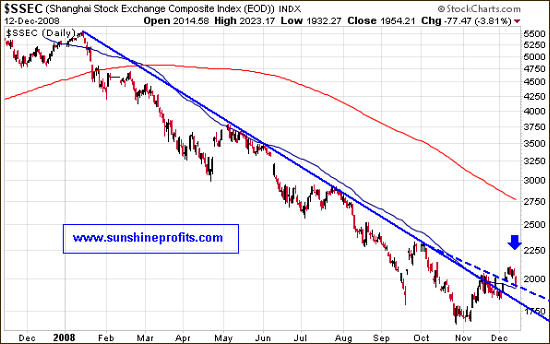
The breakout is repeated in many markets, which makes the signal itself stronger – after all, capital markets' globalization is highly advanced.
Combining all of the above signals with the situation on the USD and gold markets gives us several contradictory signs when it comes to determining the direction in which the precious metals stocks will head next. A detailed view on this market should provide more information.
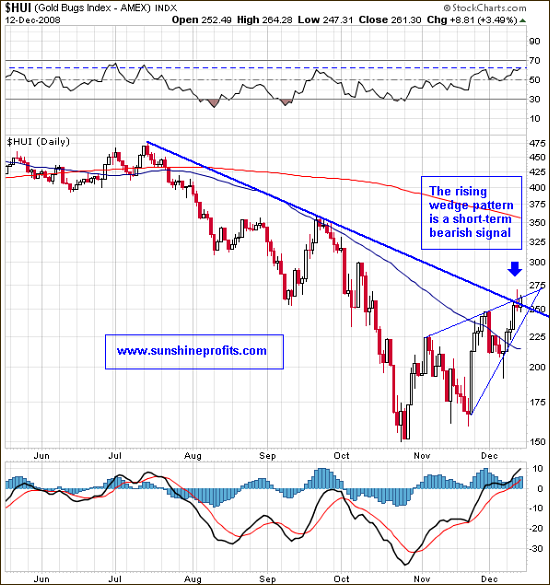
The precious metals stock themselves are now at the critical point. This is the multi-month resistance level combined with the end of the rising wedge pattern. Most breakouts from this pattern are to the downside. However, if we get a positive influence from the general stock market, the HUI Index should follow. As mentioned earlier, the situation on the gold market itself (which ultimately determines the value of gold stocks) favors a sell-off in the near term.
It is therefore extremely difficult to determine the direction in which it all plays out; however, I can say that I expect the next move to be volatile. Since fear is much stronger emotion than greed, I believe that a decline from these levels would be more volatile than an upswing.
Summing up, we are at a critical point in many markets, and most of them influence the prices of the precious metals stocks. Once the direction is determined, it is highly probable that the following move will be substantial.
Of course the market might prove me wrong, as nobody can be right 100% of the time. Should my view on the market situation change substantially, I will send an update to the registered Users along with suggestions on how to take advantage of it. Register today to make sure you won’t miss this free, but valuable information. You’ll also gain access to the Tools section on my website. Registration is free and you may unregister anytime.
P. Radomski
Back