
This essay is based on the Premium Update posted on April 11th 2009. Visit our archives for more gold articles.
In the following essay I would like to continue the topic covered briefly last week. On Monday, April 6th, I wrote the following:
(...) the lower border of the descending trend channel might serve as a solid support that could stop this plunge. Additionally, the $850-$860 range would correspond to the 50% Fibonacci retracement level. Markets often correct half of their gains before resuming their previous trend and we may also see it in the gold market. We are not there yet, so it is difficult to estimate how probable it is that the bottom will be put right there. There are many more factors that we will be able to take into account while, once we get there.
Since we have just got to the point I referred to, I believe an additional comment is necessary. Please take a look at the following chart (charts are courtesy of stockcharts.com).
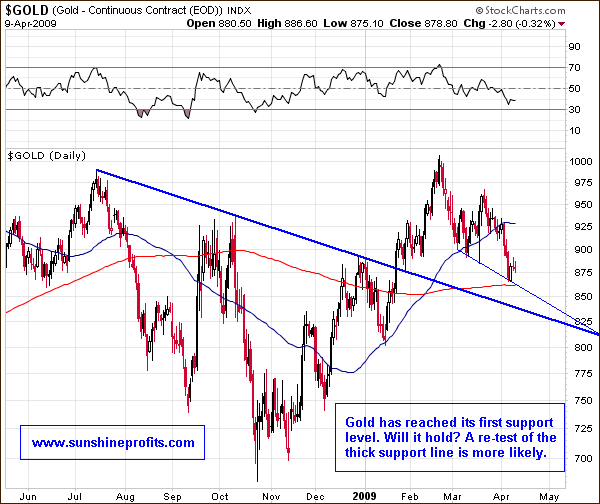
As you may see on the chart above, gold has dropped briefly below the $875 level (which is also close to its 200-day moving average) and has now bounced. This level corresponds to the previously mentioned thin, solid line. Was that the bottom? Perhaps, but I would like to see a confirmation from other markets, before announcing that this is indeed it; for instance I would prefer to see gold stocks outperforming the metal itself. This has yet to happen, but I will get back to this in a few moments.
The support level, from which gold has briefly bounced right now, is created i.a. by the descending line drawn from three previous lows. They are rather close to each other, which means that the "strength" of the support level is not very significant. This is partly why I was reluctant to call this level as my prediction in my previous update. However, it is significant enough to generate at least a small pullback. In fact, since gold has declined about $100 in a few weeks, it wouldn't surprise me to see it bounce one more time before completing the correction. I have not marked it on the chart, but the previous (March) lows could serve as a resistance here.
The premium update, on which this level is based, covers additional support levels, but here I would like to focus on the one that I find the most significant taking into account current market juncture. I have marked this level with the thick trend line.
The support level that I'm referring to is created by drawing it through 3 important tops, and these tops are at least 2 months away from each other. Since gold has already broken this line, it has become a strong support. Please note that it has been verified only very briefly (on an intraday basis) in January. For the support line of this significance (has successfully served as resistance for medium-term tops), this type of a test is almost not worth mentioning. This is what makes this line a very strong resistance level and I personally think that it has relatively high probability of stopping current decline. Not only would it correspond to a little more than 50% correction (thus making the following rally more sustainable), but it would also verify the breakout above this line.
The situation on the silver market is very similar to the one mentioned above, so I will not cover it deeply here. I plan to take a closer look on silver technical situation next week.
Commenting on precious metals stocks is usually necessary to gain more insight into the situation on the metals market, as it is this market which often leads the metals.
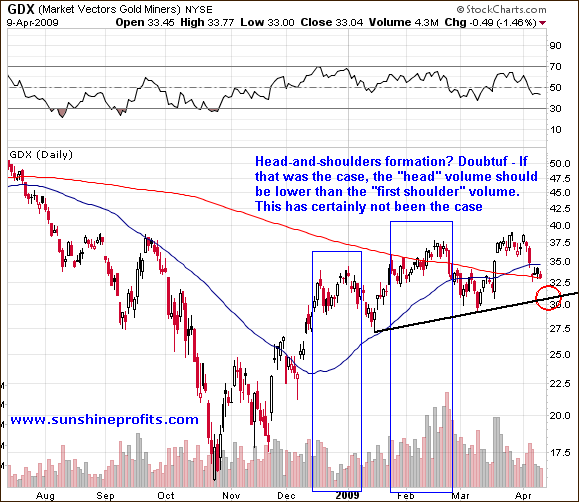
The precious metals stocks are right in the middle between their recent resistance and support lines. Taking into account the fact that precious metals stocks often correct in the zigzag (abc) fashion, we may infer that we are halfway through with this decline. This would also correspond to the support line marked on the chart above. Today it seems that the GDX ETF (proxy for precious metals stocks) could bottom just around the $31 level - area marked with a red circle.
I believe that some investors might be concerned that we are forming a head-and-shoulders (reversal) pattern in the PM stocks, so I have also marked the "first shoulder" and "head". In short - I view the probability of that taking place as relatively low.
Before starting to worry about the possibility of a severe plunge, please consider the chart above. Even if prices break down through the support line, this formation will not be confirmed by the volume, and therefore will be particularly vulnerable to a quick reversal. Again - we may get lower, especially if the general stock market plunges, but I am not suggesting shorting the precious metals sector at this point nor in case it breaks below the abovementioned support level.
Summing up, precious metals are now in completing their correction. Since these markets have recently moved rather along with the general stock market it is important to establish the direction in which this market will head next. In my view the odds favor lower prices in the short term, which means that what we have just witnessed on the PM market was not the ultimate bottom yet.
Of course the market might prove me wrong, as nobody can be right 100% of the time. To make sure that you know my thoughts (including information not mentioned here) on the market as soon as I post them, I suggest signing up for my free mailing list. Sign up today and you'll also get 24 hours of access to the Premium Sections on my website (including tools and charts dedicated to PM investors and speculators). It's free and you may easily unregister anytime.
P. Radomski
--
The Premium Update contains more charts and the first (gold) chart mentioned in the free commentary contains additional support lines that can prove valuable for you, when you try to time the coming bottom. You may see it here.
