
We did not expect this correction to go so low, so fast, but we also did not rule it out completely. It has happened and we have to deal with it, whether we like it or not. We sent out an alert yesterday to our registered Users, in which we wrote that we think that we are near or at the bottom in the precious metals and we outlined our preferred method of taking advantage of this situation.
In this essay we are going to use charts to show you some of the signals that made us send the latest alert. Since this commentary is dedicated to PM stocks we will start with a chart of the HUI Index from the long term perspective. All charts in this essay are courtesy of stockcharts.com.
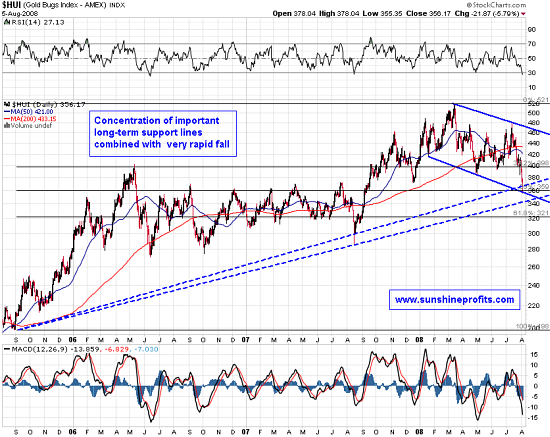
The first thing that comes into mind when looking at the chart above is that in the previous several weeks PM stocks have fallen by 25%. This has been one of the most dramatic downswings in the history of this bull market up to date, also because of the short time frame in which it materialized. This alone is enough of a reason to make one eagerly look for the signals of the coming bottom. After all, the rebound after such a dramatic decline could also be very fast.
Long term (dashed) trend lines suggest that a this decline may be running out of steam. We have created two lines: one was made using intraday lows, whereas the second one is drawn based on the closing prices. Using each of them has its own reasoning and supporters, so we are just going do use both of them. The general tendency is that the trend line drawn using intraday lows provides support for future intraday moves. The line drawn using closing prices provides respectively support for future closing prices. Either way, the space between these two lines can be viewed as a support level.
Another important support is generated by the lower border of the declining trend channel, which we have just touched yesterday. The last, but definitely not the least support level that we feature on the chart above is the 50% Fibonacci retracement level (thin, black lines). It is very important, since this is a solid, long-term pattern, whose 61.8% level already served as a top in the May of 2006 and also as a rough support when HUI fell from above 500.
All of these levels combined with the rapid manner in which the decline took place, suggest that at least a temporary rebound is likely. Having covered the HUI Index, we will now examine the situation in the underlying metal – gold.
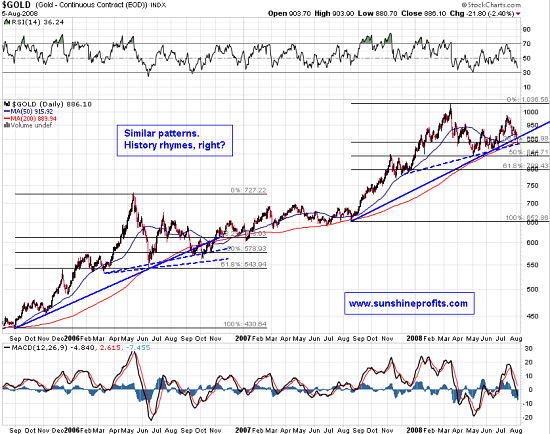
On the chart above one can see an analogy between the current situation and the price patterns (time frames, range, support levels) that materialized two years earlier. In the year 2006 gold corrected to about 61.8% retracement level, bounced, and then briefly fell below the higher retracement level (50%). Right now we have had gold falling to the 50% retracement level, bouncing, and now it briefly fell below a higher retracement level (38.2%).
In 2006, the solid trend line was also briefly broken to the downside and the same thing happened recently. In the past that signaled that the bottom is very near. This could be the case right now. Moreover, this hypothesis is confirmed by the dashed support line, which has been drawn using the local bottom prior to the main top and the bottom which followed it.
We have created one more chart with platinum, as a recent sector outperformer, which has just fallen very sharply.
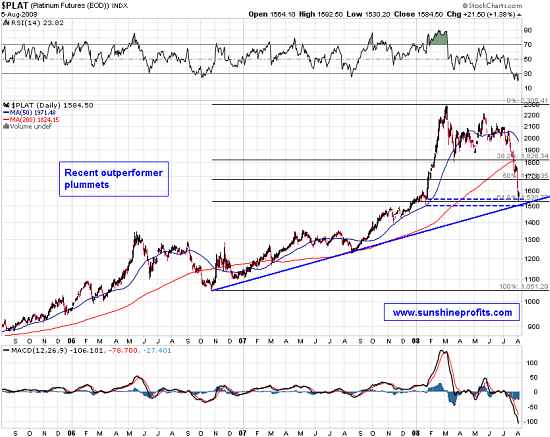
From our experience, this kind of situation happens close to the end of the consolidation or a decline. Usually the sector or even a particular stock holds up quite well during early stages of a consolidation or a decline, and falls sharply and temporarily as the correction matures. This is exactly what happened in the platinum market in the last weeks. Furthermore, platinum managed to rise yesterday, despite the weakness in other precious metals – seeing a leader to regain strength is a very good sign for the whole sector.Summing up, we believe that we have either seen the bottom right now, or we will see one soon, perhaps following a small pullback from current levels.Of course the market might prove us wrong, as nobody can be right 100% of the time. Should our view on the market situation change substantially, we will send an update to our registered Users along with suggestions on how to take advantage of it. Register today to make sure you won’t miss this free, but valuable information. You’ll also gain access to our Tools section. Registration is free and you may unregister anytime.
P. Radomski
Back
