
In the previous commentary I suggested that we may have another downleg in the gold stocks along with the decline in the general stock market in the next several days or weeks. We experienced a small bounce, but now the situation continues to unfold as indicated. The globalization of financial markets makes it prudent to analyze not only the market that one is interested in, but also various markets that can influence it. I previously presented a brief analysis of the precious metals stocks and the general stock market. To make it complete, this week I will focus on the situation on two other crucial markets that determine the price of precious metals shares: gold itself and the U.S. Dollar.
Before I continue with this commentary, I would like to point your attention to the fact that the precious metals markets are already oversold and that timing the exact bottom should be viewed as a speculation. I do not recommend waiting for the bottom with all of your capital. For this essay I have prepared four charts (courtesy of stockcharts.com) that present the situation on the abovementioned markets from both long- and short-term perspective. I will begin with the analysis of the U.S. Dollar long-term chart.
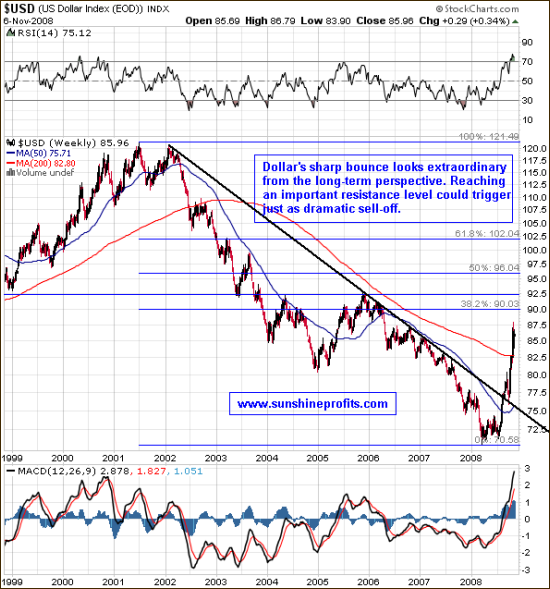
After topping in 2001, the value of the dollar has been decreasing with only one major correction (2005) along the way. That is until recent months, where dollar put a low just above the 70 level and began to rally. So far this upswing took it to the high 80’s, and the question in minds of most precious metals investors and every forex trader is ‘is this it?’.
Currently, in my view, there are no clear signs of a trend reversal just yet, but one can speculate on the price levels that will stop this rally. We are getting near serious, long-term resistance levels. First of them is the Fibonacci retracement level. Dollar is now correcting after 7-year decline and the 38.2% is a likely minimum for such a correction. This corresponds to the 90 level on the chart. The second important resistance level is 92.5, as it proved both support
and resistance in the past.
Let’s see if these levels correspond to what one can infer from the analysis of a short-term chart.
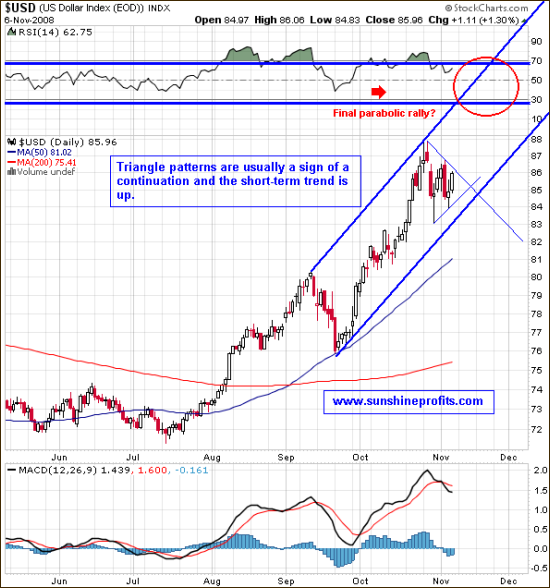
I have marked the previously mentioned resistance levels with thick blue lines. I agree that they are considerably higher than where the USD is at the moment, but reaching 90 or more is not that unlikely given what we have seen in the last few months.
So far USD did not test the lower border of its short-term trend channel and I think that it may not do it this time either. In my view, there is a higher probability that the dollar will break out of the triangle pattern and end this rally in a parabola fashion. The triangle patterns are usually (about 60% of the time) a sign of a continuation, which would imply that there is a 60% chance that we are going higher in the short term. Unless we reach or get very close to the 90 level, the USD would have to break down the thick support trend line and stay below it for some time to convince me that this rally is done.
What do you mean? Dollar is going up? But the fundamentals are awful!
Yes, they are, but remember that the USD Index is a weighted average of the currency exchange rates and the fundamentals of other currencies need to be taken into account. For example – we have a crisis and a LOT of dollars is created, as the powers that be assume that this will help the economy (as if that was not the root of the problem). If there is also a massive creation of other currencies, then their value depreciates as well. ‘The currencies do not float; they sink at different rates’. If the value of other currencies depreciates faster, then the USD Index will be rallying, despite massive creation of USD, as its relative value to other currencies will increase. I am not saying that this is exactly what is taking place today, as in the short term there are also emotional factors that need to be considered, but I would like to draw your attention to the fact that USD may indeed rally despite very bad fundamentals.
Gold is priced in the U.S. Dollars, so the aforementioned rally will most likely have a negative impact on the prices of gold in the short term. If so, how low can gold go?
As mentioned at the beginning of this essay, gold is already oversold, but that does not mean that it cannot get more oversold in the short term. Having my long-term capital invested, I still keep some powder dry to speculate on the possible turnaround in the precious metals market. For this part of my holdings, establishing a support level that may stop the decline is essential. That is if the bottom is already not in place, which may be the case – and a double bottom could emerge.
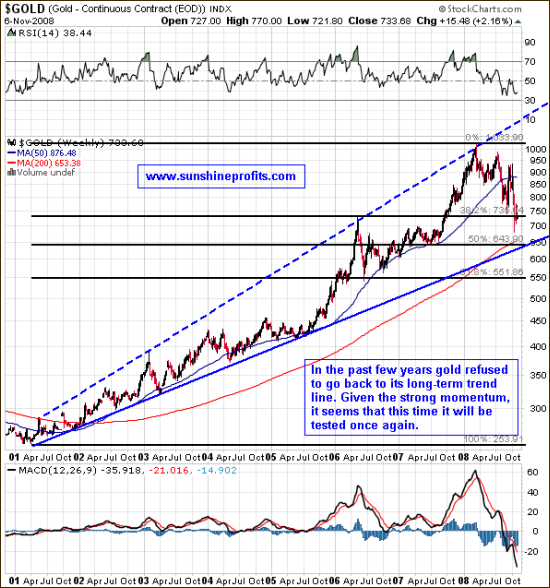
However, right now I view the possibility of further declines as more probable. As the U.S. Dollar corrects its 7-year downtrend, gold is correcting its own long-term uptrend. Unlike USD, gold did not break its rising trend slope, which still offers very strong support. Currently this support corresponds to the 50% retracement level calculated from the whole bull market – the $640 level. This is a powerful combination that could stop this decline once gold gets so low.
Before concluding, we would like to draw your attention to our last, short-term chart.
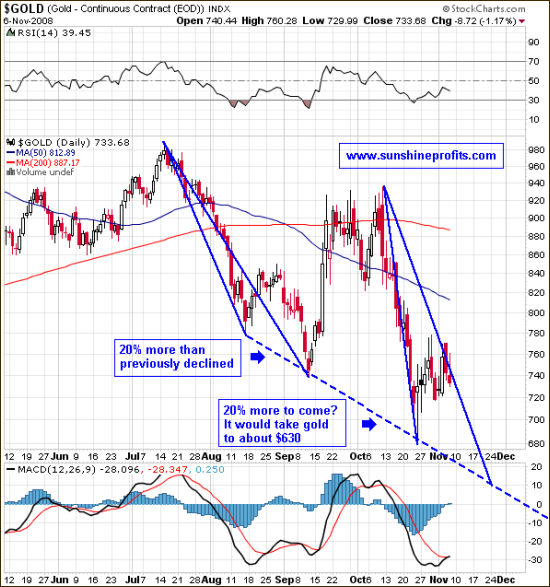
Short-term support level (besides previous low of $680) is at the $630 - $640 level, depending on when gold would get there. There is one more particular pattern that points to the $630 level as a key support here. Markets often repeat certain patterns, sometimes on a bigger or on a smaller scale. This self-similarity effect is referred to as the fractal nature of markets. We have successfully used this technique for gold stocks in the past. In this case gold’s fractal analysis provides us with the $630 target level.
The previous decline took gold about $200 lower and after a rebound it declined $40 more. That is 20%. If this percent was applied to current downleg, then we could see gold at $630, which almost ideally corresponds with the support trend line that I mentioned earlier. Combining these levels with what I inferred from the long-term chart analysis, I believe gold could go as low as the $630 - $640 range. It could close at these levels or go to $630 in the overseas markets for just a few seconds and then bounce with a vengeance.
Summing up, we have USD approaching its important resistance levels and gold near its crucial support lines. At the same time we have the general stock market which has not yet reached its strong support level. What does that mean for gold stocks? That if the bottom is not yet in place, then we are likely in for the ultimate speculative buying opportunity of this bull market.
Of course the market might prove me wrong, as nobody can be right 100% of the time. Should my view on the market situation change substantially, I will send an update to Sunshine Profits' registered Users along with suggestions on how to take advantage of it. Register today to make sure you won’t miss this free, but valuable information. You’ll also gain access to the Tools section. Registration is free and you may unregister anytime.
P. Radomski
Back