
This essay is based on the Premium Update posted on July 18th, 2009. Visit our archives for more gold articles.
One way to make a killing in gold is to forgo blueberry picking. I read an article in this week's New York Times about two Swedish grandmothers who found, what experts say, may be one of the richest gold deposits in Europe. The blueberry crop failed that summer, so instead of looking for blueberries, as they did every summer, these amateur geologists went prospecting around their small village.
They went to a place where trees had recently been felled, exposing rock. Using their hammers, they cleared soil, digging for about six hours until they found a rock with a dull glimmer. Analysis showed that the stone contained more than 23 grams of gold per ton whereas most active mines in Sweden yield less than 5 grams. The grannies were smart enough to obtain the mineral rights for a large area around the find and to negotiate, alone and without lawyers, with about 20 mining companies from Sweden and abroad.
Luck is always welcome, but we won't depend on it. Instead we will rely on good-old technical analysis, along with other important tools, which will give us indications on how to make our money in precious metals.
Let's start this week with the chart for the general stock market using the SPY ETF, as it allows me to analyze volume.
General Stock Market
The reason I sent my Subscribers a Market Alert this week was the action we saw in the main stock market indices. In the alert I cited the invalidation which took place on Monday of the head-and-shoulders pattern. It was further verified on the following days.
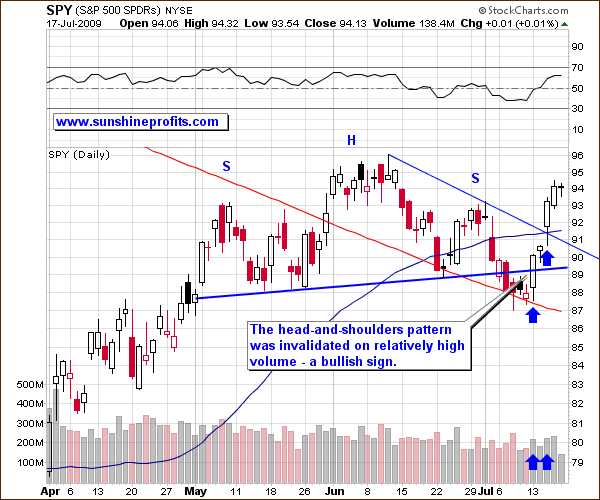
The invalidation I referred to in the latest Market Alert was accomplished after intra-day downwing move that touched the 200-day moving average.
In the previous essay I wrote:
Unless we see a sharp move above this line (89 level) on Monday or Tuesday, the technical picture remains bearish for the general stock market.
In fact, the bounce above the head-and-shoulders neckline on Monday and Tuesday was not only sharp, but also took place on high volume, making it even more significant. It had some momentum traders believing that after four weeks of downside the bulls are back in the market as earnings season begins in earnest.
Moreover, prices moved even higher in the following days, also on relatively high volume. I marked the second breakout on the above chart with the upper blue arrow - price broke above a declining trendline created by using the head and the right shoulder portion of the now invalidated pattern.
On Friday stocks ended little changed but held onto an enormous rally for the week in which the Dow Jones industrials and the Standard & Poor's 500 index posted their best weekly performance since the week ending March 13. All the major stock indexes rose about 7 percent for the week.
Both the breakout and the consecutive daily move took place on significant volume, which suggest that higher prices are possible from here. Had we seen higher prices along with visibly declining volume, we could have inferred that a correction is likely. Volume was very small on Friday, which would normally make a correction likely (thus creating a shorting opportunity), but this time it was not confirmed by analogous values in the indices themselves. Additionally, we see that prices did not increase substantially on Friday, so it is difficult to say that the prices rose on a small volume, as they were barely higher. The underlying index (S&P 500) was down on Friday by only 0.04%, which means that this week's last session was in fact a small consolidation, implying that small volume is a natural phenomenon and does not itself signal lower prices.
The reason why I emphasize the general stock market is that recently this market has shown a high correlation (30-day column) with the precious metals sector.
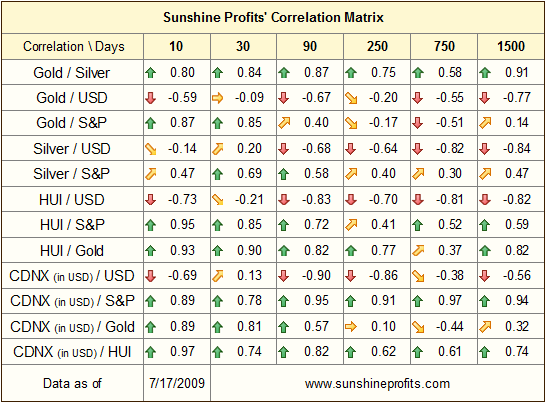
To remind you, green arrows (corresponding to values above 0.5) mean that two particular sectors are correlated significantly in a positive way (the two sectors on average are moving in the same direction). We currently have values for S&P and gold, silver, HUI at 0.85, 0.69, and 0.85 respectively, which means that all of these markets have been trading mostly in tune with the main stock indices.
Gold
Gold's reaction for this week's decline in the USD Index was rather strong.
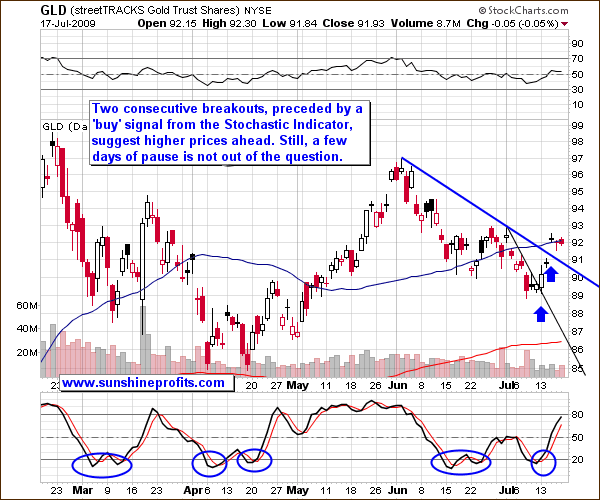
The size of the move is impressive when one compares it to the corresponding move in the USD Index. The values of both-- gold and USD Index-- are at the same levels they were at the beginning of July. However, gold moved from its local lows to these levels in this week alone, while the USD retraced only half of the preceding upswing this week.
This alone signals that the momentum is currently strong and we may expect even more strength in the PM market. This is confirmed by the Stochastic Indicator that you see in the bottom portion of the chart.
The breakout is significant, however the rapidness of the move suggests that at least a small pullback is likely. Therefore, it would not surprise me to see gold test the thick blue line, by moving temporarily to about $90.7 in GLD ETF, which would correspond to about $923 in spot gold.
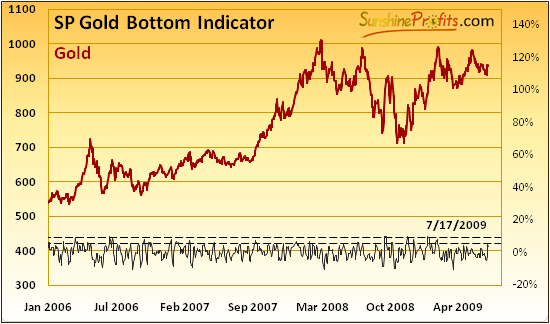
The importance of this week's rally is visible in our SP Gold Bottom Indicator, which rose rapidly and is getting ready to flash a speculative buy signal for gold. The fact that it did not signal a bottom yet should not concern you, as this particular indicator tends to be late in providing signals, but once it does, the following move tends to be substantial.
 (click here to enlarge this image)
The SP Gold Bottom Indicator gives a buy signal when it breaks down lower than the dashed line, and when it breaks up through the upper dashed line. As you may see, in the past few years, most times when the SP Gold Bottom Indicator flashed a buy signal after a consolidation pattern, a sizeable move in gold emerged. Naturally, Subscribers to our Premium Service are able to monitor this, and other unique indicators on a daily basis and thus gain advantage over other market participants. We have just updated the sample version of the charts section, which will currently allow you to see up-to-date version of each indicator! You may access it here.
Summary
Recently the precious metals market has been influenced by developments in the general stock market, which contributed to a considerable extent to its recent downswing and subsequent rally. At the moment, the technical situation for the main stock indices is favorable, which means that precious metals are likely to move higher as well.
The technical situation in the PM sector seems favorable, however, a short-term pause is not out of the question. It's too early to make any specific predictions, but taking into account the fact that we have been consolidating below the $1000 level for over a year now, it seems that this rally could take us above this milestone level. Should the SP Gold Bottom Indicator flash a buy signal, I would consider this as even more likely.
To make sure that you get immediate access to my thoughts on the market, including information not available publicly, I urge you to sign up for my free e-mail list. Sign up today and you'll also get free, 7-day access to the Premium Sections on my website, including valuable tools and charts dedicated to serious PM Investors and Speculators. It's free and you may unsubscribe at any time. Additonally, if you considered subscribing to the Premium Service in the past, but didn’t want to use monthly subscription type, we have good news for you – we have just introduced 90-day and yearly subscriptions which are available at a discount.
P. Radomski
--
This week I focus mainly on the technical analysis of the precious metals and the general stock market as the recently-formed high correlation between the stock market and gold has particularly important implications for the latter.
