
This essay is based on the Market Alert sent on April 1st, 2009
The last few days have been really disappointing for people interested in the precious metals market, especially for long-term gold and silver investors. Fortunately for investors reading my analyses, it didn't come without a warning. In my previous essay I have briefly indicated that
(...) it is not out of the question that PM stocks will correct sharply only to soar in the following weeks, just as it took place in December 2008. However, for now it seems that we are approaching a local top.
Since we cannot go back in time and tell ourselves to take this or that action, we have to focus on what we have today, and what is most important, what can we do about it. Still, I believe that looking at the past is important factor when analyzing today's situation and thus it is helpful in determining what could be waiting for us just around the corner. Therefore, I will start this essay by explaining (from my point of view, naturally) what we have just witnessed on the precious metals market, and then I will proceed with my best-guess scenario for the next few days/weeks.
On Wednesday (April 1st) I sent out a Market Alert in which I wrote:
Today the HUI index and XAU have reached their previous highs after a quick two-day rally. The volume, however, is very low. It is not very common for a breakout to take place after a rally on a tiny volume, and even if we do get past the resistance level, I would consider the following rally doubtful.
We don't need to look far in the past to see examples where similar signals marked the end of a particular rally. Please take a look at the chart below (charts are courtesy of stockcharts.com). We used the GDX ETF as the proxy for the whole PM-stock sector, because it allows us to analyze the volume.
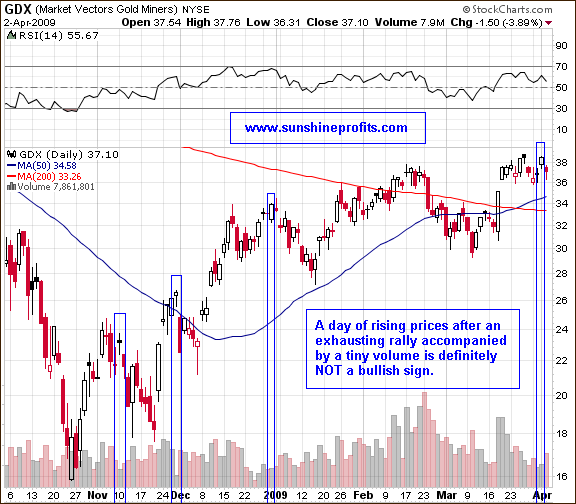
Please note that each time prices rose after a substantial rally, but it happened on a low volume, market was reversing exactly on that day, or it was very close to the reversal day. As I explained in my previous essay:
It means that the buying power is drying up. (...) without fresh capital entering the market, prices cannot rise. When prices cannot rise, they will either trade sideways or slide. Since the size of the rally was impressive, the latter is more probable, as momentum traders realize their gains and make the price more vulnerable to a short-term sell-off. After such an impressive rally many investors wait for any signs of weakness to take profits off the table. If price gets to these important resistance levels and bounces just a little, it may cause these investors to get out of the market, thus intensifying the decline.
That is exactly what we have seen lately, not only in the precious metals market, but also in many leading commodity stocks. Usually, the bigger the gain and the smaller the volume are, the more reliable this signal gets.
Analyzing precious metals stocks can be valuable alone, but it is often best to supplement this analysis with a study of other contributing markets. Obviously the first market that comes to mind is the gold market itself, as it is ultimately the price of the underlying metal that determines mining companies' earnings and thus their share price. Please take a look at the chart below. I used the GLD ETF as a proxy for the price of gold, as it allows me to analyze the volume.
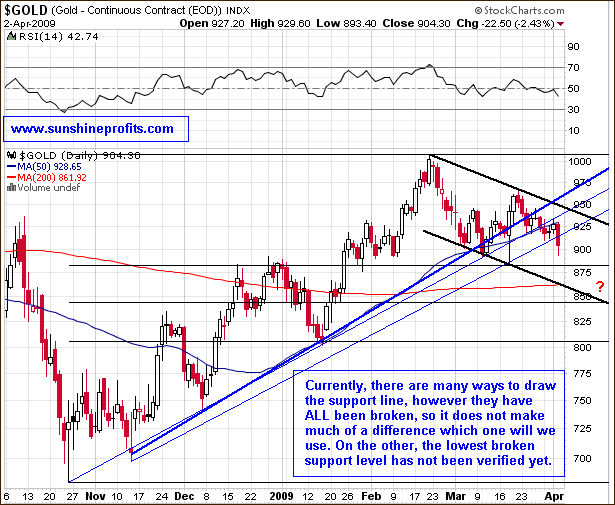
As you may see, the additional factor that I find worth considering here is the fact that gold itself has also broken below the recent trend line on a high volume. This is a "confirmation" signal, meaning that if the same breakdown took place on a small volume, I would not be so convinced that we are indeed going lower. However, I have created that chart on Thursday, after markets closed and much happened since then. We did go lower and the real question is what's going to happen next
At the moment of writing these words, gold has just bounced briefly after dropping below the $870 level. Does it mean that the ultimate bottom for this decline has been put? My answer to this question is "perhaps, but that is not very likely". As I explained in my latest Premium Update, the lower border of the descending trend channel might serve as a solid support that could stop this plunge. Additionally, the $850-$860 range would correspond to the 50% Fibonacci retracement level. Markets often correct half of their gains before resuming their previous trend and we may also see it in the gold market. We are not there yet, so it is difficult to estimate how probable it is that the bottom will be put right there. There are many more factors that we will be able to take into account while, once we get there.
Summing up, gold has broken below its recent trend channel and this breakdown has been confirmed. There are a few factors that point to the $850-$860 range as a solid support level that can stop this decline, however it is too early to make any specific predictions. The answer to the question asked in the title of this essay depends on who you are. Long-term investors should not get too worried, as the overall favorable fundamental situation has not changed. Speculators might want to wait for additional signals before entering new trades in the precious metals market.
Of course the market might prove me wrong, as nobody can be right 100% of the time. To make sure that you know my thoughts (including information not mentioned here) on the market as soon as I post them, I suggest signing up for my free mailing list. Sign up today and you'll also get 24 hours of access to the Premium Sections on my website (including tools and charts dedicated to PM investors and speculators). It's free and you may easily unregister anytime.
P. Radomski
Back