
Based on the July 31st, 2013 Premium Update. Visit our archives for more gold articles.
If you want to be an effective and profitable investor you should look at the situation from different perspectives and make sure that the actions that you are about to take is really justified.
In the precious metals market it turns out very often that if you take a look at the gold’s price chart only, the outlook might be incomplete or even unclear. For this reason, we usually complement the yellow metal’s analysis by the analysis of silver, mining stocks, the general stock market, important ratios and other related markets.
As you know, precious metals usually move together on a short-term basis, even though they may evolve into different formations in the medium- and long term. That’s why we decided to feature the palladium chart today. Does it provide us with interesting clues as to the next possible moves in the entire sector? Let’s take a closer look at the below chart and find out (charts courtesy by http://stockcharts.com).
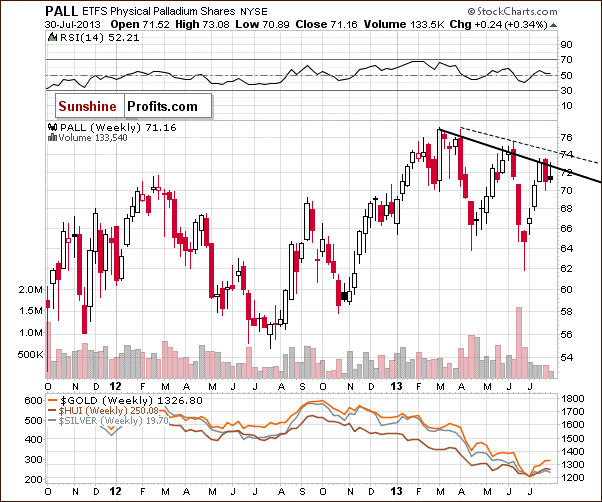
On the above chart we see that in recent weeks, palladium continued its rally and reached the declining resistance line based on the 2013 top and the May peak (in terms of weekly closing prices). This stopped buyers and we saw a decline, which took the price to the 70 level last week. Although we saw a pullback at the beginning of this week, buyers didn’t manage to push the prices above the above-mentioned resistance line. This might result in further declines.
What’s next? In the short term we might see some strength and a small move to the upside, but there is another declining resistance line based on the 2013 top and the May peak (on an intraday basis), which may trigger a correction.
Please note that when we saw a similar price action at the end of March and in late May, gold, silver and mining stocks didn’t move visibly higher. Therefore, even if palladium climbs up once again to the next declining resistance line, it will likely not trigger a significant increase in the rest of the precious metals sector.
But what could happen if the buyers fail? If palladium declines, it seems that it will move the rest of the sector lower.
The shape of this relationship is rather similar to the one between gold and crude oil. So,
let’s move on to the “black gold” chart and check if this commodity is still quite useful in analyzing the precious metals market.
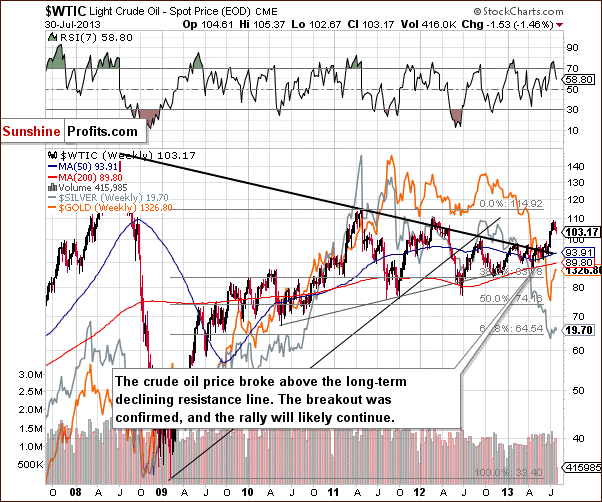
On the above chart we see that the situation has deteriorated slightly. In the recent weeks the situation was overbought on a short-term basis (the RSI indicator was above 70) and that a short-term correction was quite likely. In recent days, the RSI has dropped below 70 and generated a sell signal. This circumstance encouraged the oil bears to go short and triggered a corrective move. Although the price of crude oil still remains above the broken long-term declining resistance line, the recent correction took it below $105 per barrel.
At this point, we would like to draw your attention to the fact that in the past we saw the yellow metal’s price move higher along with the price of crude oil (there are periods when this relationship worked, but it was not always the case).
The current rally in gold took place along with a rally in crude oil. From this point of view, if oil corrects, this could trigger another move lower in gold as well.
Once we know the current situation in the commodities discussed before, and its implications for the precious metals sector, let’s turn to our final chart. Today, we would like to present you the gold chart from the perspective of the Australian dollar once again. In our opinion this is a very interesting chart which may provides important clues as to further gold’s price movements.
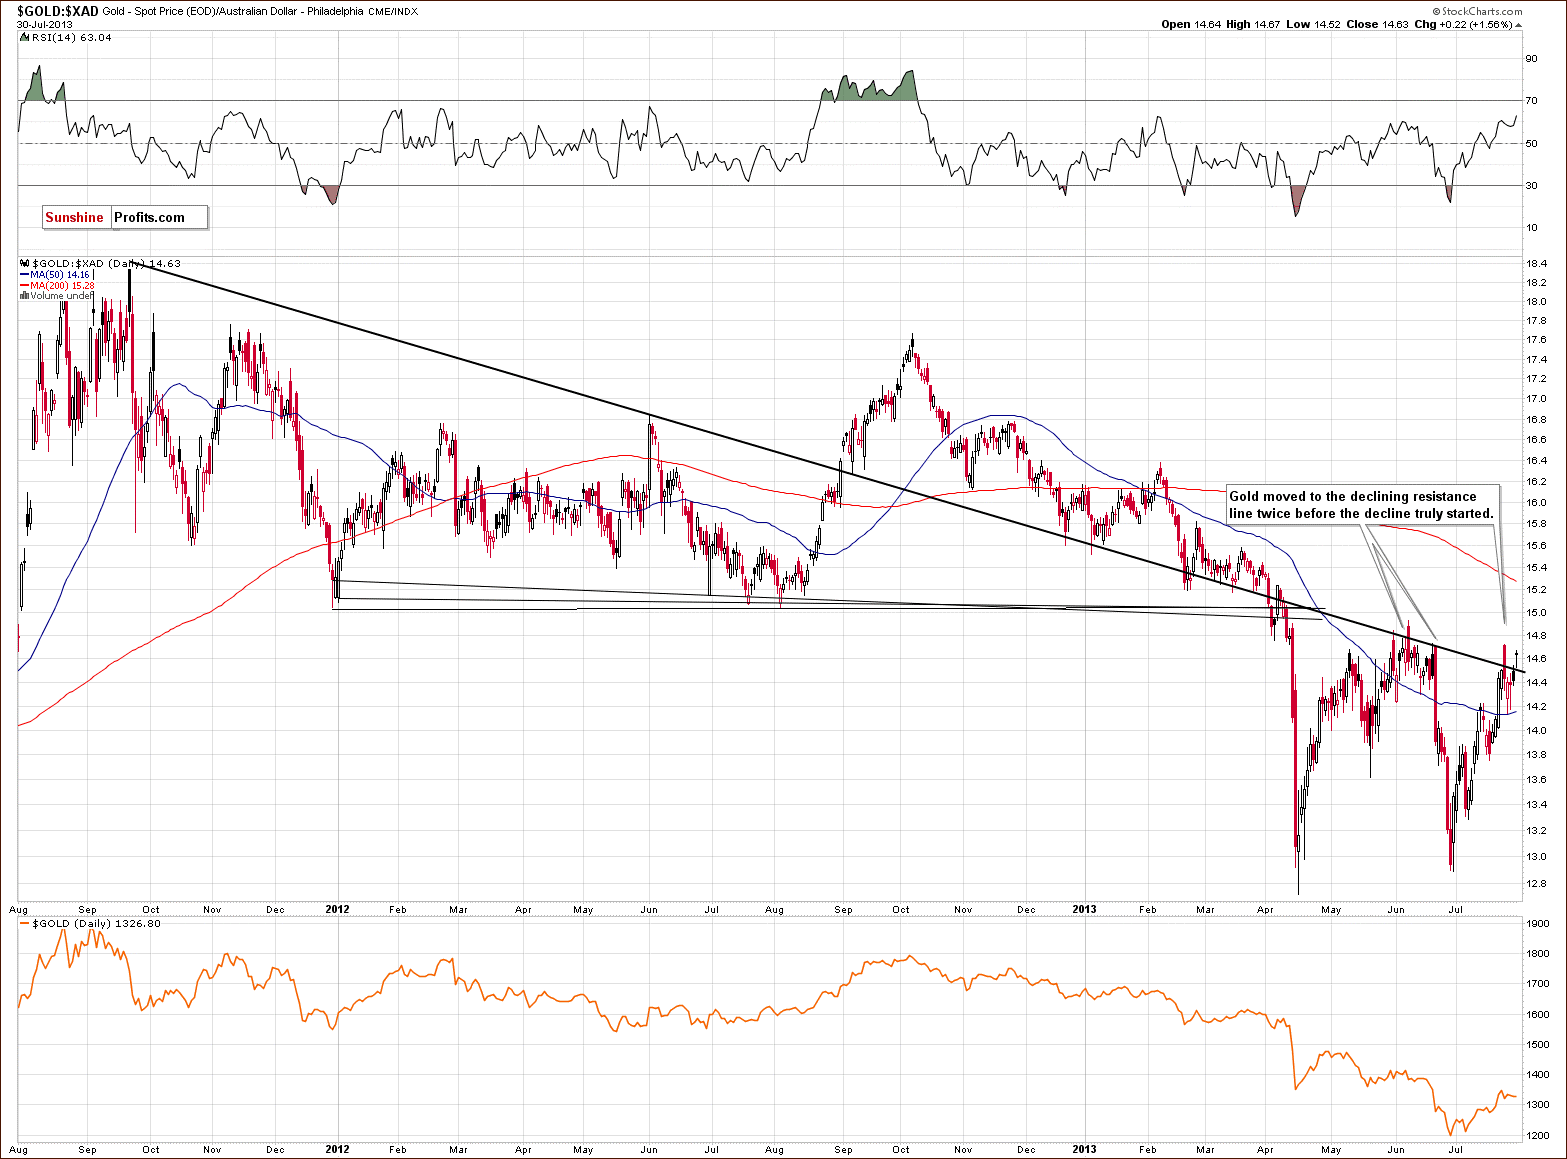
On the above chart, we see that the price of gold in Australian dollars hasn’t changed much. Although gold climbed up above the declining resistance line, the breakout was invalidated very quickly, and the price came back below this declining resistance line (currently close to 14.5).
We saw similar price action in June. After the invalidation of the breakout above the above-mentioned declining support/resistance line, there was a pullback to this resistance line. The buyers, however, didn’t manage to push gold above it. This resulted in strong declines, which took the price all the way back down to the April bottom area.
As we wrote in our essay on gold, silver and mining stocks on July 24:
If we see similar price action here, gold priced in Australian dollars will likely decline once again. Such a triple-bottom, in this case, would likely mean a breakdown below the previous lows in the price of gold seen from our regular USD perspective, a price action similar to what was seen in June.
So, from this point of view, the recent moves up haven’t changed much and the current outlook and the implications remain bearish.
Summing up, both palladium and crude oil are in medium-term uptrends whereas gold, silver and mining stocks remain in a downtrend. The implications of the palladium chart for the whole precious metals sector are rather bearish for the short term, as the chart indicates that the current move to the upside is over or might be over soon. The short term picture for crude oil is also bearish which may translate into lower precious metals prices in the near future.
What's next? Quite likely, lower prices. How low can gold, silver and mining stocks go? What to do about it? What trades to enter? What stop-loss orders should one use? We reply to such questions on a daily basis in our Market Alerts and Premium Updates. Would you like to stay updated too? Sign up and start receiving our Alerts & Updates. We have already posted today's Premium Update and it will likely be quite useful for you.
Thank you for reading. Have a great weekend and profitable week!
Sincerely,
Przemyslaw Radomski, CFA
