
Understanding the relationship between the U.S. dollar and gold is necessary to successfully invest in gold. However, it is not sufficient, because changes in the USD exchange rates cannot be analyzed outside the economic context: gold, although not officially money, is traded like a currency. Therefore, long-term investors should not analyze the gold market in isolation or confine themselves to observe the U.S. dollar index. The price of gold reflects the complex financial world and hence depends on many factors: the movements of interest rates, inflation or economic growth. The U.S. dollar may rise due to many factors, each time affecting the price of gold in a slightly different way. In other words, if the USD and gold prices have an inverse relationship, then forecasts for gold prices should be prepared while taking into account the expectations of currency movement. To do this, we need to understand the factors driving the greenback.
The financial press presents many explanations for U.S. dollar movements. Some analysts argue that changes in the balance of trade are responsible for strengths or weaknesses of the currency. However, balance of payments is only an accounting difference between the monetary value of what was sold versus the monetary value of what was bought, and thus cannot alter the external purchasing power of money. Other economists say that exchange rates depend upon economic health. However, the causality runs in the opposite direction. The strong currency is the condition of economic growth. Just consider the long-term relative position of the U.S. dollar. Generally, the greenback has been losing value compared to other major currencies (Japanese yen, Swiss franc and German mark or Euro now) since the 1970s, i.e. breaking the link with gold. However, two important exceptions occurred in the first half of 1980s and in the second half of 1990s.
Why was the U.S. index gaining then? The reason lies on the monetary side. Both periods were times of tight monetary policy. It should not be a surprise because economic theory says that the exchange rate between any two monies will tend to be at the level of purchasing power parity. And money supply growth is the main driver of purchasing power. Let us analyze an example. If a given basket of goods is exchanged in the U.S. for one dollar and the same basket of goods is exchanged for two euros in Europe, the rate of exchange between the U.S. dollar and the euro will be set as one dollar for two euros. However, if the money supply increases in the USA and as a result two dollars are now exchanged for the same basket of goods, the rate of exchange between the U.S. dollar and the euro will be set as one dollar for one euro.
Having this in mind, what can we tell about the recent greenback increase? After two years of sideways movement, the U.S. dollar index blasted in July, increasing from 103.74 to 106.27 at the end of September. What caused such a huge hike (sharp moves in major currencies are rather uncommon)? Stock market declines and thus dollar safe-haven buying might have some effect but it seems that the main reasons were ECB cutting interest rates and expectations that the Fed will start to hike rates sooner rather than later due to positive signals from the economy. By the way, this is why some analysts connect economic growth with the rise of U.S. dollar. More hawkish monetary policy is simply more probable during prosperity than depression.
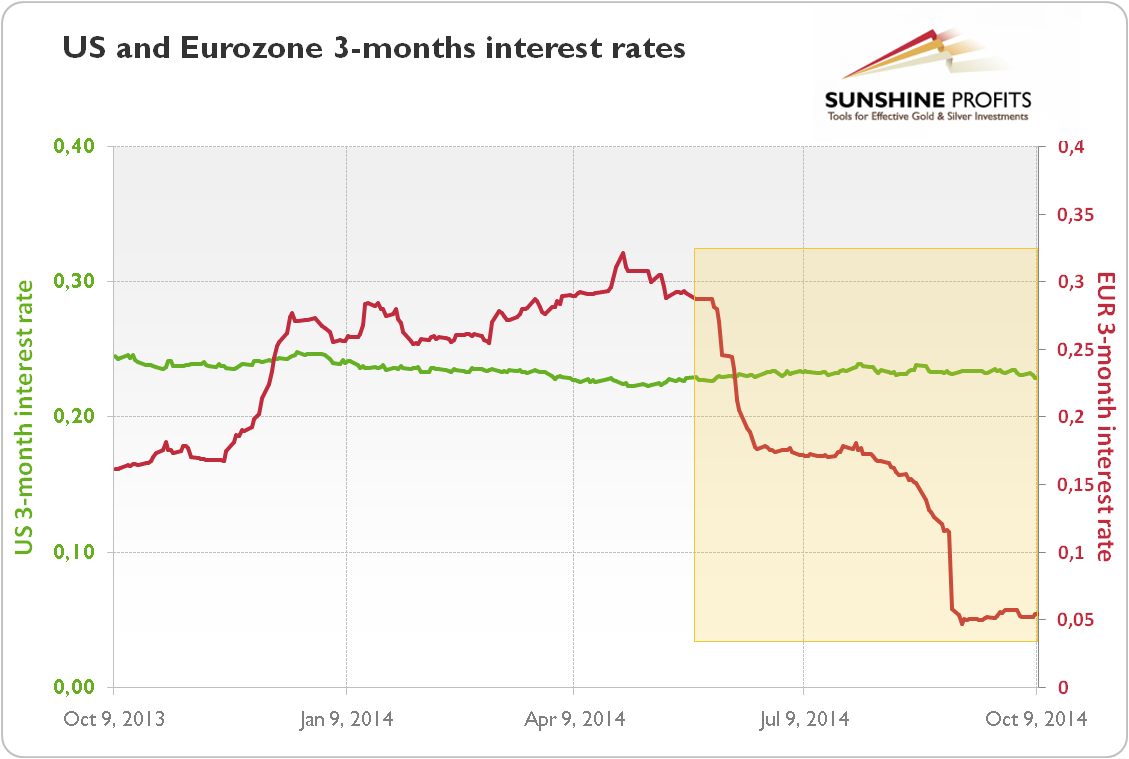
And what are the prospects of U.S. dollar index, and thus gold price, for the future? Undoubtedly, a part of the increased demand for greenback was caused by fundamental factors, like the rise of the difference between Euro area and U.S. short-term interest rates, but much of the bullish activity relied on the expectation that Fed will start hiking rates soon.
Graph 1: US (green line) and Eurozone (red line) 3-months interest rates from 2013 to 2014
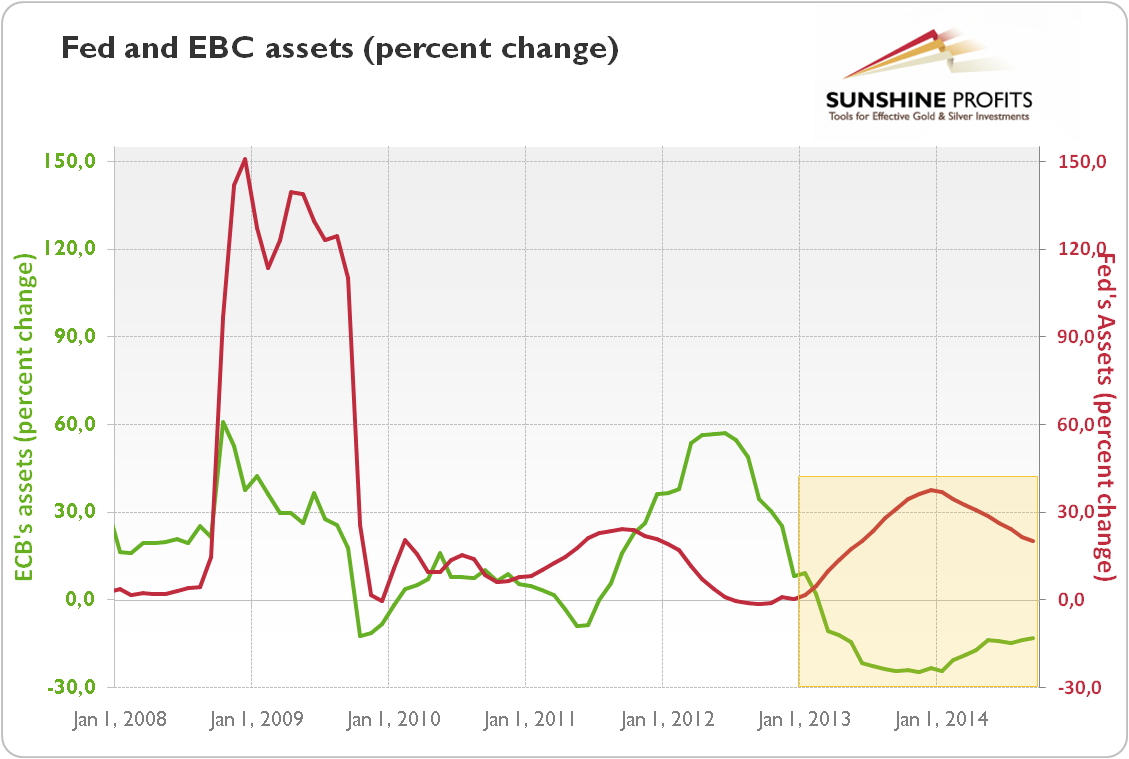
However, this scenario was questioned by the last Fed’s minutes which turned out be less hawkish than anticipated, as there was concern about weaker foreign economic growth and the potential impact of an appreciating dollar on U.S. exports. In consequence, the greenback was declining during most of October. Therefore, it seems that the rise in September was a rather more temporary change than the beginning of a bull market. However, the future path of U.S. dollar, and gold, will depend on the main central bank’s monetary policy. We have to remember that the U.S. dollar index is a relative issue. It is true that Fed is pumping a huge amount of new money into economy, driving down the purchasing power of the dollar, but other central banks are doing exactly the same, or even in a more disastrous way (look at Abenomics in Japan). This is why the U.S. dollar is still one of the best currency choices. On the other hand, the Fed is increasing its balance sheet at a faster pace than ECB (whose balance sheet is actually declining) since 2013, and the M1 money supply growth is also greater in the USA than in the Euro zone.
Graph 2: Fed (red line) and EBC (green line) assets percent change from 2008 to 2014
Therefore, it seems that unless the Fed raises the interest rates definitely, instead of testing the market or introducing only cosmetic changes, the position of gold in the long run is not at risk.
We focus on the macroeconomics and fundamental side in our monthly Market Overview reports; however we provide also Gold & Silver Trading Alerts for traders interested more in the short-term prospects. Join our gold newsletter. It’s free and you can unsubscribe in just a few clicks.
Thank you.
Arkadiusz Sieron
Sunshine Profits‘ Market Overview Editor
