
Based on the November 20th, 2013 Premium Update.
Looking at the chart of silver from today’s point of view, we see that at the end of the previous week, the white metal (similarly to gold) moved higher after Federal Reserve Chair Nominee Janet Yellen told that monetary stimulus tools shouldn't be removed too soon. If you recall, several days ago we wrote that gold could move higher but that that would just be a counter trend move and would likely be followed by further declines. On Monday, two top Fed officials from opposite sides of the policy spectrum, fueled expectations that the Federal Reserve could taper its bond buying program. Their comments pushed the price of silver to slightly above $20. Although yesterday Bernanke said that the Fed will maintain ultra-easy monetary policy for as long as needed, silver extended declines for a second session and hit a fresh three-month low. This, by itself, is a sign of weakness.
Please note that the price of the white metal is down approximately 33% this year, to some extent on concerns the Fed would begin cutting back its easy-money policy by trimming its $85-billion monthly bond purchasing program. To some extent, because the reasons didn’t have to be fundamental, they could have been emotional/technical (silver got ahead of itself and needed to correct before rallying once again). In other words, there could have been a catalyst that has been undetectable using traditional fundamental analysis, which is why even long-term investors shouldn’t forget to monitor the charts (or get in touch with someone who does).
Taking the above into account, today investors are turning their attention to the minutes of the Fed’s October meeting, as well as a speech by Chairman Ben Bernanke and probably wondering what’s next. What impact could the Fed minutes have on the price of silver? Let’s see what the market thinks.
In today’s commentary, we examine long- and short-term charts of silver to find out what the current outlook for the white metal is. We will start with the analysis of silver from the long-term perspective (charts courtesy by http://stockcharts.com).
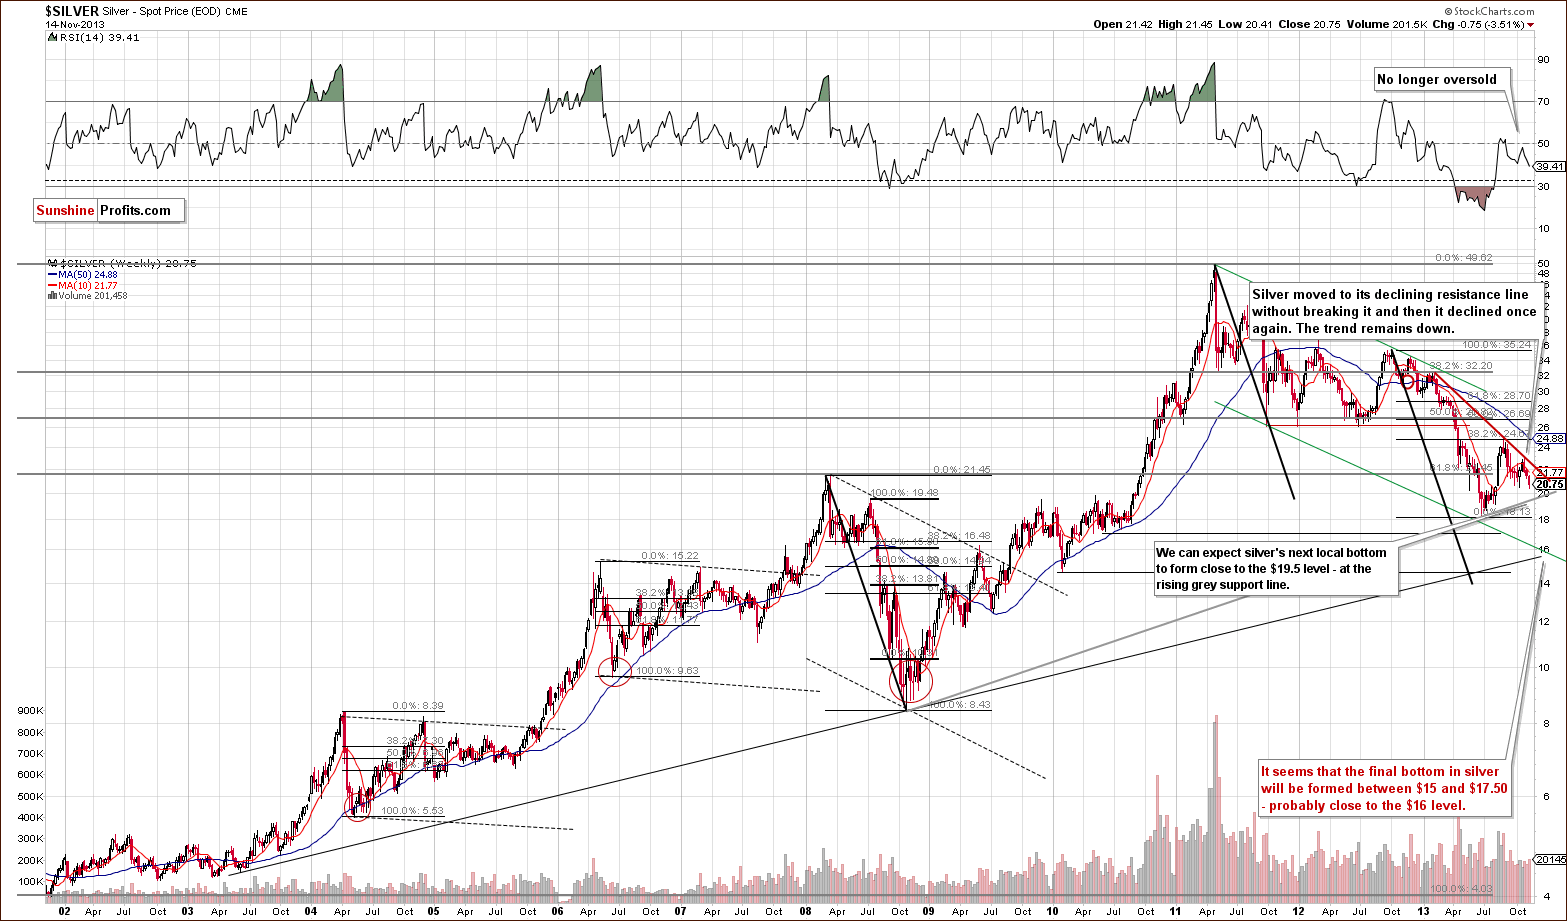
At the beginning of the previous week, silver dropped below the previous October lows (even taking intra-day lows into account). Moreover, the white metal not only confirmed the breakdown below the rising support line, it also moved below the 61.8% Fibonacci retracement level based on the June-August rally ($20.80). This means that the upward correction might already be over.
On Friday, the breakdown below the 61.8% Fibonacci retracement level was confirmed as silver closed below this level for the third consecutive trading day. This made the situation more bearish.
Please note that the RSI indicator is not oversold at this time, so we might see significant declines in the coming weeks (it’s not that RSI is suggesting that at this time, but it doesn’t “say” that it’s unlikely).
Finally, the support line based on the 2008 and 2013 lows creates an initial downside target – something that silver is likely to reach (and pause / bounce) before moving to our final target level around the $16 level. At this time, this initial target is very close to $19.50.
This week, we didn’t see any improvement. Instead, silver declined once again, confirming the bearish outlook.
Let’s move to the short-term chart to see the very recent price moves more clearly.
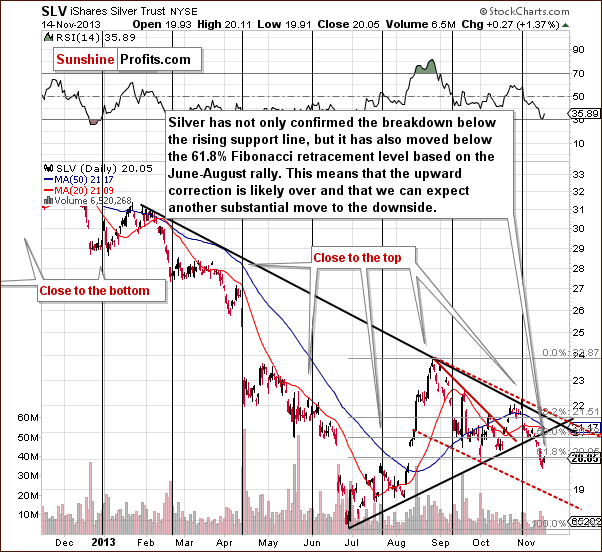
On the above chart, you can see the breakdown below the 61.8% retracement more clearly.
There are also other interesting things visible on this chart. We can see that the recent decline in the SLV ETF materialized on significant volume, which suggests that it was no accident. Interestingly, we saw something similar (a visible but not huge plunge) in early June, which preceded the real downswing and investors had several days to prepare.
The second interesting thing that we can see above is the downside target for the SLV ETF, very close to the $19 level. The target is created by the red dashed line, which is a parallel line to the declining resistance line based on the most recent local tops. It is more or less in tune with the initial target for spot silver at $19.50.
Summing up, taking into account the above analysis, we can conclude that the outlook for silver remains bearish and further declines should not surprise us. We would like to stress that our price target levels are something that we view as very likely (meaning that they are very likely to at least stop the decline for a while when they are reached) at the moment of posting this essay, but given this month’s volatility, it could be the case that these targets will be adjusted shortly.
In order to stay updated on a continuous basis (via Premium Updates and Market Alerts + intra-day alerts whenever necessary), please subscribe to our Premium Service.
Thank you.
Przemyslaw Radomski, CFA
Back