
This essay is based on the Premium Update posted on December 17th, 2010. Visit our archives for more gold articles.
Gold has gained 26% this year, putting it on track for its third double-digit gain of the last four years. To chart golds price movements since 2000 take a piece of paper and draw an outline of an imaginary mountain slope (think Everest) with a few footholds to rest on the steep way up. There is still a long way up before you can plant the flag at the top.
Euro-zone concerns dominated the gold trade in the first half of the year. For the astonishing second half, dollar weakness was the major story with the yellow metal reaching more than a dozen record highs. It got a boost in late August after Federal Reserve Chairman Ben Bernanke proposed expanding the Fed's bond-buying efforts with a second round of quantitative easing. For the most part, only modest retracements punctuated the winning streaks.
Lets take a look at the fundamentals that have been driving the prices of precious metals higher this past year as well as some of the pitfalls that may lie ahead. All the factors that have driven gold higher fear, uncertainties, the Feds printing press, lack of confidence in the dollar, gold as the ultimate currency, buying by newly wealthy Chinese families, sovereign troubles in the euro zone, central bank purchases, high unemployment in the U.S. are still in place and we dont see any of those factors changing significantly in the coming year.
Several analysts and gold pundits support a continuing bullish time for gold in 2011. Several forecasts predict gold has $100 to $400 more to gain this coming year. The timing of the peak may depend on interest rates. Analysts at Goldman Sachs say gold prices are likely to continue their upward trajectory next year, but likely peak in 2012 on rising interest rates at $1,750 an ounce in 2012. Peter Schiff is on the record as predicting that gold will go up to $2,000. Jim Rogers said in an interview recently gold is going to go a lot higher over the next decade. If adjust for inflation it should be over $2000.
There have also been predictions about golds crazy little brother, silver, the leading performer in the metals this year. Will it repeat its success in 2011? Standard Bank Plc said that they see silver at over $40/oz due to new applications and increased industrial demand.
As far as we're concerned, we would guesstimate gold's high for 2011 at $1,800 and $45 silver. Our very-long-term charts suggest even higher targets for the following rallies, but since it is 2011 that we are talking about in this guesstimate, we will stick with the abovementioned levels.
So what are the pitfalls for precious metals? The first is that the economy will heal (which may not be a bearish factor at all in case of silver because of the number of its industrial applications), the Fed will stop printing money, the euro will stabilize and the Chinese will stop buying gold. The chances of that happening are nil. Instead that we see in our crystal ball are bankruptcies looming at the state, county and municipal level throughout the U.S.
The U.S. Federal Reserve is forced to buy T-bills from the Treasury department just so the government can continue to stay operational. Or, what is even more likely that the bankruptcies will be prevented by printing more money, thus fueling inflation and precious metals' rally.
A more realistic drag on gold could be the possibility of surging interest rates in Europe and the U.S. Higher interest rates would push investors away from gold, which bears no interest, pays no dividends and thus carries an opportunity cost. However, higher long-term yields reflect rising inflation expectations and diminishing confidence in the U.S. dollar and those are bullish for gold.
Speaking of the economy, let's take a look at the indications coming from Euro and USD Indices. Let's begin with the Euro Index chart (charts courtesy of http://stockcharts.com).
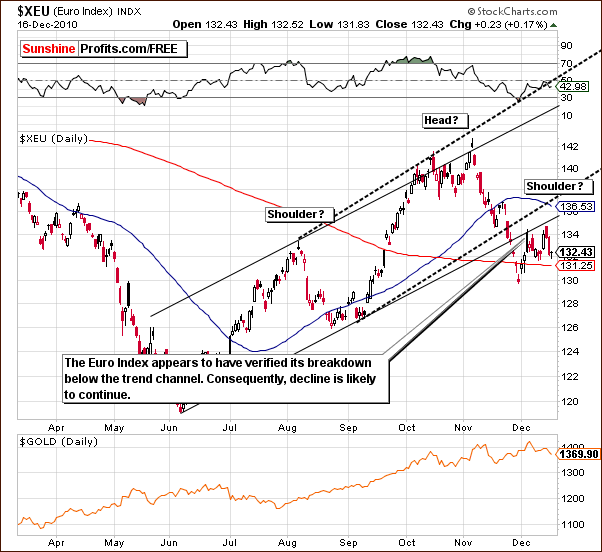
On the above chart we clearly see that the resistance levels continue to be retested. Note that a previous support level is now providing resistance and has held for a second time. At this point, further declines could very well continue here and this would likely lead to a corresponding rally in the USD Index.
The head-and-shoulders pattern, which was appeared to be under development in recent weeks, may not be completed given the abovementioned action or it may not be completed in a classic manner meaning that price would simply trade sideways below the rising resistance line re-testing it over and over again after finally declining. Either way, further consolidation is possible but it seems more likely that declines will be seen with an eventual break below the 200-day moving average support level.
Again, since the euro is the biggest factor determining the USD Index, what's bearish for Euro is bullish for the USD Index.
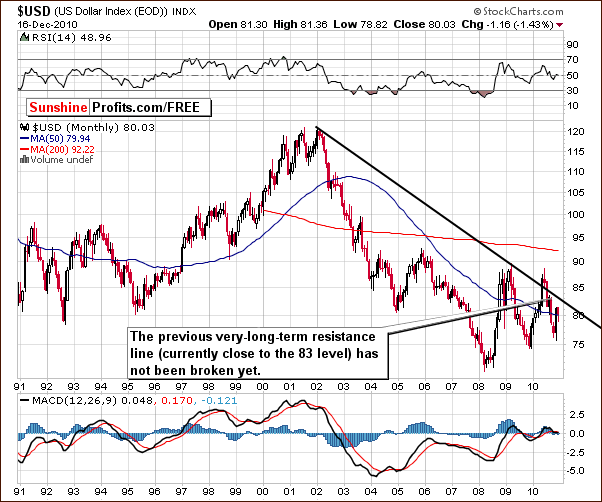
The very long-term USD Index chart, which spans nearly 20 years allows us to truly put 2010 in perspective. When viewing a short-term chart, the USD Index appears to have rallied to a much greater extent than is seen when compared to prior years. Simply put, the very long-term declining resistance line has not been surpassed in the past 12-months and is still likely to provide strong resistance once it is approached.
What this means is that any rally ahead in the USD Index may not surpass the 83 level, which is where this resistance line currently resides. This is a very probable upper limit for the foreseeable future and is therefore a significant bit of valuable information.
Summing up, if the USD Index continues to rally, it likely to be stopped somewhere around the 83 level. Gold, silver and mining stocks, which are priced in US Dollars, move in the opposite direction of the USD Index - unless we see a strong demand from the non-USD Investors. Although the dollar can rally alone, if non-USD demand remains strong, precious metals prices could hold or even increase.
To make sure that you are notified once the new features are implemented, and get immediate access to my free thoughts on the market, including information not available publicly, I urge you to sign up for my free e-mail list. Sign up today and you'll also get free, 7-day access to the Premium Sections on my website, including valuable tools and charts dedicated to serious PM Investors and Speculators. It's free and you may unsubscribe at any time.
Thank you for reading. Have a great weekend and profitable week!
P. Radomski
--
It takes some courage to go out on a limb and predict precious metal prices for 2011. This week we look at some of the predictions by brave analysts, examine some of the pitfalls that could await gold and its crazy little brother silver in the upcoming year, and make some predictions of our own.
Meanwhile, the short-term situation is still tense, and we feature many charts this week, in order to put it into proper perspective. We have analyzed the Euro and USD Indices (including the 20-year chart, which provides information relevant at this point), general stock market (whose rally did not correspond to analogous action in the metals), gold and silver (possible downside targets), and mining stocks (from both: short- and long-term perspective). We also comment on the recent changes in the correlation matrix and on yesterday's signal coming from one of our unique indicators.
Additionally, we explain the similarity between 2008 and today in silver (is this a double top?), PHPP precious metals fund, and junior's policy regarding pink sheets "listing".
We encourage you to Subscribe to the Premium Service today and read the full version of this week's analysis right away.
