

Forex Trading Alert originally sent to subscribers on March 12, 2015, 11:54 AM.
Earlier today, the Commerce Department showed that retail sales fell 0.6% in the previous month, which was the third consecutive monthly decline. Additionally, core retail sales (without automobiles, gasoline and food) were flat following a 0.1% decline in January. Thanks to these disappointing numbers the USD Index declined from a fresh 2015 high, slipping under the barrier of 100. How did this drop affect the euro?
In our opinion the following forex trading positions are justified - summary:
- EUR/USD: none
- GBP/USD: none
- USD/JPY: none
- USD/CAD: short (stop loss order at 1.2876)
- USD/CHF: none
- AUD/USD: none
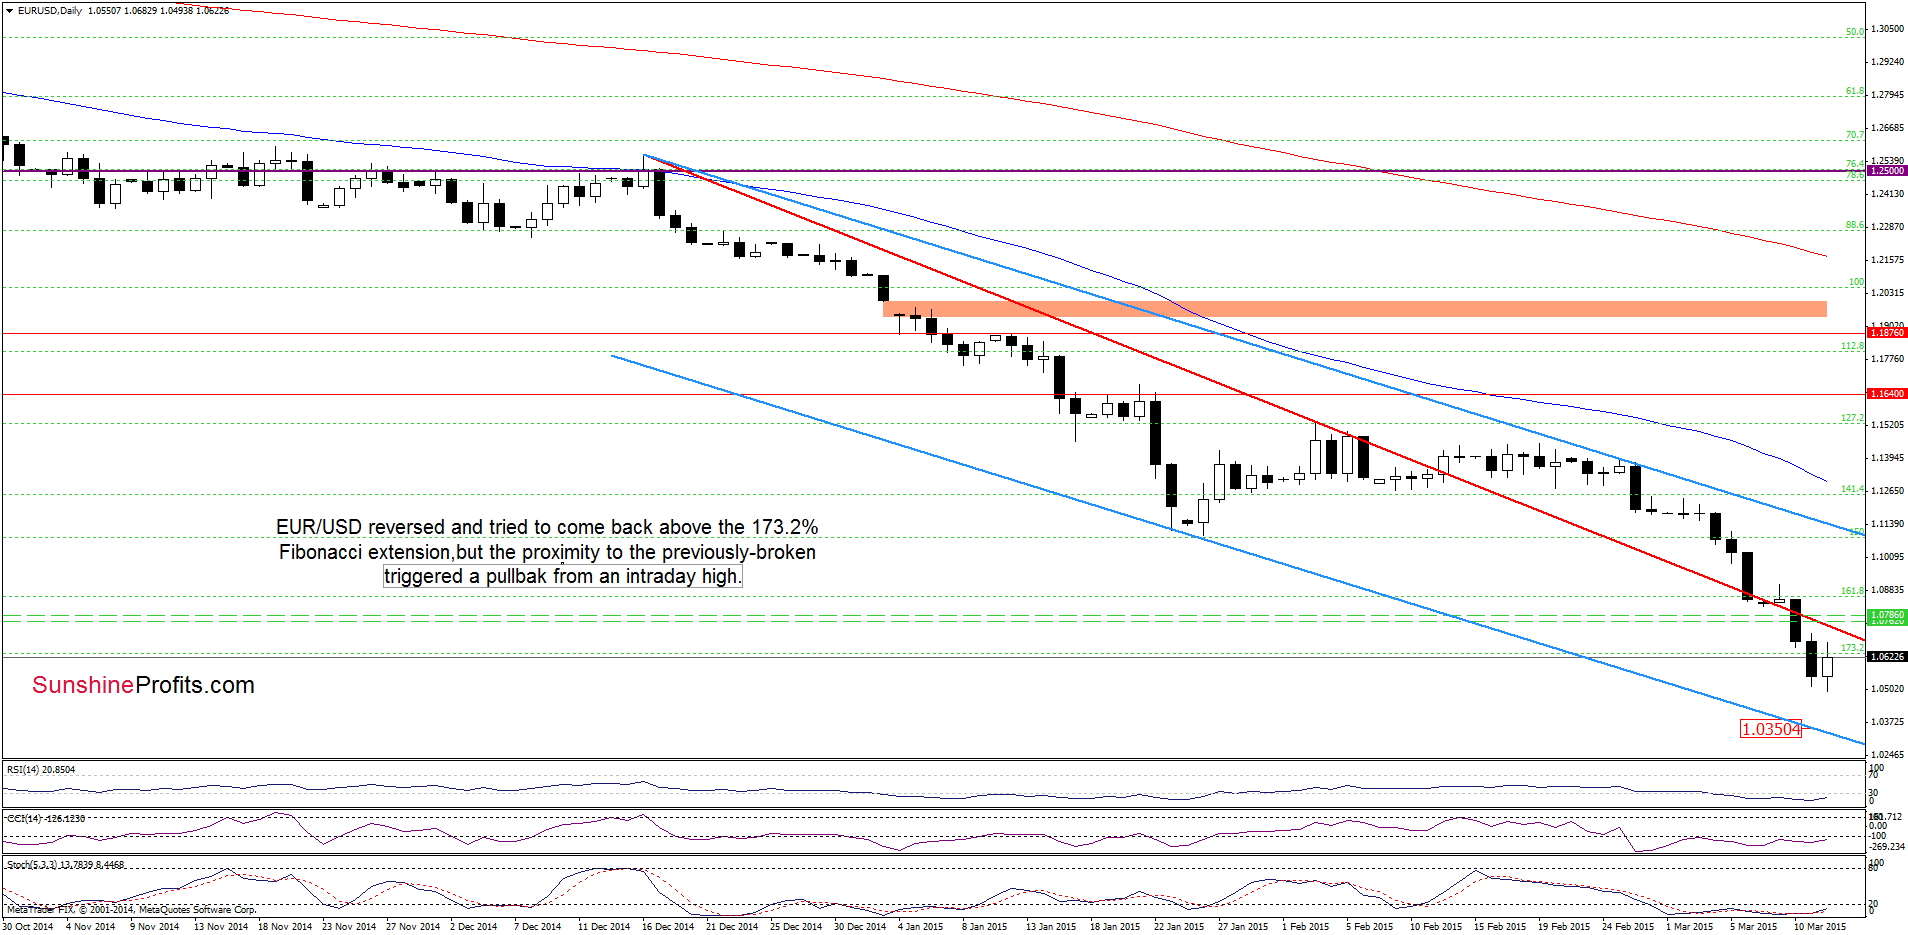
EUR/USD
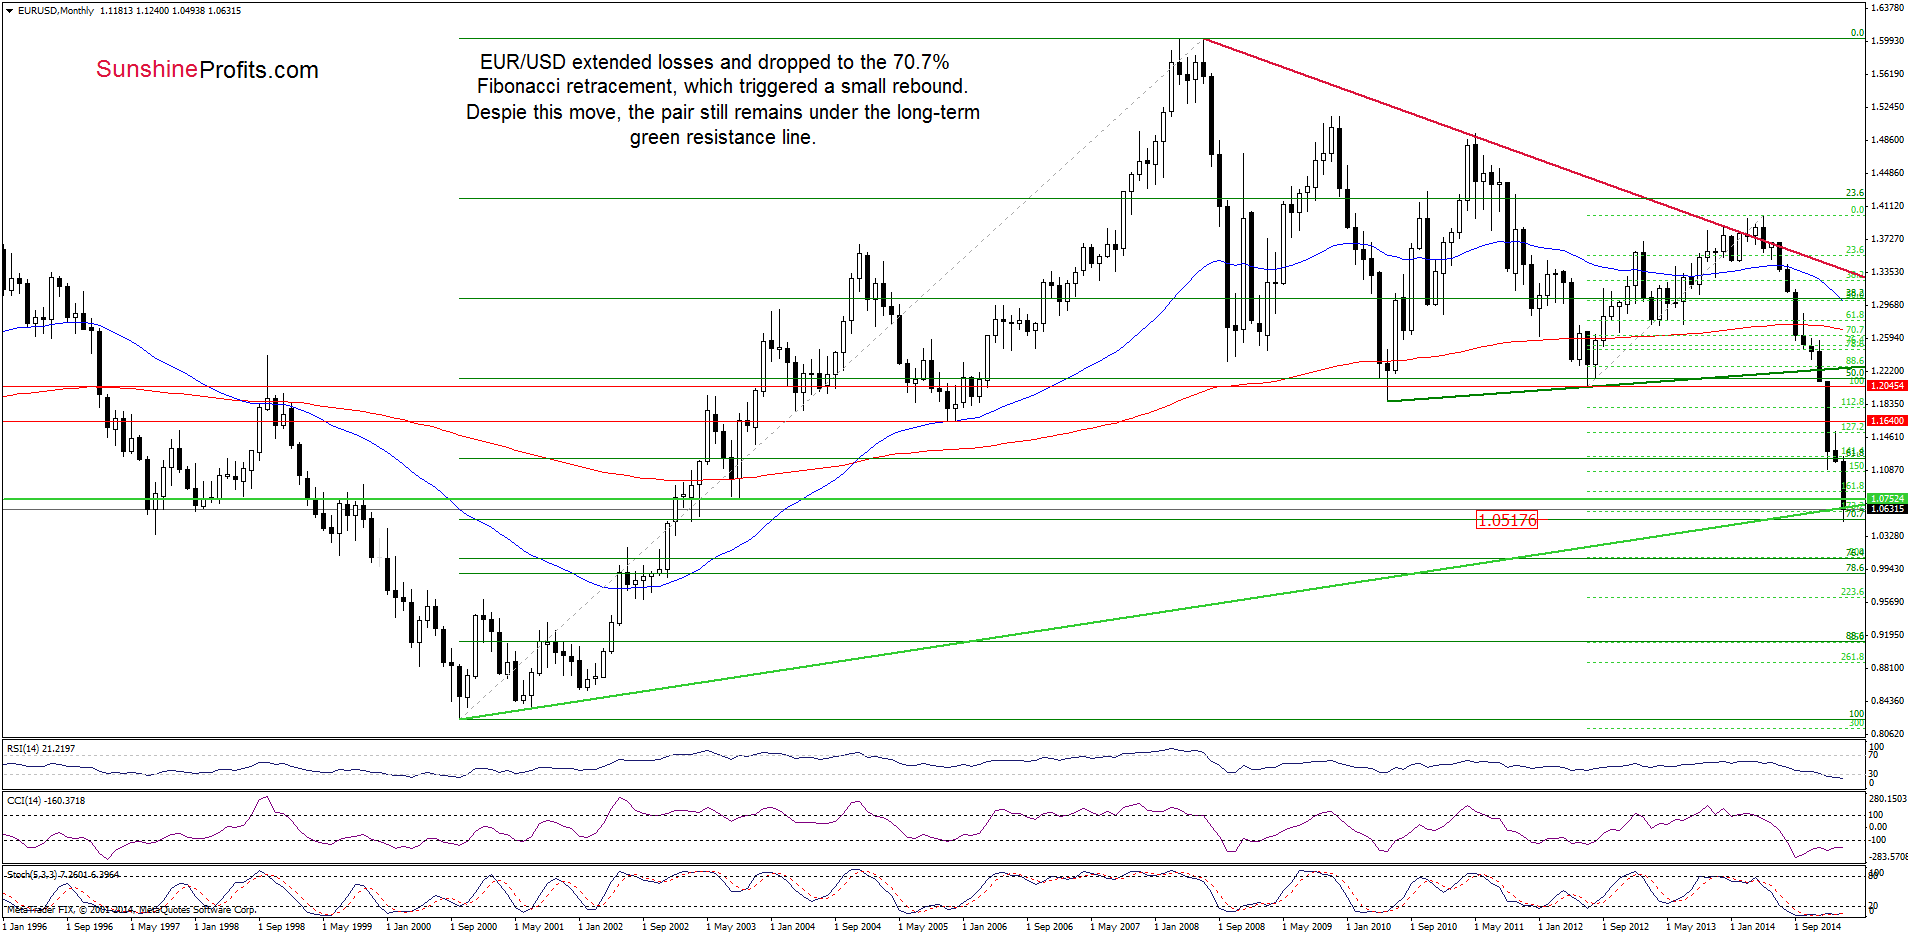
Quoting our previous Forex Trading Alert:
(…) EUR/USD (…) slipped under the long-term green support line (based on the Oct 2000 and Jul 2001 lows). This is a solid negative signal, which suggests further deterioration in the coming day(s). How low could the exchange rate go? (…) the next target for currency bears will be around 1.0517, where the 70.7% Fibonacci retracement is.
Looking at the charts, we see that the situation developed in tune with the above-mentioned scenario and EUR/USD dropped to our downside target earlier today. Despite this deterioration, the exchange rate reversed and rebounded slightly in the following hours, which resulted in an invalidation of the breakdown under the 70.7% Fibonacci retracement. Although this is a positive signal, we should keep in mind that the exchange rate still remains under the previously-broken long-term green and medium-term red resistance lines. In our opinion, as long as there is no comeback above these lines further improvement is questionable and another downswing (and a test of yesterday low) should not surprise us.
Very short-term outlook: mixed
Short-term outlook: mixed
MT outlook: mixed
LT outlook: mixed
Trading position (short-term; our opinion): No positions are justified from the risk/reward perspective at the moment. We will keep you informed should anything change, or should we see a confirmation/invalidation of the above.
USD/CHF
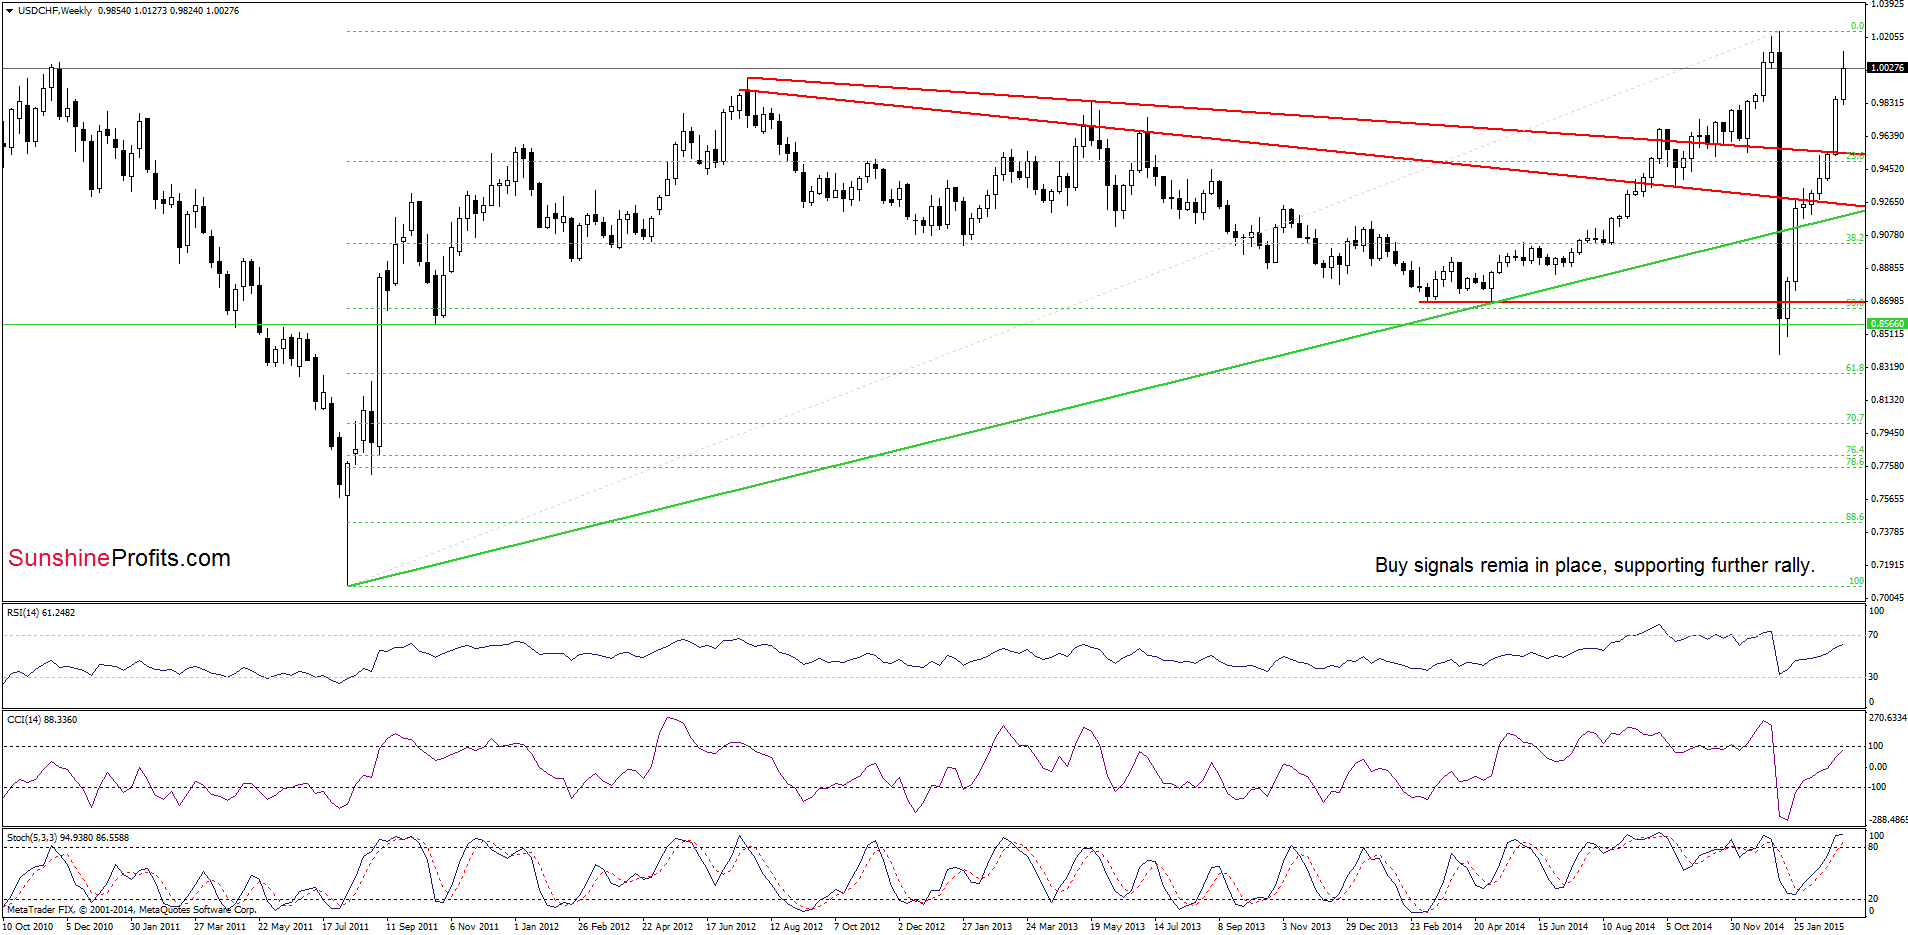
The medium-term picture remains bullish as USD/CHF extended gains and buy signals generated by the indicators are still in play, supporting further improvement.
How did this rally affect the daily chat? Let’s find out.
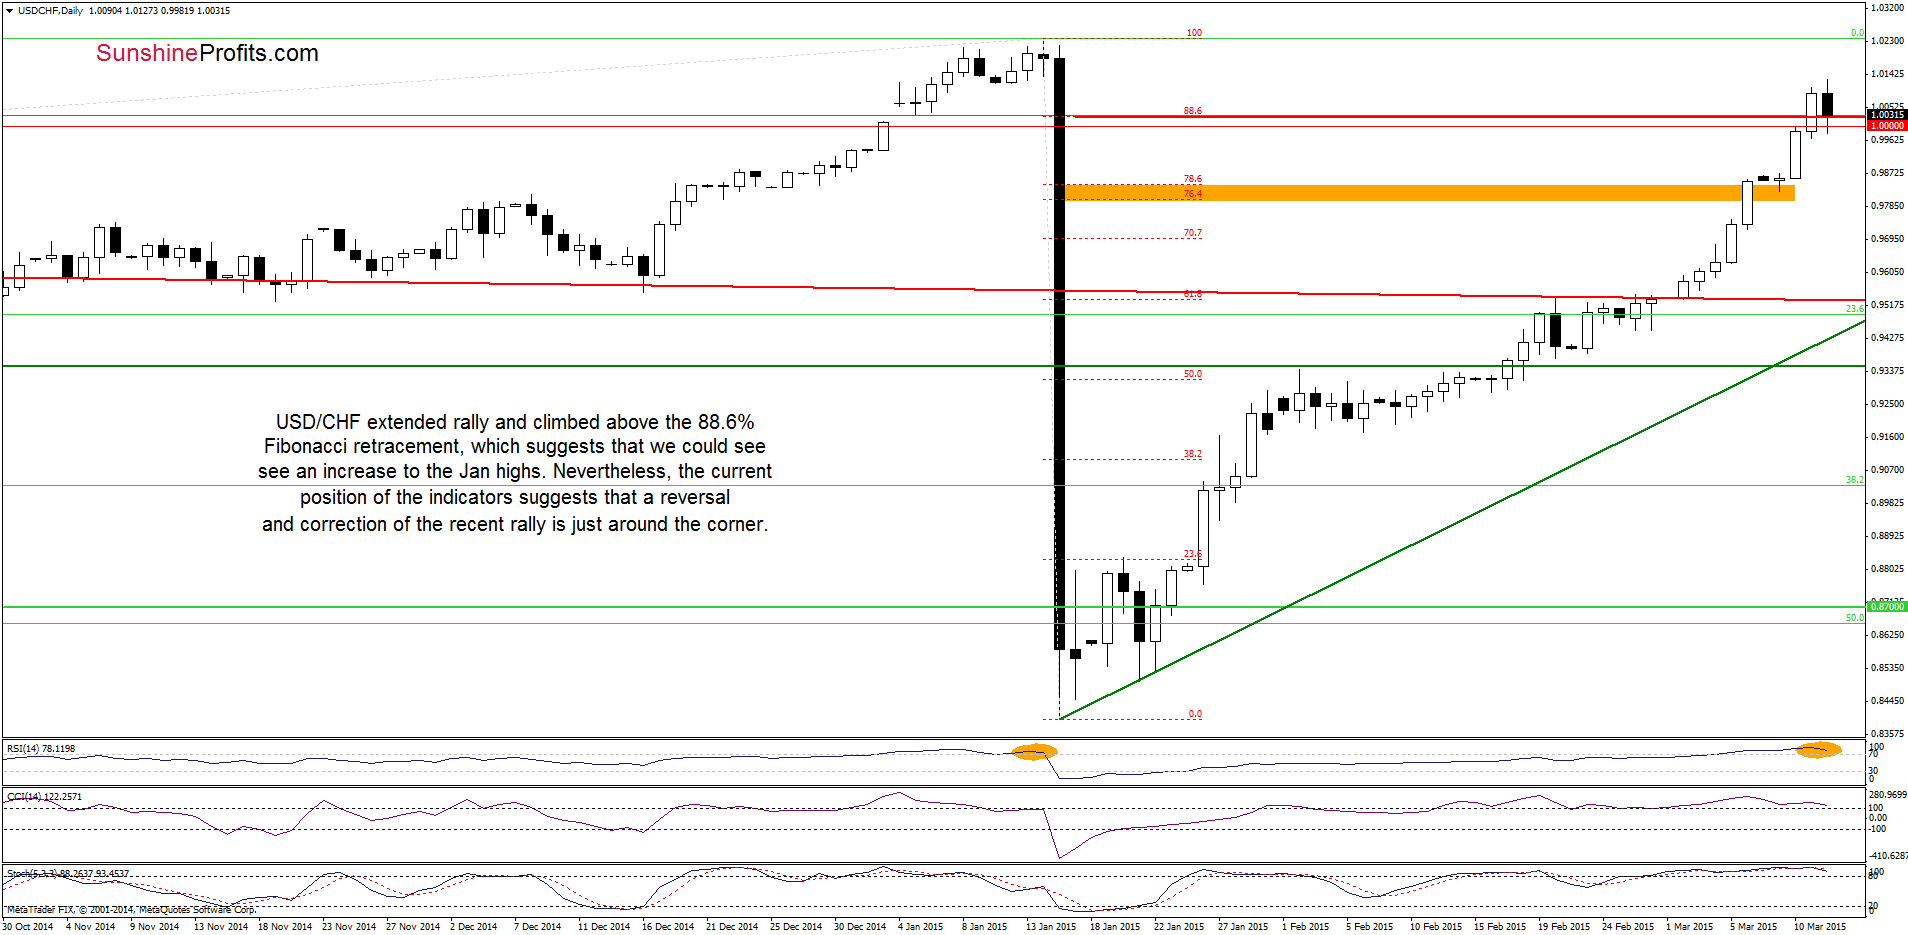
On Tuesday, we wrote the following:
(…) currency bulls (…) managed to break above the orange resistance zone, which is a positive signal that suggests further improvement and a test of the psychologically important barrier of 1.0000. If this resistance level is broken, the next target would be around 1.0024, where the 88.6% Fibonacci retracement level is.
As you see on the daily chart, USD/CHF moved higher as we expected. With this upswing, the exchange rate broke above our upside targets, hitting an intraday high of 1.0127 earlier today. This is a positive signal, which suggests further improvement and an increase to around the Jan highs. Nevertheless, when we take a closer look at the current position of the indicators, we see that the RSI remains above the level of 70, which is a negative sign. The reason? As you see on the daily chart, in Jan such high reading of the indicator preceded one of the sharpest declines in forex market. Taking this fact into account, and combining it with a sell signal generated by the Stochastic Oscillator (the CCI is very close to doing the same), it seems that a reversal and correction of the recent rally is just around the corner.
Very short-term outlook: mixed
Short-term outlook: mixed
MT outlook: mixed
LT outlook: bearish
Trading position (short-term; our opinion): No positions are justified from the risk/reward perspective at the moment. We will keep you informed should anything change, or should we see a confirmation/invalidation of the above.
AUD/USD
The situation in the medium term hasn’t changed much as AUD/USD is trading around the Jul 2009 lows once again. Today, we’ll focus on the very short-term changes.
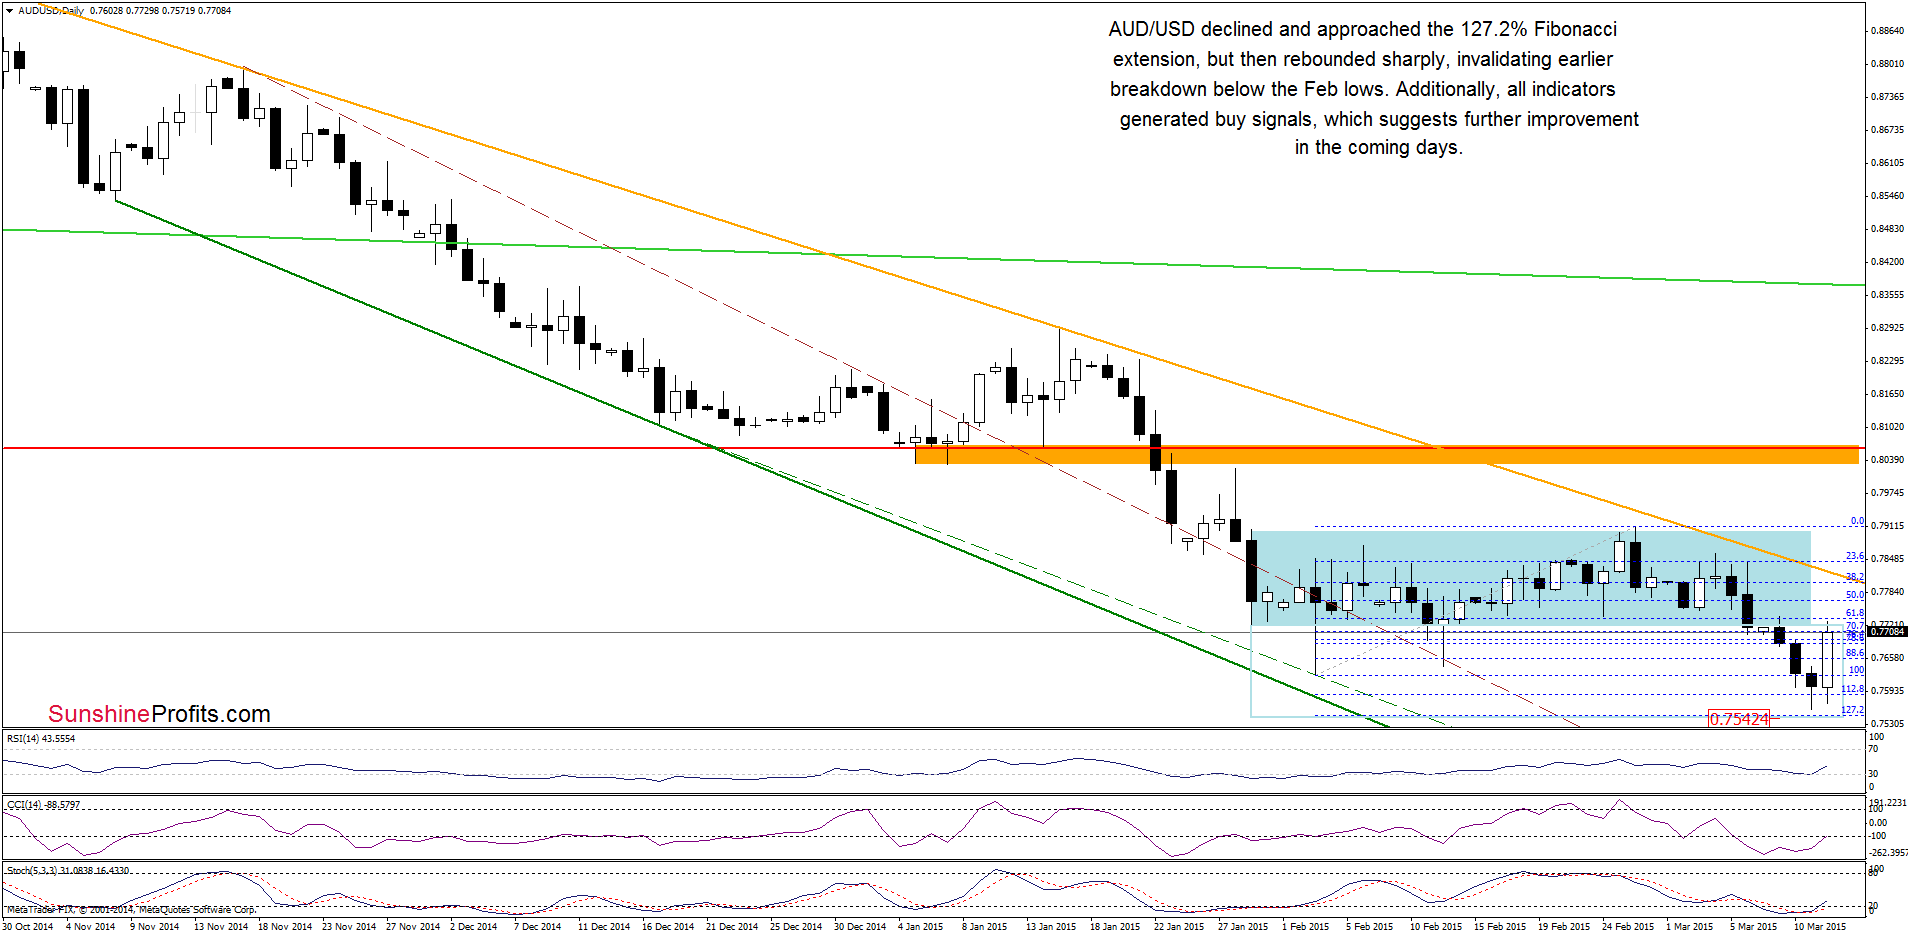
Quoting our last commentary on this currency pair:
(…) AUD/USD dropped under the lower border of the consolidation, hitting a fresh 2015 low of 0.7602, which suggests a drop to around 0.7542, where the size of the downward move will correspond to the height of the formation.
From today’s point of view, we see that the exchange rate extended losses yesterday, but the proximity to the above-mentioned downside target in combination with the 127.2% Fibonacci extension encouraged currency bulls to act. As a result, AUD/USD invalidated the breakdown below the Feb lows, which accelerated further improvement. In this way, the pair approached the previously-broken lower border of the consolidation, which is a positive signal. Additionally, all indicators generated buy signals, which suggests further improvement in the coming days.
Very short-term outlook: mixed with bullish bias
Short-term outlook: mixed
MT outlook: mixed
LT outlook: mixed
Trading position (short-term; our opinion): No positions are justified from the risk/reward perspective at the moment. We will keep you informed should anything change, or should we see a confirmation/invalidation of the above.
Thank you.
Nadia Simmons
Forex & Oil Trading Strategist
Przemyslaw Radomski, CFA
Founder, Editor-in-chief
Gold & Silver Trading Alerts
Forex Trading Alerts
Oil Investment Updates
Oil Trading Alerts
