
Based on the October 29th, 2013 Oil Investment Update
In our previous essay on crude oil we examined the medium-term outlook for light crude and the oil-to-oil-stocks ratio to see if there's anything on the horizon that could drive the price higher. As we wrote in the summary:
(…) light crude almost reached the medium-term support line, which may trigger a bigger pullback. Additionally, the oil to oil stocks ratio is at an extreme low, as indicated by the RSI. This could very well result in the end of the underperformance and strong performance of crude oil.
Since that essay was published, crude oil has hit a fresh monthly low of $93.07. In spite of this drop, yesterday light crude bounced off this level after the EIA showed that crude oil inventories rose less than expected last week. It was the biggest gain since October 17 and the price came back to around $95 per barrel. Does it mean that the final bottom in crude is already in? Before we try to answer this question, we’ll take a look at the situation from the long- and the short-term perspectives to check whether they confirm the indications from the medium-term picture or not.
Let’s start with a look at the monthly chart of light crude (charts courtesy by http://stockcharts.com).
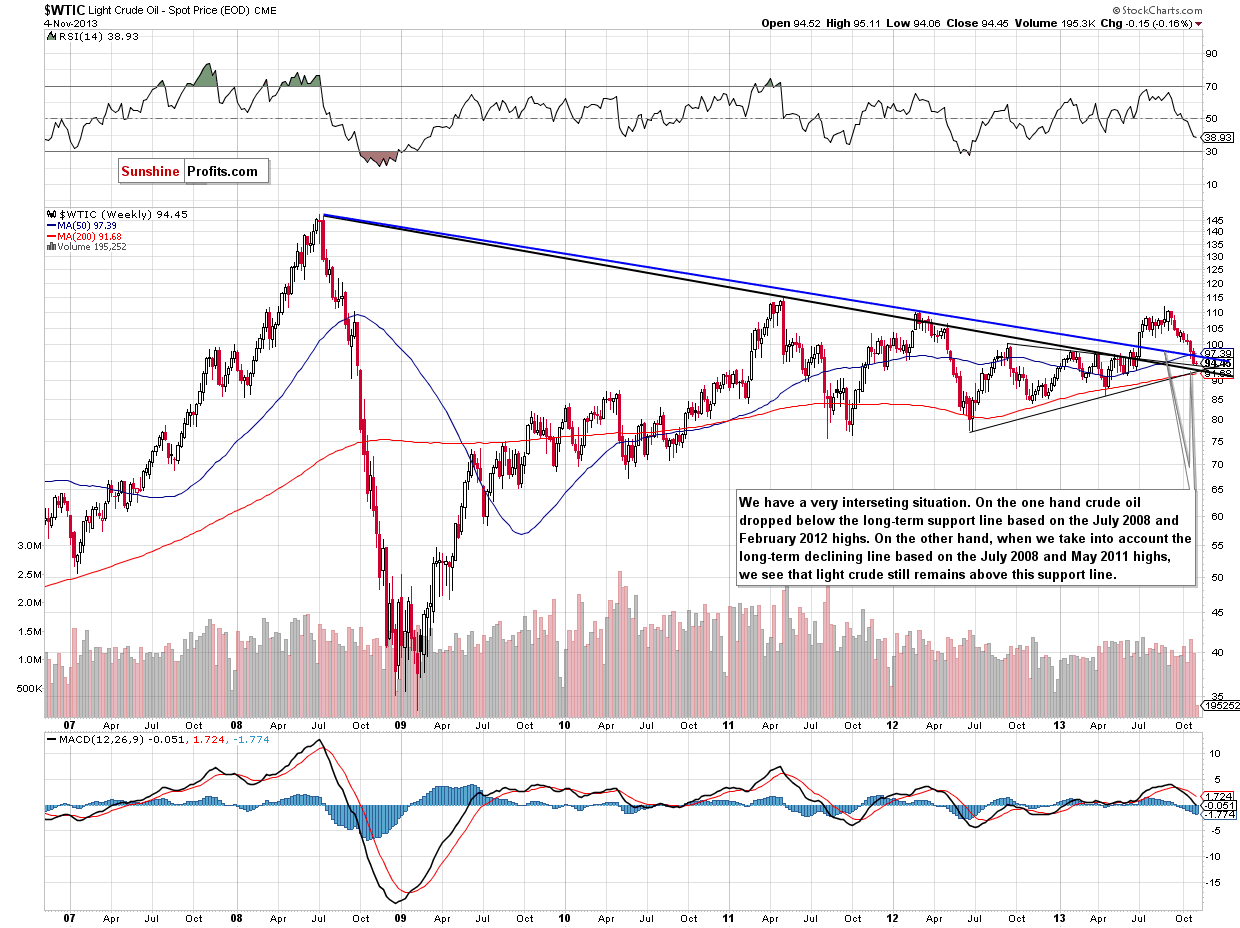
As you see on the above chart, there are two long-term declining support lines. The blue one is based on the July 2008 and February 2012 highs. When we take this line into account, we see that crude oil broke below it the previous week, which is a bearish sign. However, if we take into account the black long-term support line (based on the July 2008 and May 2011 highs), we see that light crude still remains above it and the situation is not that bearish.
In the recent days, crude oil reached the medium-term rising support line based on the June 2012 and April 2013 lows (around $93 per barrel). Additionally, it also moved to the long-term support line based on the July 2008 and May 2011 highs. In this way, light crude reached two important support levels and from this perspective it seems that the room for further decline is limited.
Once we know the long-term outlook, let’s zoom in our picture of the oil market and see the short-term chart.
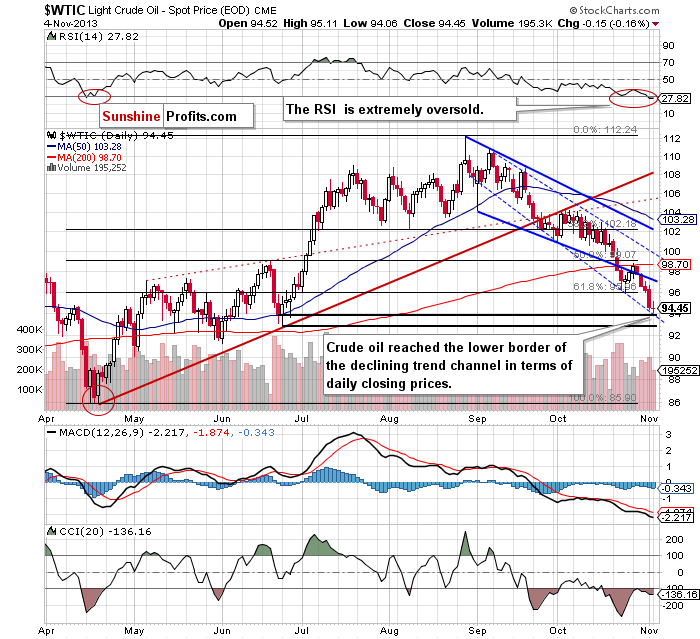
On the above chart, we see that oil bulls didn’t manage to push the price of crude oil above the 200-day moving average at the beginning of the previous week. This strong resistance stopped further growth and encouraged sellers to trigger another downward move. Last Wednesday, light crude declined below the lower border of the declining trend channel (in terms of intraday highs), which resulted in a test of the October low the following day. Unfortunately, on Friday oil bulls didn’t manage to push the price higher - it didn’t even reach the previously-broken lower border of the declining trend channel. This show of weakness encouraged sellers to act and resulted in a heavy decline, which took the price below the October low. With this downward move, light crude dropped below $95 and reached the lower border of the declining trend channel in terms of daily closing prices.
Earlier this week, we saw further deterioration and crude oil declined once again and hit a fresh monthly low of $93.07. In spite of this decline, oil bulls managed to hold the price in the range of the declining trend channel mentioned earlier (in terms of daily closing prices).
At this point, it’s worth mentioning that this line successfully stopped the recent corrective move, as seen on the chart. Additionally, light crude almost reached a support level based on the bottom of the corrective move that we had seen in June (in terms of daily closing prices). What’s interesting, when we factor in the Fibonacci price projections, we notice that the downward move from Oct. 3 to Nov. 4 is similar to the corrective move that we saw from Sept. 6 to Sept. 30. It’s worth noting that after the September decline we saw a pullback, therefore if history repeats itself, we may see similar price action in the coming days.
On top of that, the RSI dropped below the 30 level to its lowest level since April and was extremely oversold. Back in April, such a low value of the indicator had a positive impact on light crude – after the RSI moved to the 30 level, we saw a pullback in the following days. Looking at the above chart, we also see a positive divergence in the Commodity Channel Index.
Yesterday, all these positive circumstances encouraged buyers to act and the price of light crude bounced off the monthly low, which is a first bullish sign after six consecutive lower closes.
Summing up, although the situation is still unclear from the long-term point of view, light crude reached the declining long-term support line, which may trigger a bigger pullback. Additionally, it bounced off the lower border of the declining trend channel in terms of daily closing prices, which may result in further growth in the coming days (similarly to what we saw in the previous month). However, it’s too early to assume that the final bottom of the recent corrective move is already in.
Thank you.
Nadia Simmons
Sunshine Profits' Crude Oil Expert
Oil Investment Updates
Oil Trading Alerts
