
This essay is based on the Premium Update posted December 30th, 2009. Visit our archives for more gold articles.
The end of the year is usually calm on the capital markets. The volatility is low, as the money managers from all over the world take some time off and spend the Holiday Season with their families. At the same time, the end of the year is a perfect time for summarizing and reviewing this year's actions and making key decisions regarding the next year. The beginning of this essay will not be any different; especially that this is the year during which the Premium Service has been introduced, so I believe that a brief review on this year's performance would be quite useful.
This year has been gold, gold-er, gold-est for investors in the precious yellow metal. Generally, I don't like to brag about my past successful calls (although my friends with expertise in marketing tell me that I have to) - I strive to be the person that looks in the mirror when something goes wrong (to make improvements), instead of looking in it after I succeed. However, it currently seems that this year has really been successful and very profitable for Investors and Speculators, who decided to take advantage of my comments, and given this time of the year, I am going to remind you about a few of them. Please note that all comments that you find below are verifiable.
Exactly a year ago, at the end of December 2008, we sent my Readers an e-mail that said "we are approaching a very good entry point to add to your long-term holdings and perhaps to speculate on rising gold stock prices."
At that time the price of the yellow metal closed at $870. Those who bought gold on my advice watched their investment rally to a peak of $1, 225 a year later. The price of gold climbed the whole of 2009, mainly thanks to:
- Large investment demand
- Central bank purchases
- Declining dollar
- Fears of inflation
- Demand-supply mismatch in gold production and consumption.
- Speculative buying due to the breakout above $1,000
But as you know, nothing ever goes up in a straight line. There have been corrections and consolidations along the way. The great thing is that Subscribers of the Premium Service were not caught by surprise on any of the main twists and turns in the road that the price of gold traveled this year.
With 2009 coming to a close, we looked back at my analysis and recommendations throughout the year and it turns out that the efficiency has been rather good.
A few choice examples:
On February 18th I posted an essay entitled Warning! Precious Metals and Corresponding Stocks May Fall in a Few Days! That was about a month before we introduced the Premium Service, so this essay is available publicly (for verification purposes - here's a link to this essay on Kitco)
At that time gold had enjoyed a $200 rally to break $1,000. After the e-mail the price rallied for six more days, hit $1017, but fell rapidly by $100 two weeks later down to $910.
Fortunately, our Readers have been forewarned.
On March 27th (verification link) we wrote that "it is not out of the question that PM stocks will correct sharply only to soar in the following weeks"
On the day the essay was published, gold closed at $924. Twelve days later, on April 8th, gold dropped to $859. Two days before gold prices hit bottom the following was posted on the website:
The last few days have been really disappointing for people interested in the precious metals market, especially for long-term gold and silver investors. Fortunately for Investors following our analyses, it didn't come without a warning.
Less than two weeks later, on April 19th, we suggested that we have a bullish chart pattern in silver and that we are close to the bottom in gold. We encouraged long-term Investors to add to their positions.
On the day after the Premium Update was published, April 20th, the price of gold was $902. A month and a half later, on June 2nd, it rallied to $981.
On September 26th we suggested that gold prices are poised to take off. We sent a Market Alert on October 6th saying:
The momentum on the precious metals market is very strong. Given the strength of this week's rally, it seems that it can take gold to the 1070-80 area before looking back. It no longer pays to wait for lower PM prices, if you were planning to get back on the long side of the market, or to add to your positions.
In a Market Alert posted on November 3rd, we emphasized that the true risk was being out of the precious metals market. On that day gold closed at $1,084 and didnt look back until it climbed to its peak, $1,224 a month later.
Naturally the key question is if we warned our Subscribers in time that we are nearing a top and that prices were poised to fall.
On November 27th, six full days before gold hit its peak and began its subsequent decline, we sent out a Market Alert (it was sent out on the same day that the Premium Update was posted, because we wanted our Subscribers to be able to take action before the marked closes on that day). We wrote the following:
If you are still long gold/silver/PM stocks with your speculative capital it may make sense to exit your positions now. As mentioned above, there is a chance that the PM sector would get higher on a short-term basis, but the overnight weakness in metals ( ) is a strong bearish signal, so staying out of the market for the next several days/weeks (speculative capital) seems justified. There is an old saying that goes "when in doubt, stay out".
On the day of the alert, November 27th, gold closed at $1,172. It went up for another four trading days to hit a high of $1,224 and to close at $1,207 on December 3rd. The decline since then is history.
There is no magic in what your Editor does. I have no crystal ball - only training, knowledge and experience in many of the areas crucial to from the point of view of a Precious Metals Investor: macroeconomics, statistics, (behavioral) finance, monetary policy, risk management, modern portfolio theory, and most of all in studying the charts and interpreting the signals. Most importantly, I love what I do and I do it with passion and diligence.
Thank you for having taken this exciting journey with us this year. Thank you for your confidence, and your invaluable feedback. We will strive to read the map for you and guide you through the sometimes treacherous terrain in 2010 as well as we did in 2009.
So, what's in store for us next year? Lets turn to the charts to begin to gather the signs and clues (charts courtesy of http://stockcharts.com).
This week I would like to focus on the precious metals stocks.
Metals often move along with the corresponding equities, so it is usually useful to analyze the PM stocks, even if you are not inclined to trade them.
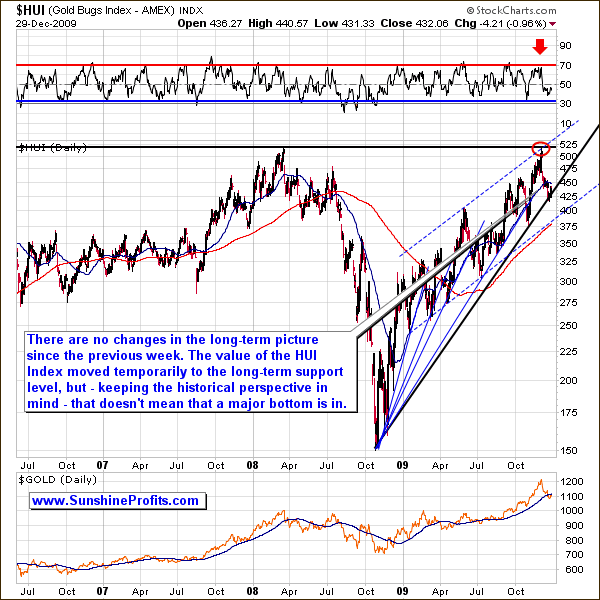
There are virtually no changes in the long-term picture of the HUI Index, so I will just paste my last week's comments, as they are up-to-date also today:
Please take a look at the thin blue lines coming from the same price/time combination. Each of them was pierced, before the final bottom was put in, and this is what I expect to take place this time.
The very long-term support line has just been touched. The HUI Index even moved below it on an intra-day basis, but finally closed above this level. (...) taking the historical performance of the gold stock sector, it seems that PMs will need to move a little lower before putting in a bottom. The short-term chart confirms this.
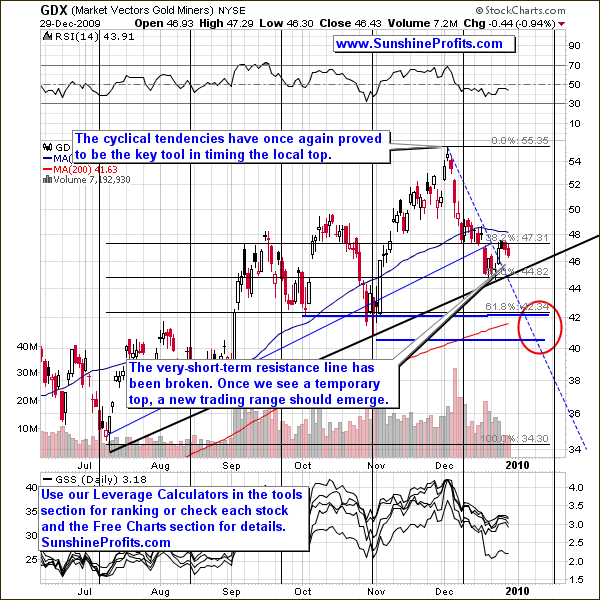
The cyclical tendencies are not only visible on the silver market, but also in PM stocks (here: the GDX ETF), and the USD Index. On the above chart, they suggest that the next turning point will emerge in January, most likely in its early part. Taking into account the shape and direction of the current move, it seems that this is going to be a bottom.
I've marked the area that I believe that is likely to stop the current decline with a red ellipse. The $40 - $42 level is likely to stop the move, because it includes two support levels that have already stopped declines in the past (in October and November), and also because it would perfectly fit the zigzag shape of the decline - I've noticed that declines on the precious metals market (especially in PM stocks) tend to take this particular form.
Moreover, the Fibonacci retracement level of 61.8% is also within the are marked with red ellipse - just above the $42 level.
The analysis of the PM stocks with emphasis on their performance relative to other stocks provides us with similar implications.
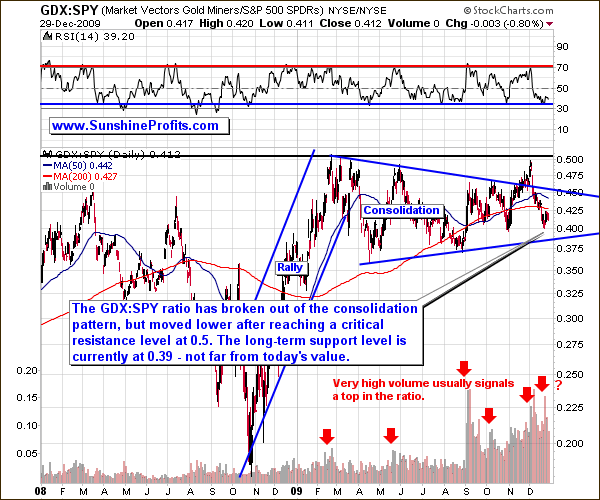
The GDX:SPY ratio describes how did the gold stocks perform versus stocks from other sectors. The ratio has been consolidation through the whole 2009, but that doesn't necessarily mean that the probability that PM stocks will move higher is the same as the probability that the main stock indices will. Why? Because of the fundamentals, which are the thing that drives the prices of every asset class in the long term.
The most important fundamental factor for PM stocks are PM prices (poised to rally), while the fundamental factor for the main stock indices is the health of the world economy. Clearly, the PM stock Investors are better positioned in the long run than Investors purchasing mix of all other shares.
So, why didn't the ratio move higher during 2009? Taking a broader perspective allows me to answer this question. The probable reason is that this ratio has formed a massive rally a year ago, when it moved from below 0.2 to 0.5 in just four months. Such a dramatic move requires a significant breather before a market is ready to move higher.
It currently seems that this ratio will need to move a little lower - to 0.39 level before a bottom is reached. This means that PM stocks and also the rest of the PM market is likely to move lower in the short term.
The last but definitely not the least signal (or rather the lack of the signal) comes from one of our own indicators (designed to signal turning points).
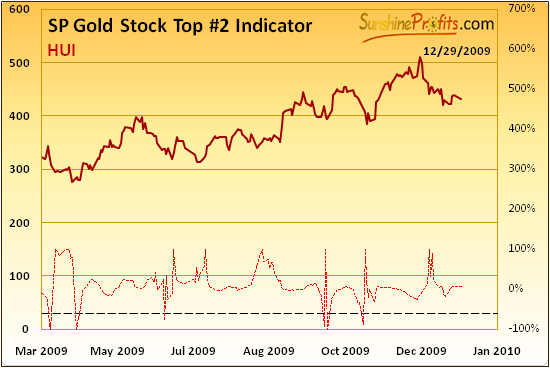
Last week I wrote the following:
Please note that the majority of bottoms were not reached until there was a confirmation from the above indicator. There was no such signal so far, which means that the bottom is likely to be put in the (most likely not too distant-) future, and that it didn't take place yet.
This week we have not seen the confirmation signal either, so it seems that the major bottom is still ahead of us. Once we get a confirmation, we will send out a Market Alert to our Subscribers.
Summing up, the precious metals market is currently in the "close to the bottom" mode. The key question is how close is "close enough for you" to enter the market. The answer depends on your individual preferences. Long-term Investors may want to purchase PMs and corresponding equities right away, regardless of the fact that the bottom may be formed in a few weeks. While this may seem careless at the first sight, I assure you it is not. The calculations behind managing large amounts of money in a strong bull market point to the fact that the true risk is to be out of the market.
To make sure that you are notified once the new features (like the newly introduced Free Charts section) are implemented, and get immediate access to my free thoughts on the market, including information not available publicly, I urge you to sign up for my free e-mail list. Sign up today and you'll also get free, 7-day access to the Premium Sections on my website, including valuable tools and charts dedicated to serious PM Investors and Speculators. It's free and you may unsubscribe at any time.
Thank you for reading.
Wishing you a happy and very profitable New Year,
P. Radomski
--
This week's Premium Update is one of the biggest that we've created so far - 14 charts and over 5000 words dedicated to the precious metals market and everything around it with the focus on the long-term success of your portfolio. We analyze gold, silver, and PM stocks from both long- and short-term perspective. In fact, the analysis of the long-term gold chart had to be split into two separate charts because of the amount of the information that they contain. Other things covered in this Premium Update include: the change in the correlations between PMs and one of their key drivers, PM stocks' relative performance to other stocks, analysis of the financial sector, one of our unique indicators, the cyclical tendencies on the following markets: silver, PM stocks, USD Index - and much more.
Additionally, I summarize the performance of the Premium Service in 2009, which I'm sure you will agree has achieved a high degree of accuracy. Below you will find a few examples of the points that were made in the past:
- December 2008 - we urged our Readers to enter long-term trades in gold. (It started at $870 and went up to a high of $1,224 a year later.)
- February 18th - we warned short-term Speculators of an upcoming decline. (The price of gold went down six days later by $100.)
- April 20th - we encouraged our Subscribers to add to their gold position. (That day gold began a month and a half rally from $902 to $981.)
- November 3rd - we warned our Subscribers that the real risk is to be out of the precious metals market.(That day gold closed at $1,084 and didnt look back until it climbed to its peak, $1,224 a month later.)
Moreover, after its parabolic rise, we provided our Subscribers with full six-day warning ahead of time to close out their positions before the price of gold began its decline. On November 27th we sent out the following:
If you are still long gold/silver/PM stocks with your speculative capital it may make sense to exit your positions now.
That day gold closed at $1,172, went up for another four trading days to hit a high of $1,224, and began its decline since December 3rd.
We encourage you to Subscribe to the Premium Service today and read the full version of this week's analysis right away.
