
tools spotlight

-
Can a Rally in Gold Stocks Really Be Bearish?
November 18, 2022, 9:17 AMHistory tends to repeat itself, and mining stocks appear to be repeating their 2008 performance, which has very interesting implications.
Why do I think that gold miners are repeating their 2008 price patterns? Please take a look at the below chart.
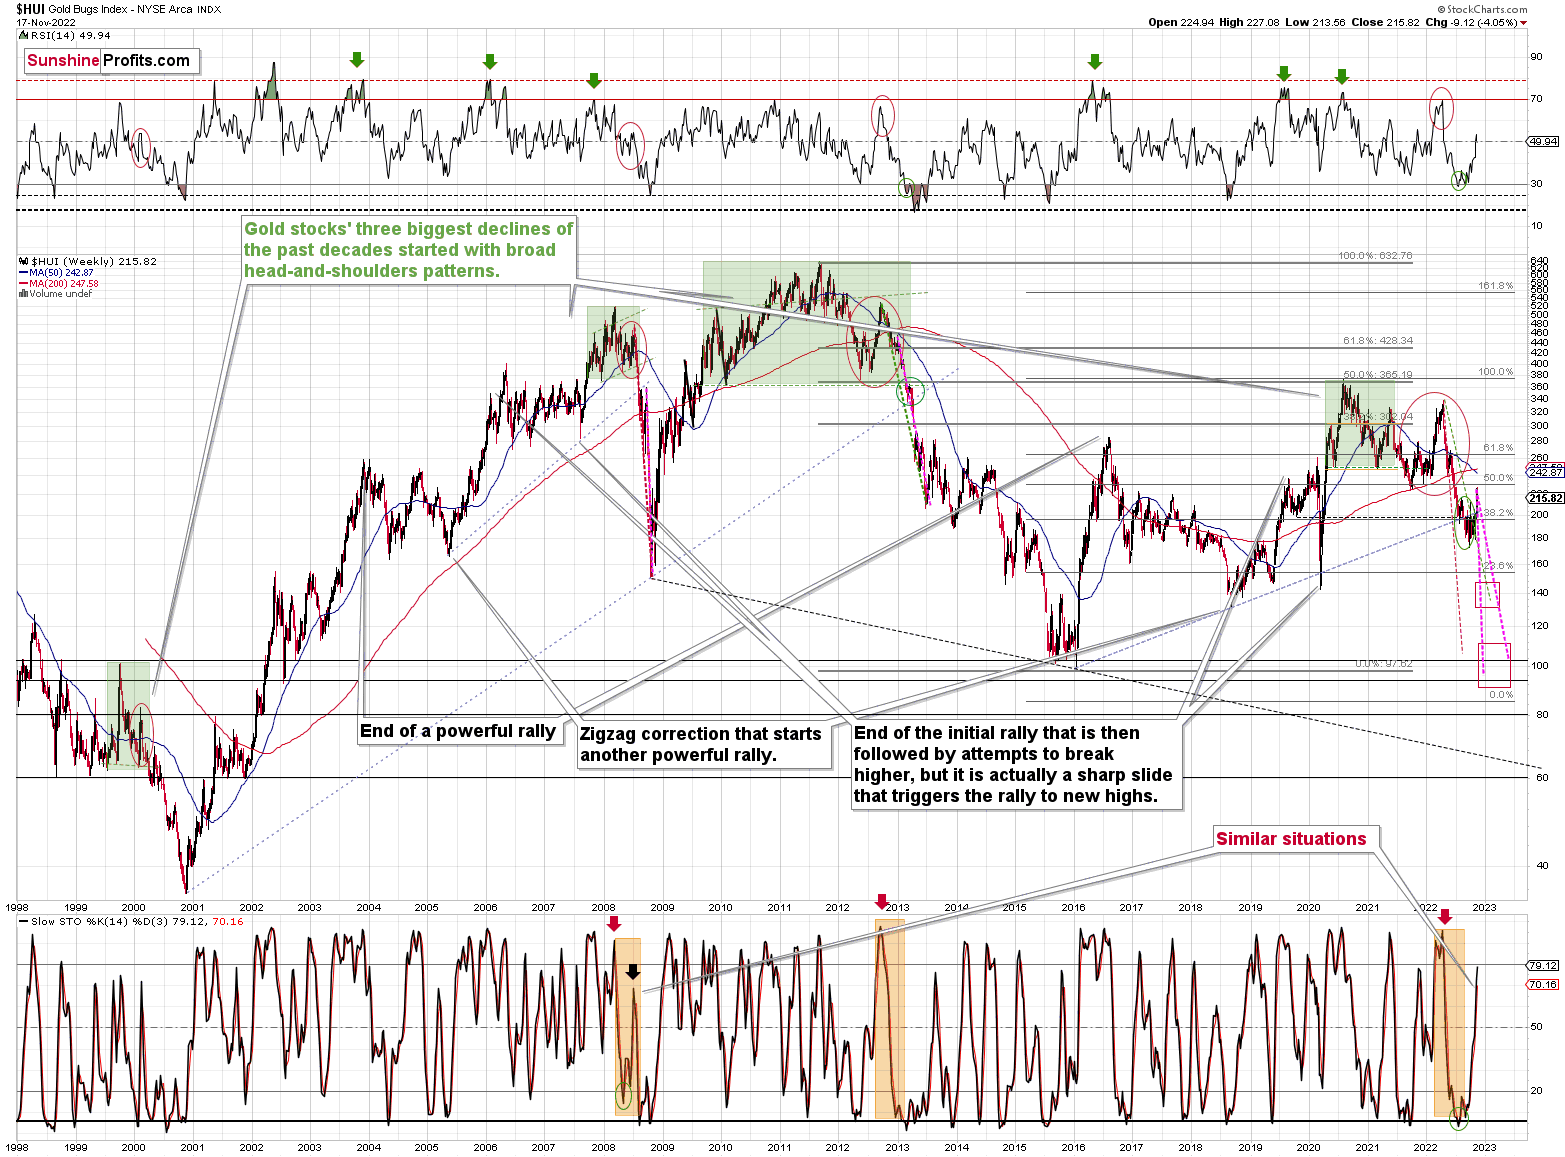
The only times when gold stocks declined similarly sharply as they did this year were in 2013 and in 2008.
Given that the situation in stocks appears to be similar to what we saw in 2008 (due to rising interest rates, for example), it seems that focusing on this analogy is particularly important right now.
All right, let’s zoom in and see how mining stocks declined in 2008.

Back then, the GDXJ ETF was not yet trading, so I’m using the GDX ETF as a short-term proxy here.
The decline took about 3 months, and it erased about 70% of the miners’ value. The biggest part of the decline happened in the final month, though.
However, the most intriguing aspect of that decline – which may also be very useful this time – is that there were five very short-term declines that took the GDX down by about 30%.
I marked those declines with red rectangles. After that, a corrective upswing started. During those corrective upswings, the GDX rallied by 14.8-41.6%. The biggest corrective upswing (where GDX rallied by 41.6%) was triggered by a huge rally in gold, and since I don’t expect to see anything similar this year, it could be the case that this correction size is an outlier. Not paying attention to the outlier, we get corrections of between 14.8% and 25.1%.
Fast forward to the current situation. Let’s take a look at the GDXJ ETF.

The junior mining stocks moved sharply higher recently, and this move took place on huge volume (I spoke about it on Nov. 7). The only similarly big volume that we saw recently was at the early-March top and the January top. As history has shown, the massive attention that junior miners have received is a bearish indicator (not only for miners but also for related parts of the precious metals market, including gold and silver prices too).
Back in 2008, the biggest corrective upswing (the 41.6% rally) was the thing that preceded the biggest part of the medium-term decline.
This time, the volatility is not as big, but the size of the corrective upswing (assuming that it started in September) that we just saw is also greater than what we’ve seen before. Consequently, it could be the case that what happened recently is what “had to” happen given the way history decided to rhyme. Please note that we can estimate what is likely to happen based on historical analogies, but we can never be 100% certain that a given analogy will work and some others won’t.
In this case, it seems that the correction happened, even though it didn’t “have to” happen based on many other techniques. Either way, the medium-term trend remains down, so the current corrective upswing is likely to be a “thing of the past of little meaning” sooner rather than later.
Speaking of analogies, I previously wrote that the current rally is a mirror image (it’s not a crystal-clear mirror, though) of the corrective decline that we saw in late March 2020. As it turned out, due to the most recent part of the upswing, the size of both moves became even more aligned.
And yes, this means that another decline could take the GDXJ all the way down to its 2020 low, or very close to it.
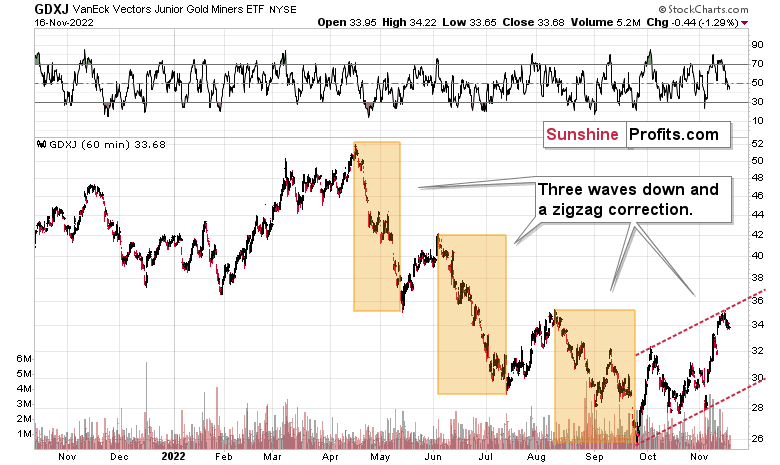
On the below chart, I marked just how perfectly the recent price moves played out according to the Elliott Wave Theory.
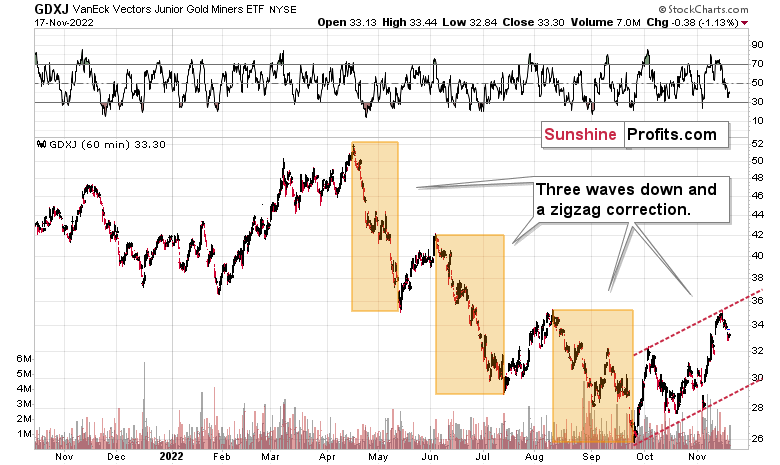
Of course, EWT is not the only tool that one could use, and I find other technical tools more useful, but still, this kind of pattern-following is uncanny.
The classic EWT pattern is three waves down (I marked those with orange rectangles) and then a correction consisting of two smaller waves.
That’s exactly what we have seen in recent months. The September–now pattern appears to be the above-mentioned correction. It didn’t only consist of two smaller waves higher – they were actually almost identical in terms of size and sharpness. This created a classic ABC correction (flag) pattern.
Now, since this pattern is complete, another huge 3-stage move lower can – and is likely – to unfold. This is very bearish for junior mining stocks (as well as for gold, silver, and probably other commodities), and the fact that juniors are already showing weakness relative to gold (on Wednesday, the latter was almost flat while miners declined) serves as a bearish confirmation. As always, I can’t guarantee anything, but in my view, the profits that can be reaped on this upcoming slide in mining stocks can be enormous.
Thank you for reading our free analysis today. Please note that the above is just a small fraction of the full analyses that our subscribers enjoy on a regular basis. They include multiple premium details such as the interim targets for gold and mining stocks that could be reached in the next few weeks. We invite you to subscribe now and read today’s issue right away.
Sincerely,
Przemyslaw Radomski, CFA
Founder, Editor-in-chief -
Although Gold Barely Moved, the GDXJ Took Bearish Action
November 17, 2022, 9:16 AMThe precious metals market appears to have topped. The fact that junior miners underperform gold serves as bearish confirmation that more downward waves may follow.
Almost everything I wrote and said yesterday also is still relevant today.
In Tuesday’s analysis, I wrote the following about the USD Index:
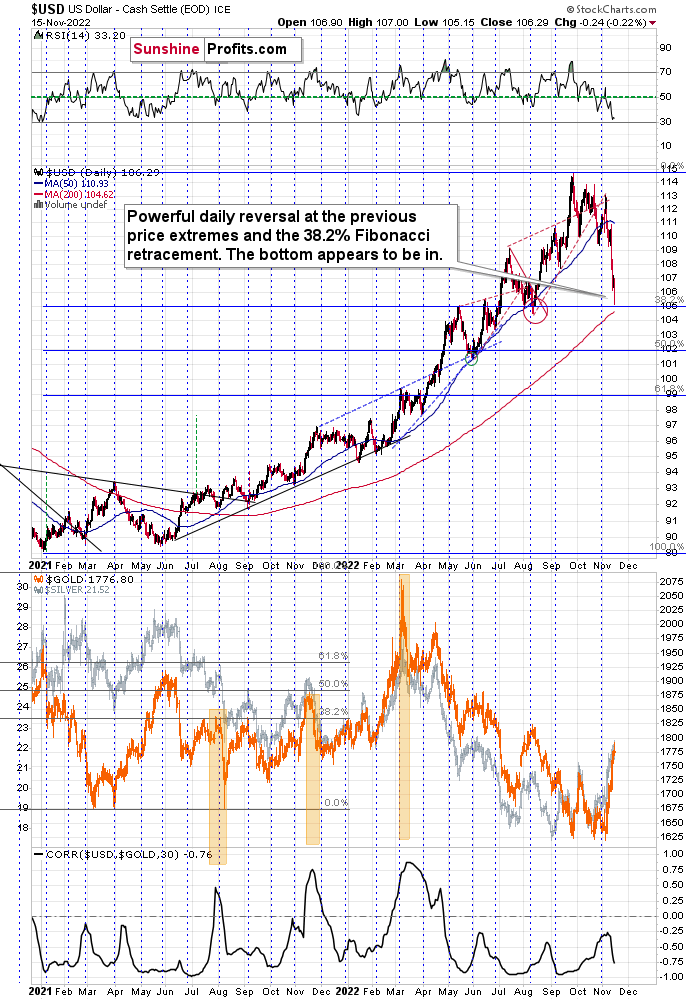
For example, the USD Index could decline to its strong support level at the 38.2% Fibonacci retracement and the August 2022 low as well as the May 2022 high. Such a move would likely imply the RSI at about 30, which would be a crystal-clear signal for many traders that the bottom is in.
To clarify, if that happened, the USD Index would be as oversold from a short-term point of view as it was at its 2021 bottom – when it was trading at about 90.
Despite the intraday attempt to move lower, the support held.
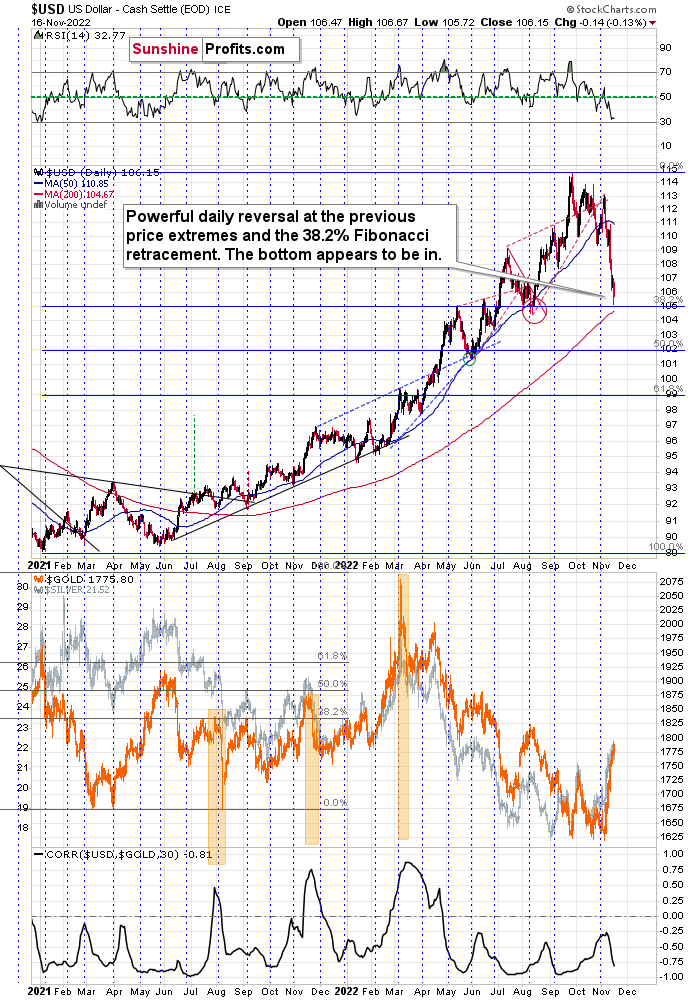
Consequently, what I wrote below the USDX chart yesterday remains up-to-date:
The USDX moved very close to the above-mentioned support levels, and it moved back up before the end of the day. The only reason that the RSI didn’t move to 30 is because the USDX declined only on an intraday basis. This means that from the RSI’s point of view, the situation is only “very bullish,” not extremely so. However, given the reversal nature of yesterday’s session, the outlook just became even more bullish, and it seems to me that the bottom is in.
This means that the top in the precious metals market is also likely in or at hand, especially given the S&P 500’s inability to break through its own 38.2% Fibonacci retracement.
Despite the USD Index closing a bit lower than on Tuesday, the GDXJ closed the day over 1% lower.
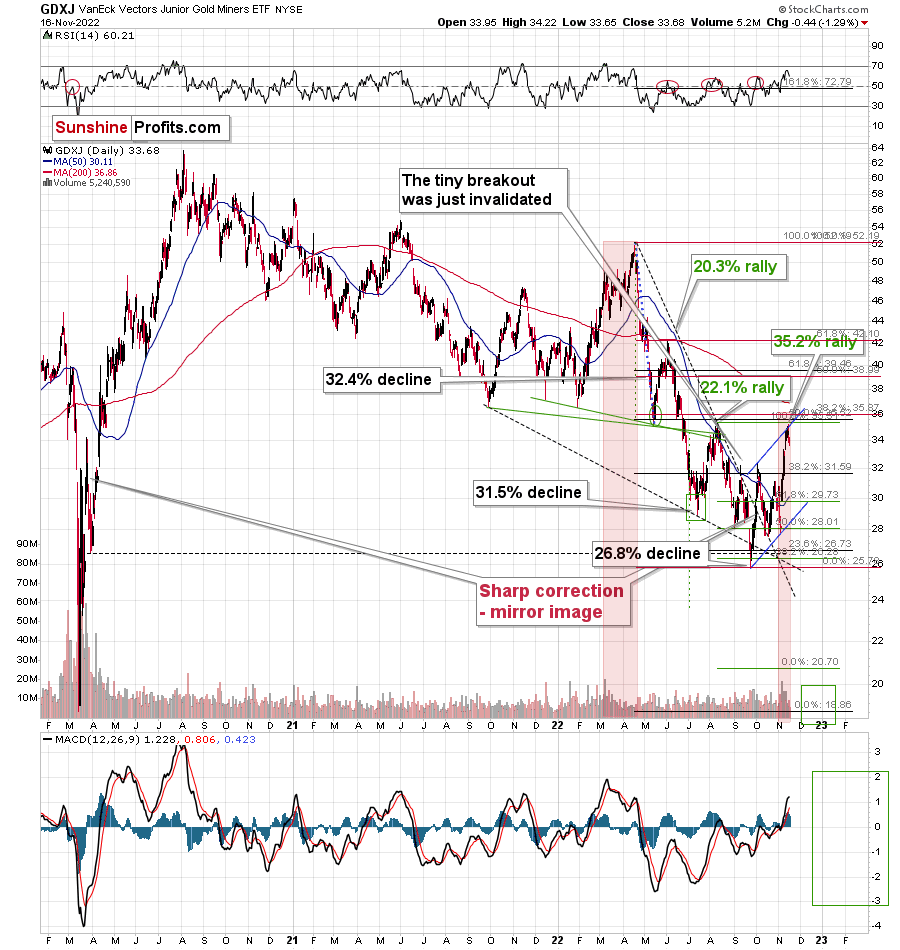
As I said and wrote earlier, the precious metals market appears to have topped.
Interestingly, it appears that the classic Elliott-wave pattern has just been completed and that a new massive wave down is about to take occur.
The classic EWT pattern is three waves down (I marked those with an orange rectangle) and then a correction consisting of two smaller waves.
That’s exactly what we have seen in recent months. The September–now pattern appears to be the above-mentioned correction. It didn’t only consist of two smaller waves higher – they were actually almost identical in terms of size and sharpness. This created a classic ABC correction (flag) pattern.
Now, since this pattern is complete, another huge 3-stage move lower can – and is likely – to unfold. This is very bearish for junior mining stocks (as well as for gold, silver, and probably other commodities and stocks), and the fact that juniors are already showing weakness relative to gold (the latter was almost flat yesterday, while miners declined) serves as a bearish confirmation. As always, I can’t guarantee anything, but in my view, the profits that can be reaped on this upcoming slide can be enormous.
Thank you for reading our free analysis today. Please note that the above is just a small fraction of the full analyses that our subscribers enjoy on a regular basis. They include multiple premium details such as the interim targets for gold and mining stocks that could be reached in the next few weeks. We invite you to subscribe now and read today’s issue right away.
Sincerely,
Przemyslaw Radomski, CFA
Founder, Editor-in-chief -
The Gold Market: Is It a Peak Before a Big Fall?
November 16, 2022, 9:21 AMBased on the recent movements of the dollar and the S&P 500, the situation of the gold market can also be assessed. Did we just see the top?
In yesterday’s analysis, I wrote the following about the USD Index:
For example, the USD Index could decline to its strong support level at the 38.2% Fibonacci retracement and the August 2022 low as well as the May 2022 high. Such a move would likely imply the RSI at about 30, which would be a crystal-clear signal for many traders that the bottom is in.
To clarify, if that happened, the USD Index would be as oversold from a short-term point of view, as it was at its 2021 bottom – when it was trading at about 90.
Here’s what happened:
The USDX moved very close to the above-mentioned support levels, and it moved back up before the end of the day. The only reason that the RSI didn’t move to 30 is because the USDX declined only on an intraday basis. This means that from the RSI’s point of view, the situation is only “very bullish,” not extremely so. However, given the reversal nature of yesterday’s session, the outlook just became even more bullish, and it seems to me that the bottom is in.
This means that the top in the precious metals market is also likely in or at hand, especially given the S&P 500’s inability to break through its own 38.2% Fibonacci retracement.
I’ll explain more in the video below:
Thank you for reading our free analysis today. Please note that the above is just a small fraction of the full analyses that our subscribers enjoy on a regular basis. They include multiple premium details such as the interim targets for gold and mining stocks that could be reached in the next few weeks. We invite you to subscribe now and read today’s issue right away.
Sincerely,
Przemyslaw Radomski, CFA
Founder, Editor-in-chief -
Silver Moved Higher: Can It Be Consider Bullish?
November 15, 2022, 6:39 AMSilver outperformed gold, but its strength may mean something other than a promise of further rallies. Is corrective upswing coming to an end?
Very little changed on the markets yesterday, which means that my yesterday’s analysis remains up-to-date. There are a few technical details that I’d like to additionally mention today.
The first detail comes from the silver market.
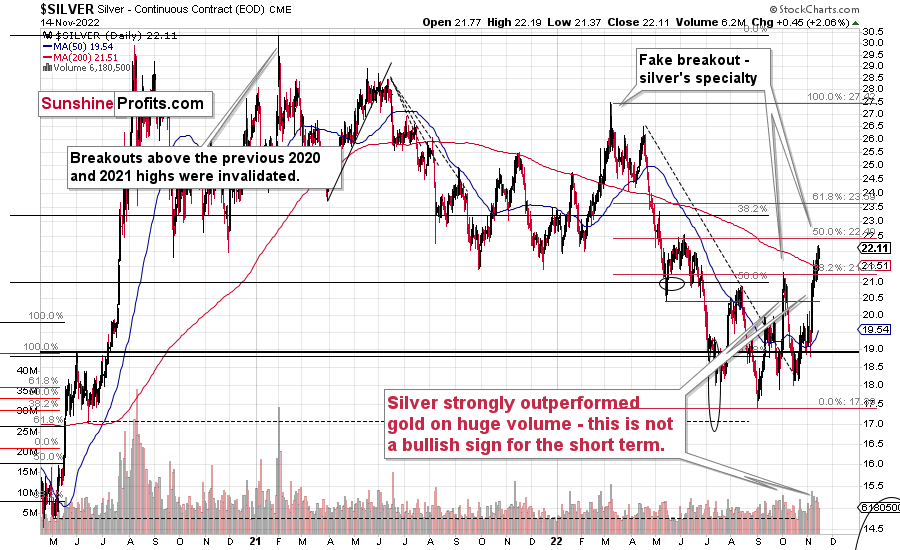
The white metal has been making higher highs and higher lows in the past few months, which might seem bullish at first sight.
However, higher lows and higher highs are only a short-term phenomenon!
From a broader point of view, what we saw recently is still a flag pattern, which is a continuation pattern.
Silver corrected less than a half of its preceding decline (please note the red Fibonacci retracements), and while it’s been stronger than gold and mining stocks on a relative basis recently, it doesn’t mean that the downtrend has ended.
In fact, silver’s strength can often be viewed as a bearish indication because it tends to catch up and outperform gold in the final parts of a given upswing. This is particularly visible in the case of medium-term upswings.
Ok, so the medium-term trend is bearish, but what about the near term?
Truth be told, it wouldn’t surprise me to see silver move slightly higher before declining profoundly - with vengeance. The reason is that silver is very close to its June 2022 high as well as its 50% Fibonacci retracement.
The silver price broke above the other resistance levels, so it’s likely to move higher. Then again, the fact that two resistance levels coincide at a similar price level (~$22.5) means that this resistance is particularly strong.
Consequently, it seems that we’re in a “pennies to the upside, dollars to the downside” situation in silver.
Let’s keep in mind that since silver tends to outperform the rest of the precious metals sector in the final parts of a given upswing, the above-mentioned small rally in silver might not translate into higher gold or mining stock prices.
What could be the potential trigger for another small move higher in silver?
For example, the USD Index could decline to its strong support level at the 38.2% Fibonacci retracement and the August 2022 low as well as the May 2022 high. Such a move would likely imply the RSI at about 30, which would be a crystal-clear signal for many traders that the bottom is in.
To clarify, if that happened, the USD Index would be as oversold from a short-term point of view, as it was at its 2021 bottom – when it was trading at about 90.
The trigger could also come from the declining stock market.

As I wrote yesterday, the S&P 500 moved to its 38.2% Fibonacci retracement, which serves as a strong resistance level.
Indeed, stocks declined yesterday after a tiny attempt to move higher. In other words, the S&P 500 failed to rally above the 38.2% retracement, which increases the odds that the top is already in. At the moment of writing these words, the S&P 500 futures are trading slightly below 4,000, which means that there was no breakout above the above-mentioned retracement.
A decline from here would be bearish for gold, silver, and mining stocks, but particularly for the last two due to their higher correlations with stocks. The link with crude oil is less certain, but the implications are more likely to be bearish than bullish, in my view.
All in all, it seems that the corrective upswing in the precious metals sector is over or about to be over and that the truly powerful downtrend will resume any day now.
Thank you for reading our free analysis today. Please note that the above is just a small fraction of the full analyses that our subscribers enjoy on a regular basis. They include multiple premium details such as the interim targets for gold and mining stocks that could be reached in the next few weeks. We invite you to subscribe now and read today’s issue right away.
Sincerely,
Przemyslaw Radomski, CFA
Founder, Editor-in-chief -
What the Recent Drop in the USDX Tells Us About Gold
November 14, 2022, 9:21 AMThe recent dollar decline may be considered sharp, which has piqued investors’ interest. However, did it have any bearing on the medium-term outlook for gold?
Last week was quite rich in volatile price moves, and I commented on most of them in Thursday’s extensive analysis.
What happened on Friday (the USD Index’s decline) didn’t really change anything regarding the outlook. In fact, it actually confirmed it.
I received quite a few questions about the USDX, so let’s start today’s analysis with it.

From a short-term point of view, the decline was very sharp. It was near-vertical. The USD Index almost touched its August lows. What does it tell us about the USDX, and about gold?
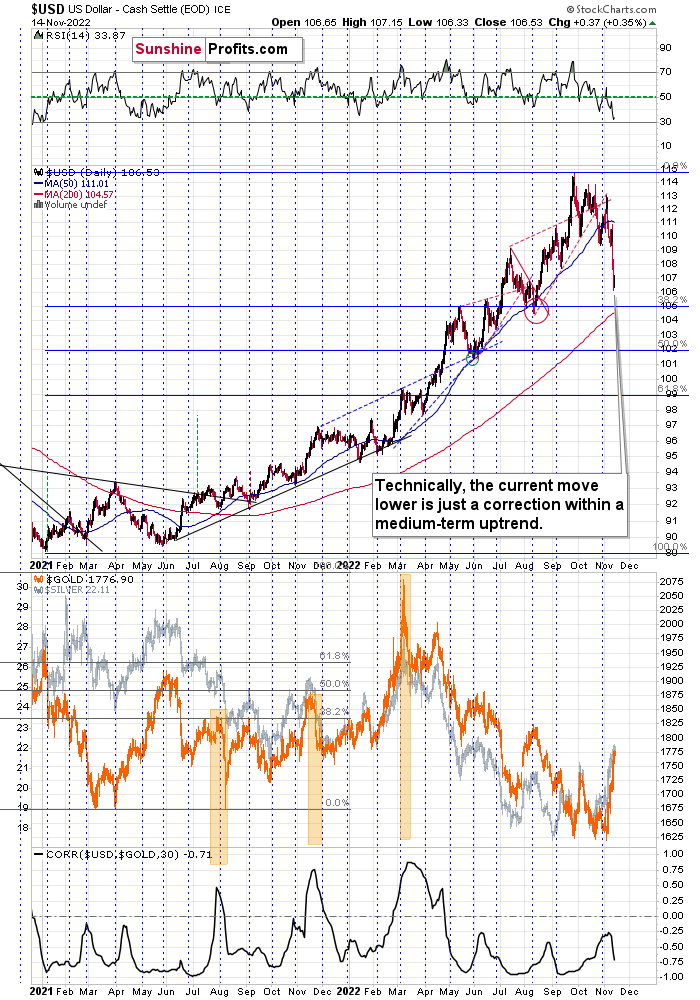
As far as the USD Index itself is concerned, it actually tells us very little. This is because the correction was smaller than 38.2% of the preceding big upswing. As such, from the technical point of view, this correction is simply “normal.”
I realize that moves over 1+ index point per day seem to be far from normal, but please consider the context – “context is king” after all. The preceding rally was huge, and the USDX hasn’t corrected in a truly meaningful manner for many months.
The previous moves lower were really small compared to the size of the rally.
Now, does the size of the current corrective decline indicate that this short-term decline is something more than just a correction? Maybe the start of a new, powerful downtrend?
No.
The Fibonacci retracement levels help put the price moves into proper perspective. Generally, anything less than 38.2% or exactly 38.2% as the size of the correction means that it’s… Well, just a correction, and there’s little reason to think otherwise.
If the previous trend resumes after a correction that’s equal to or smaller than the 38.2% of the previous move, it suggests that the main trend is very strong.
At this moment, we don’t have a good reason to think that the medium-term uptrend in the USDX has been invalidated.
Yes, the current correction is bigger than the previous ones, but it doesn’t have particularly bearish implications.
Before we move to the analysis of the general stock market, I’d like to point out where the RSI is right now.
It’s slightly above 30. The last time it was this low was in mid-2021 – right at the major bottom (and at a major top in gold).
Speaking of gold, the above means that the bullish impact that the recent decline in the USD Index had on gold, is about to reverse, either right away or shortly. And as the medium-term trend in the USD Index remains up, the medium-term trend in the precious metals sector remains down. Consequently, the next big move in gold is likely to be to the downside, not to the upside.
This, in turn, means that now is a great time to enter short positions in the precious metals market (I prefer junior mining stocks as a proxy for this), not to exit them or to enter long positions. Of course, that’s just my opinion, but please consider the obvious fact that tops are formed when bullishness and emotionality reach zenith.
The number of not only emails that I just received but also messages about gold that I received from my non-work-related friends and colleagues is huge. This is usually a good indication that a top is in or at hand.
Additionally, there was one great “enough is enough” signal from the USD Index on Friday. Namely, while the USD Index declined once again, the precious metals market didn’t really move to new highs. I mean, from a practical point of view - a $0.09 rally in the GDXJ is not much different than nothing. The implications are bearish for the precious metals market, as the above indicates that the buying power is drying up or has already dried up.
As the USD Index’s corrective downswing appears to be over or about to be over, the corrective upswing in stocks seems to be ending as well.
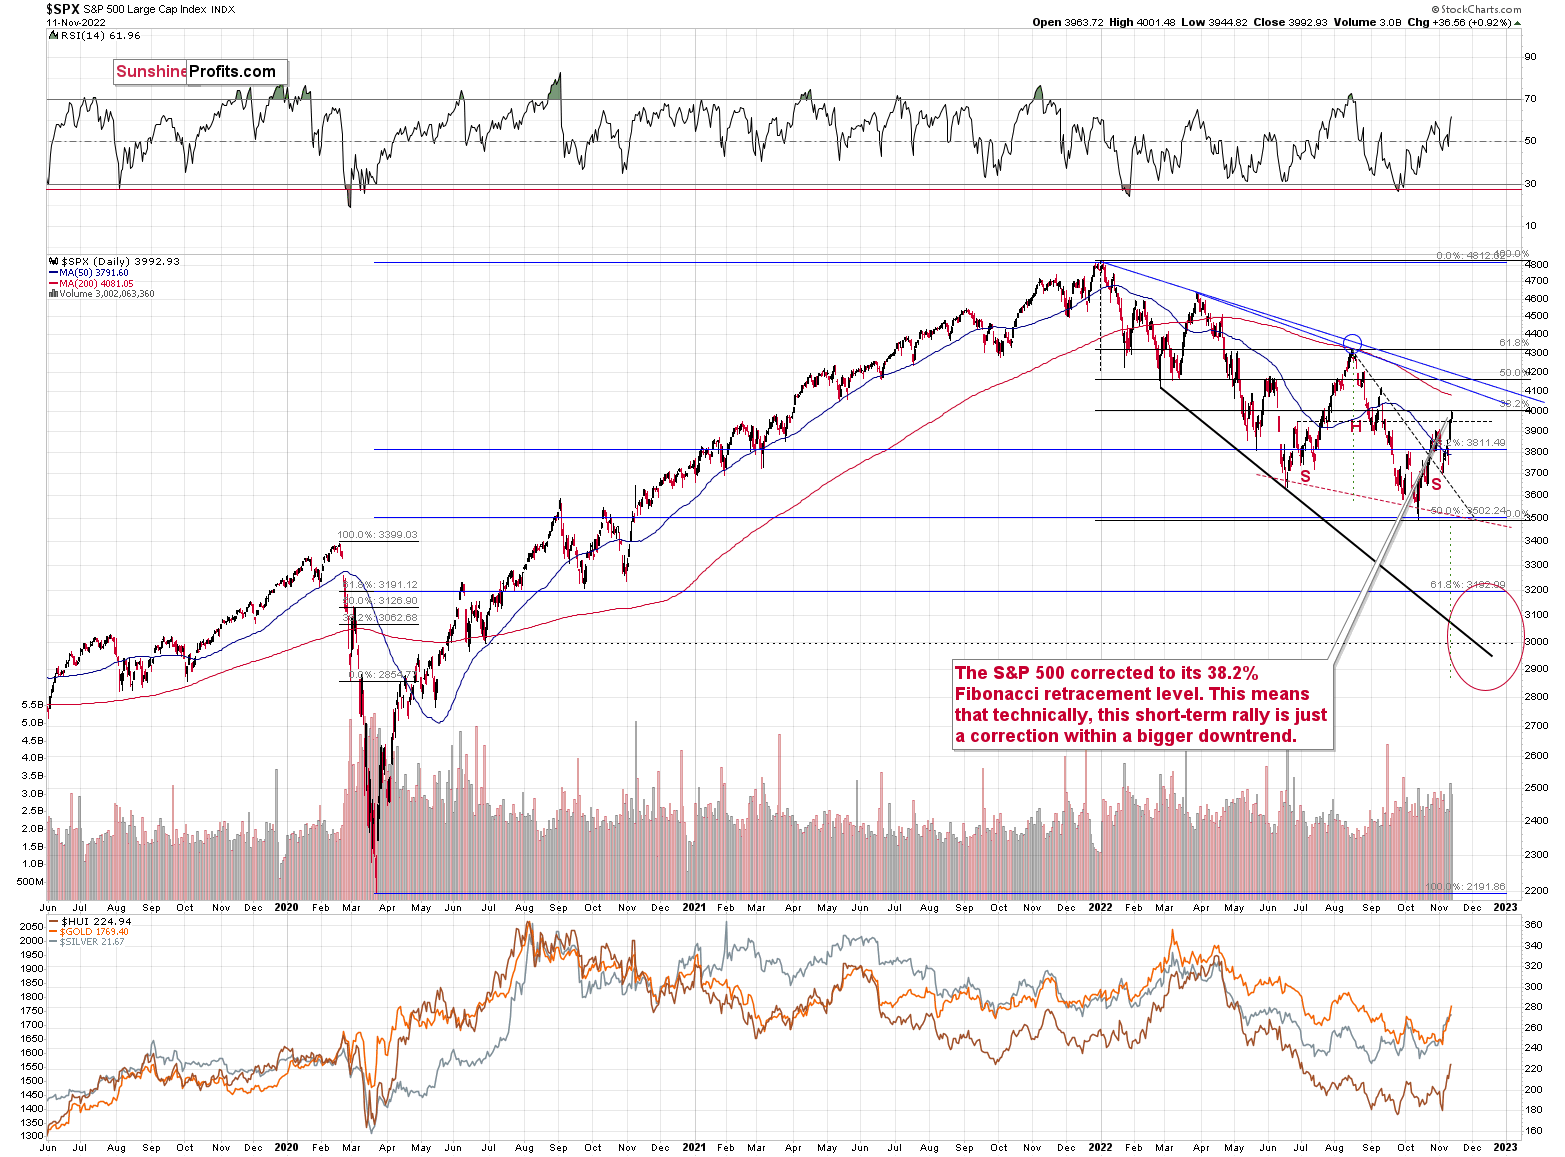
As you can see on the above chart, the S&P 500 moved to its 38.2% Fibonacci retracement and the psychologically important 4,000 level, and then it closed the week below it.
While it doesn’t guarantee it (there are no guarantees on any market), the above indicates that the corrective upswing might already be over.
This also makes sense from a fundamental point of view. The market rallied, hoping that the Fed would make a dovish U-turn as the job appeared to be done since the CPI declined a little. But those expectations actually mean that the Fed will have to raise rates higher and for longer! If people believe that interest rates will not rise but that inflation will fall, they will continue to spend, and businesses will increase hiring, etc. That’s inflationary. If the Fed is serious about fighting inflation, it must persuade people that it will not back down.. And they want to fight it, because that’s what the voters are concerned about the most.
As a result, we can expect various clarifications from Fed members that they will fight inflation in order to shift expectations in the opposite direction. That’s likely to push stocks and the precious metals market lower. Probably much lower.
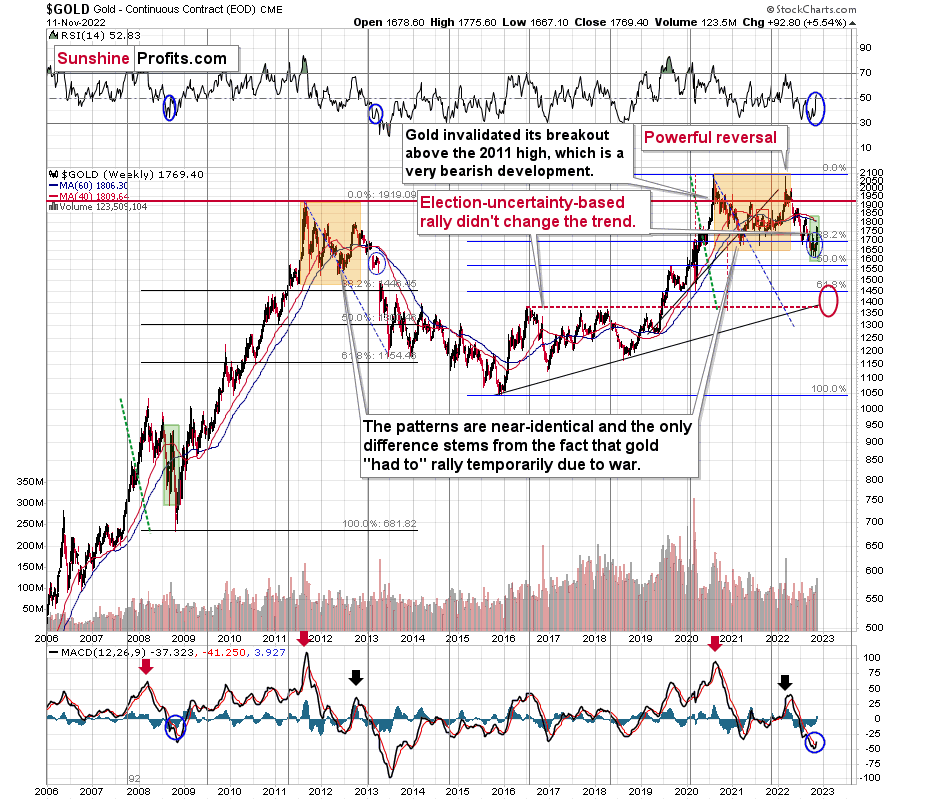
Looking at the gold market from a broader point of view reveals that what we saw recently is something between what we saw in 2013 and what we saw in 2008.
For many months, I've been writing that the situation is analogous to both of the preceding periods, and that the recent sharp corrective upswing fits this narrative rather than breaking it.
Yesterday’s weekly volume reading was the second biggest reading that we have seen this year. The record was formed in early March – at the yearly top. Does this sound bullish? No, it’s a bearish indication, as history tends to rhyme.
Returning to the 2008 comparison, please keep in mind that the sharp rally seen back then was much larger than what we saw this time. The moves higher in the RSI are similar, and I marked them with blue.
Thank you for reading our free analysis today. Please note that the above is just a small fraction of the full analyses that our subscribers enjoy on a regular basis. They include multiple premium details such as the interim targets for gold and mining stocks that could be reached in the next few weeks. We invite you to subscribe now and read today’s issue right away.
Sincerely,
Przemyslaw Radomski, CFA
Founder, Editor-in-chief


Gold Investment News
Delivered To Your Inbox
Free Of Charge
Bonus: A week of free access to Gold & Silver StockPickers.
Gold Alerts
More-
Status
New 2024 Lows in Miners, New Highs in The USD Index
January 17, 2024, 12:19 PM -
Status
Soaring USD is SO Unsurprising – And SO Full of Implications
January 16, 2024, 8:40 AM -
Status
Rare Opportunity in Rare Earth Minerals?
January 15, 2024, 2:06 PM

