
tools spotlight

-
Not All Markets Share the S&P 500’s Enthusiasm
October 31, 2022, 9:55 AMWhile the S&P 500 reached new monthly highs, gold, silver, and mining stocks took the opposite direction. Is it just a temporary situation?
While the S&P 500 continued its squeeze higher on Oct. 28, the short covering has morphed into another bout of FOMO. However, while stock investors assume that a dovish pivot is on the horizon, operating in a vacuum should prove painful for the bulls.
For example, gold, silver, and mining stocks declined on Oct. 28, as the PMs did not share the S&P 500’s enthusiasm. Furthermore, the USD Index rose slightly, and the U.S. 10-Year Treasury yield closed back above 4%. Likewise, the futures market has priced in a peak U.S. federal funds rate (FFR) of 4.90% in May 2023.
As a result, the bond, FX, commodity, and futures markets are not buying the S&P 500’s pivot prediction.
Please see below:
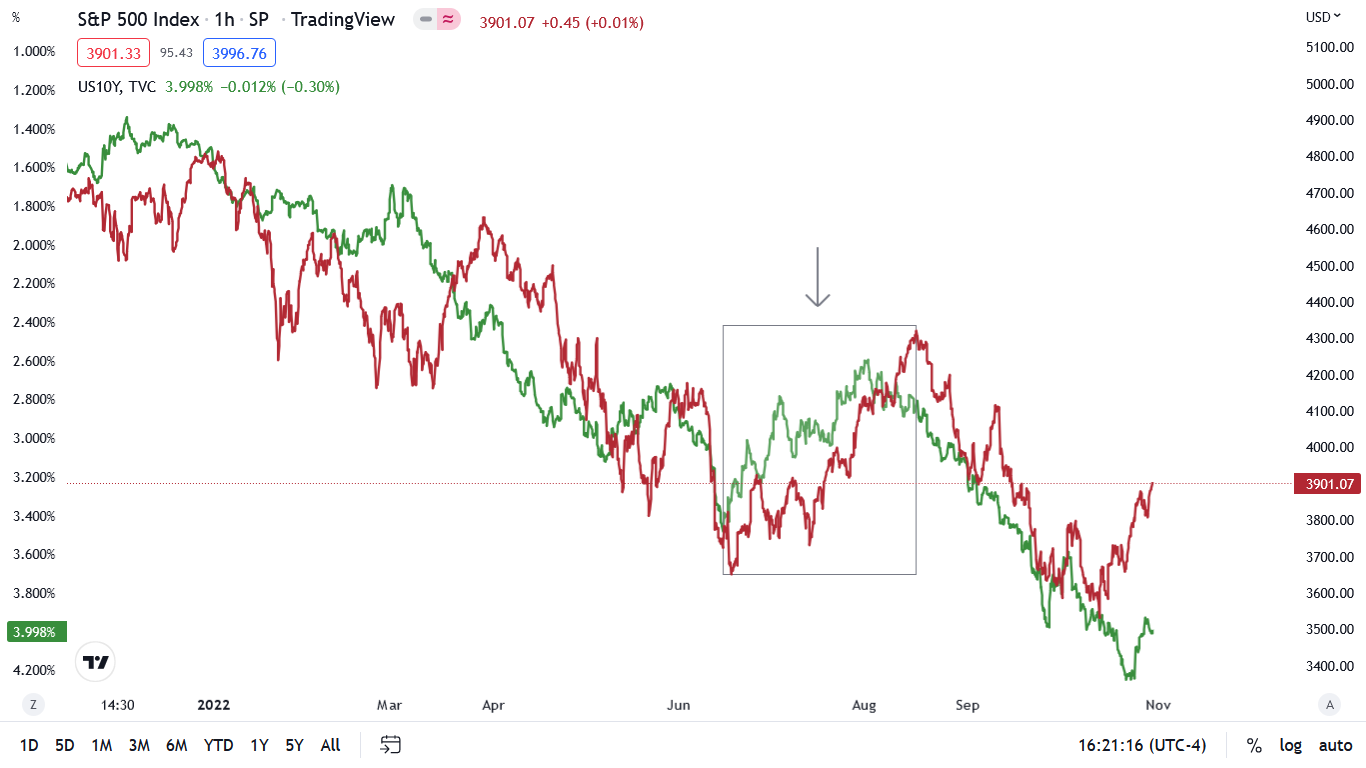
To explain, the red line above tracks the one-hour movement of the S&P 500, while the green line above tracks the inverted (down means up) one-hour movement of the U.S. 10-Year Treasury yield. As you can see, higher interest rates have weighed on the S&P 500 in 2022.
Moreover, the box with the arrow shows how a sharp decline in the U.S. 10-Year Treasury yield (green line rising) helped underwrite the S&P 500’s June to August rally. However, if you analyze the right side of the chart, you can see that the U.S. 10-Year Treasury yield’s recent pullback was relatively small.
Also, with the Treasury benchmark rising on Oct. 28, bond investors are not positioning for a pivot.
In addition, sentiment is an important component; and when CNN’s Fear & Greed Index highlighted investors’ anxiety, I warned on Oct. 5 that depressed sentiment supported a bear market rally. I wrote:
Because asset prices don’t move in a straight line, countertrend moves are an unfortunate byproduct of medium-term investing. So while the GDXJ ETF’s recent uprising is far from fun, bear market rallies are commonplace along the journey to a final low (…).
CNN’s Fear & Greed Index hit abnormally low levels, which signaled extreme fear in the financial markets.
Please see below:
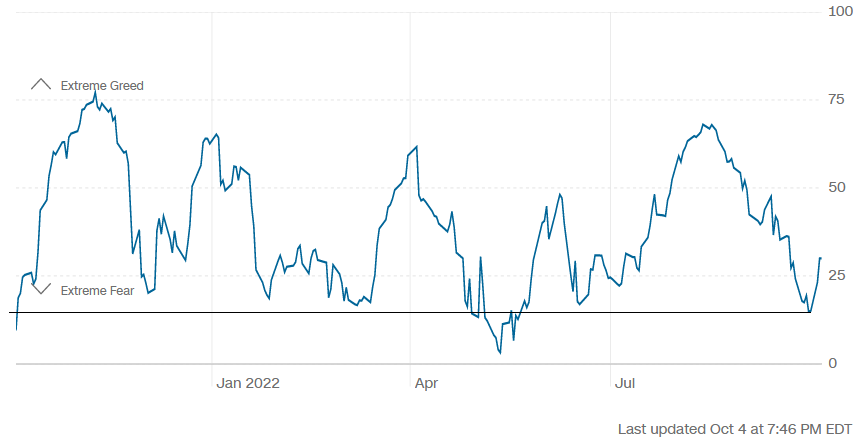 Source: CNN
To explain, the blue line above tracks CNN’s Fear & Greed Index. If you analyze the horizontal black line, you can see that the index ended September at its lowest level since May. Thus, over-positioning helped fuel the S&P 500’s squeeze higher.
However, with the metric now at one of its highest levels in 2022, fear has turned into greed, and sentiment has flipped from bullish to bearish.
Please see below:
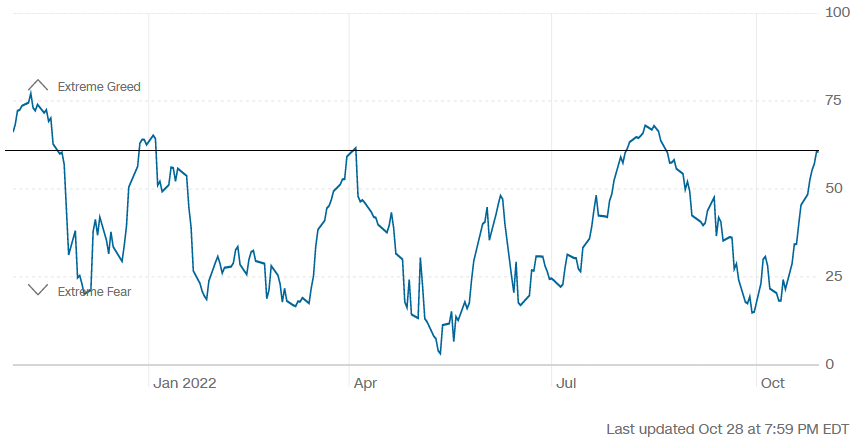
To explain, the horizontal black line above shows that CNN’s Fear & Greed Index is only one and seven points away from its April and August 2022 peaks. Moreover, these were the highest readings since the 2022 bear market took shape.
As a result, while the S&P 500 may not turn on a dime, the bear market rally is long in the tooth and a medium-term reversal should weigh heavily on gold, silver and mining stocks.
Data-Driven Decisions
While narratives are entertaining, the data determines the direction of the fundamentals; and with more hawkish economic releases hitting the wire in recent days, the results are bullish for the FFR, real yields, and the USD Index.
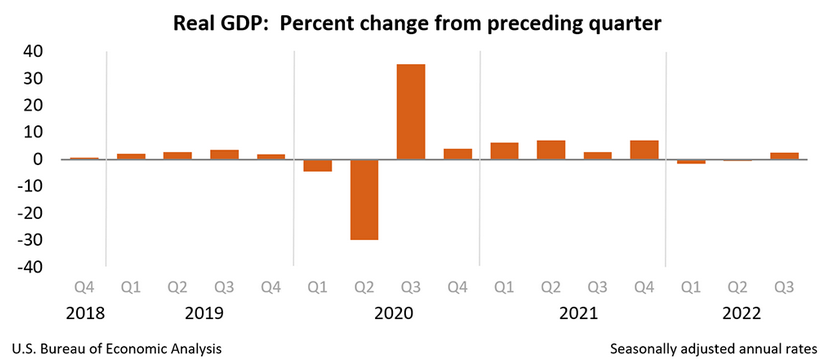
For example, the U.S. Bureau of Economic Analysis (BEA) released its advanced estimate of Q3 real GDP growth on Oct. 27. The report revealed:
Real GDP “increased at an annual rate of 2.6 percent in the third quarter of 2022,” which “reflected increases in exports, consumer spending, nonresidential fixed investment, federal government spending, and state and local government spending, that were partly offset by decreases in residential fixed investment and private inventory investment.”
As such, while the recession crowd has grown confident in recent months, unanchored inflation and resilient growth should keep the Fed’s foot on the hawkish accelerator.
Please see below:
Likewise, with Americans’ spending behavior continuing to outperform, we haven’t reached the demand destruction required to warrant a dovish pivot.
Please see below:
 Source: Investing.com
 To explain, the BEA revealed on Oct. 28 that personal income increased by 0.4% month-over-month (MoM) in September, which exceeded the consensus estimate. More importantly, personal spending increased by 0.6% MoM, which highlights Americans' ability and willingness to splurge. Thus, I've warned repeatedly that the Fed's inflation fight will be one of attrition.
To that point, the BEA also revealed on Oct. 28 that the headline PCE Index increased from 6.22% year-over-year (YoY) in August to 6.24% YoY in September, while the core PCE Index increased from 4.89% YoY in August to 5.15% YoY in September.
Please see below:
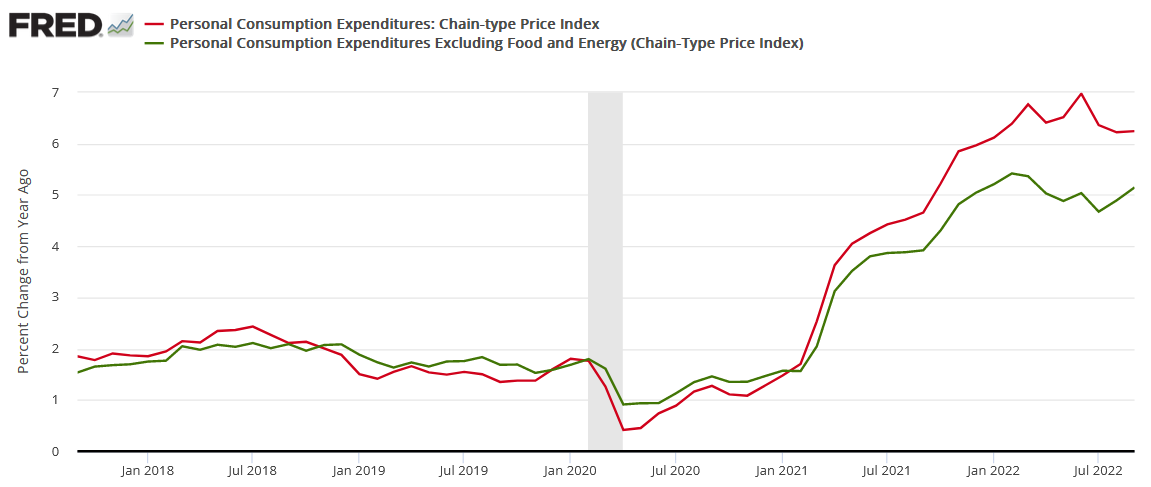
To explain, the red and green lines above track the YoY percentage changes in the headline and core PCE Indexes. For context, the latter excludes the inflationary impacts of food and energy, but it’s a better indicator of consumer inflation, and the metric has increased YoY for the last two months.
Therefore, the crowd doesn’t realize that bullish corporate earnings (outside of Big Tech) are also bullish for the FFR. In a nutshell: when corporate prints are resilient, demand allows companies to pass on higher input costs, which stokes inflation. As such, what’s perceived as constructive is actually destructive. To explain, I wrote on Oct. 18:
Narratives don't create recessions, and the important point is that the longer consumer spending remains elevated, the higher the FFR will need to rise; and while investor sentiment was boosted by short-covering and resilient corporate earnings, the latter's strength is bearish because it means the Fed has much more work to do.
So, while the crowd may celebrate that earnings have 'held up,' the reality is that the longer they remain durable, the longer inflation will persist.
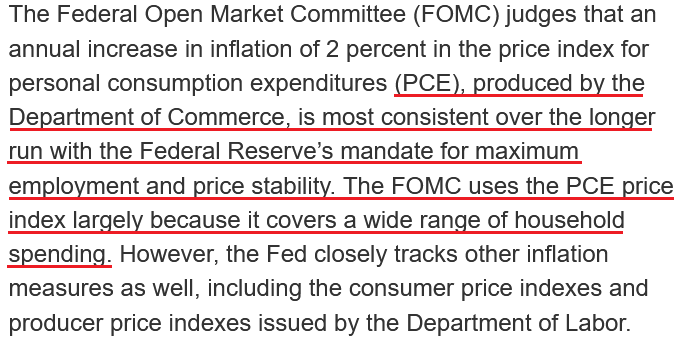
In addition, while the Consumer Price Index (CPI) garners all of investors' attention, please remember that the PCE Index is the Fed's preferred inflation gauge; and with the headline and core metrics increasing YoY in September, nothing in the data supports a pivot.
Please see below:
 Source: U.S. Fed
Finally, Indeed released its latest U.S. labor market update on Oct. 27. The report revealed:
“The U.S, labor market remains hot. As the U.S. economy bounces back from the initial COVID-19 shock, demand for labor has grown much more quickly than supply. Employment has rebounded, wages are growing quickly, and joblessness is approaching pre-pandemic levels. The labor market is, however, showing some signs of normalizing, particularly as demand for workers cools….
“As of October 21, 2022, job postings on Indeed were 48.8% above their pre-pandemic baseline. New job postings, defined as those on Indeed for seven days or less, are also well above their pre-pandemic baseline, up 55%. While job posting growth has slowed, the leveling out has been relatively moderate.”
Please see below:
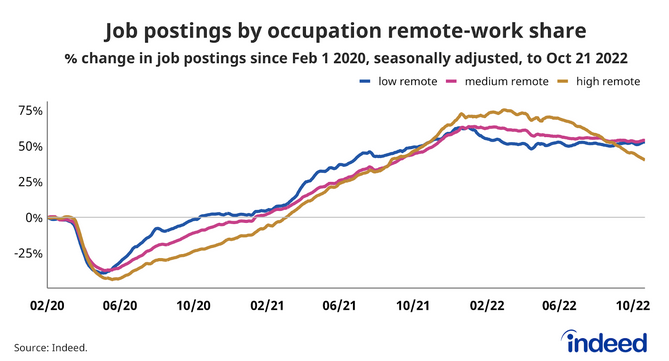
To explain, the blue, pink, and brown lines above track the percentage change in job postings for low, medium, and highly remote positions. If you analyze the movement of the brown line, you can see that highly remote opportunities have fallen somewhat materially. However, these are predominantly work-from-home listings in sectors that benefited from the pandemic.
In contrast, the blue and pink lines have barely budged, which highlights how employment opportunities for in-person roles remain resilient despite the Fed’s 12 25 basis point rate hikes in 2022. As a result, demand has not normalized, and the FFR needs to go much higher to curb inflation.
 Source: Indeed
Technically Speaking
Gold declined visibly on Friday, but the decline in silver and mining stocks was less visible. Why is that so? It’s quite obvious if you focus on what happened in the main stock indices.
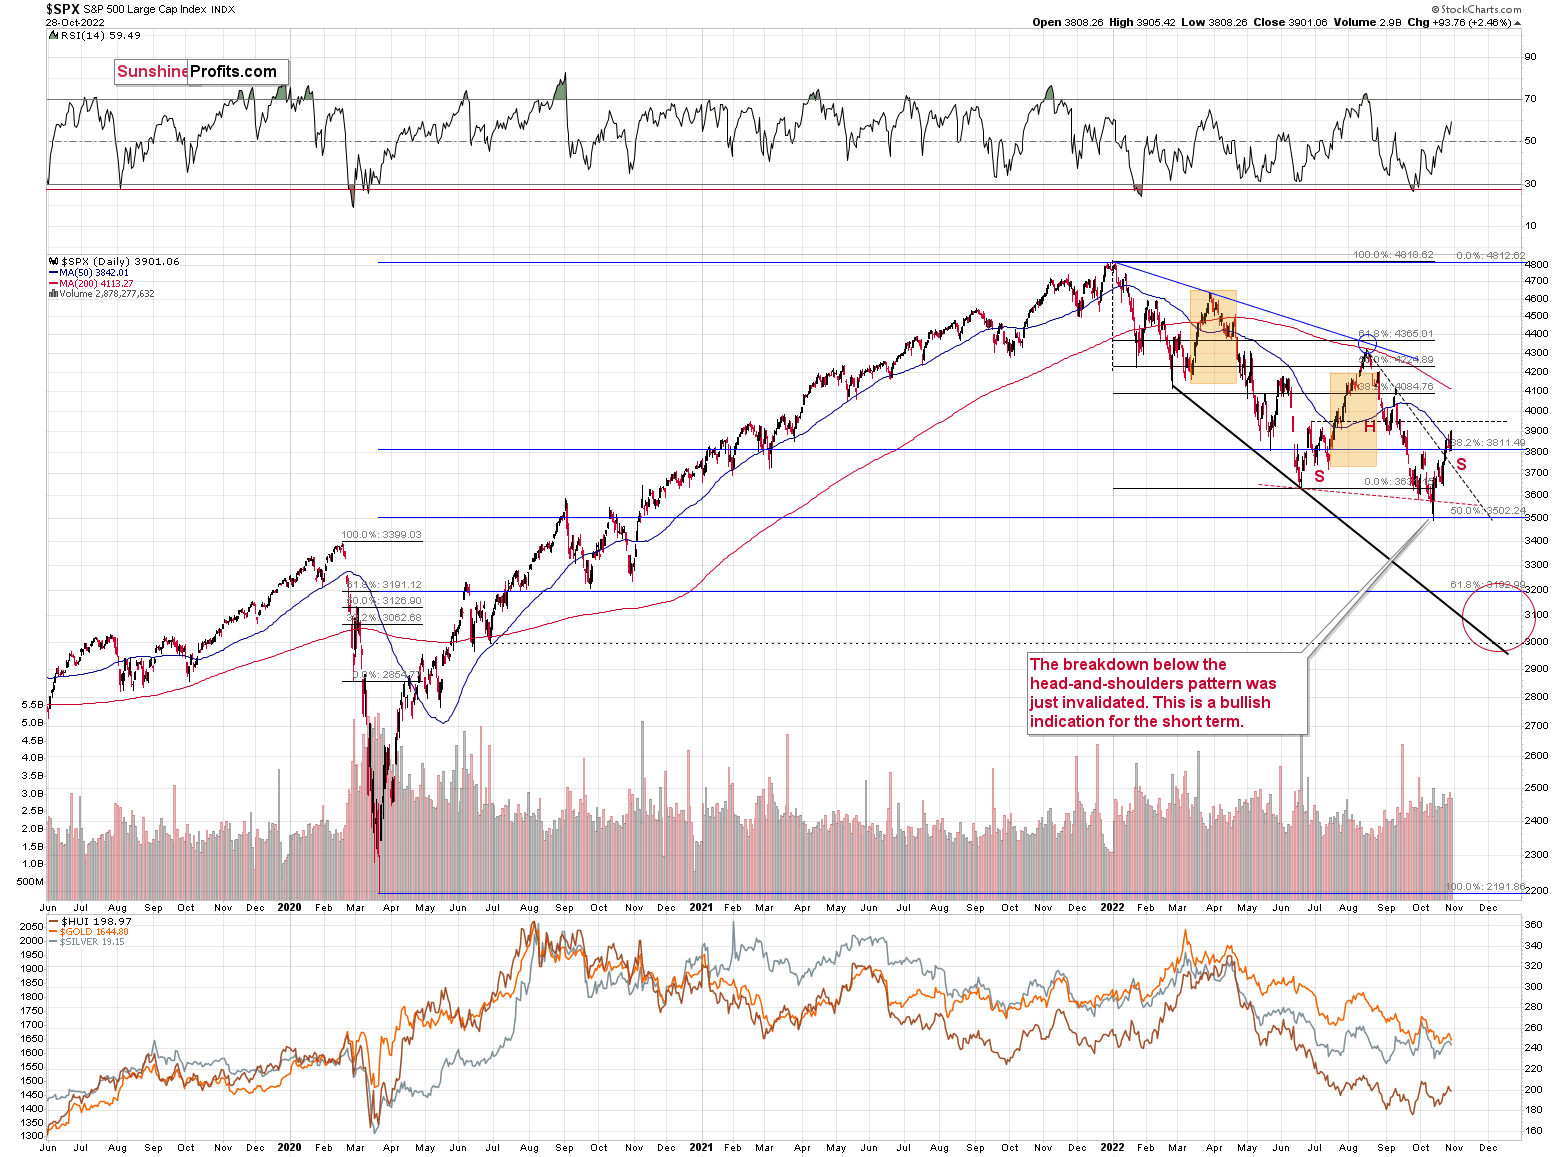
The S&P 500 rallied to new monthly highs, which caught investors’ eyes. However, as the index didn’t move above its June 2022 high, the head and shoulders formation could still be completed.
Consequently, nothing really changed based on Friday’s session, and what I wrote in Friday’s extensive analysis remains up-to-date.
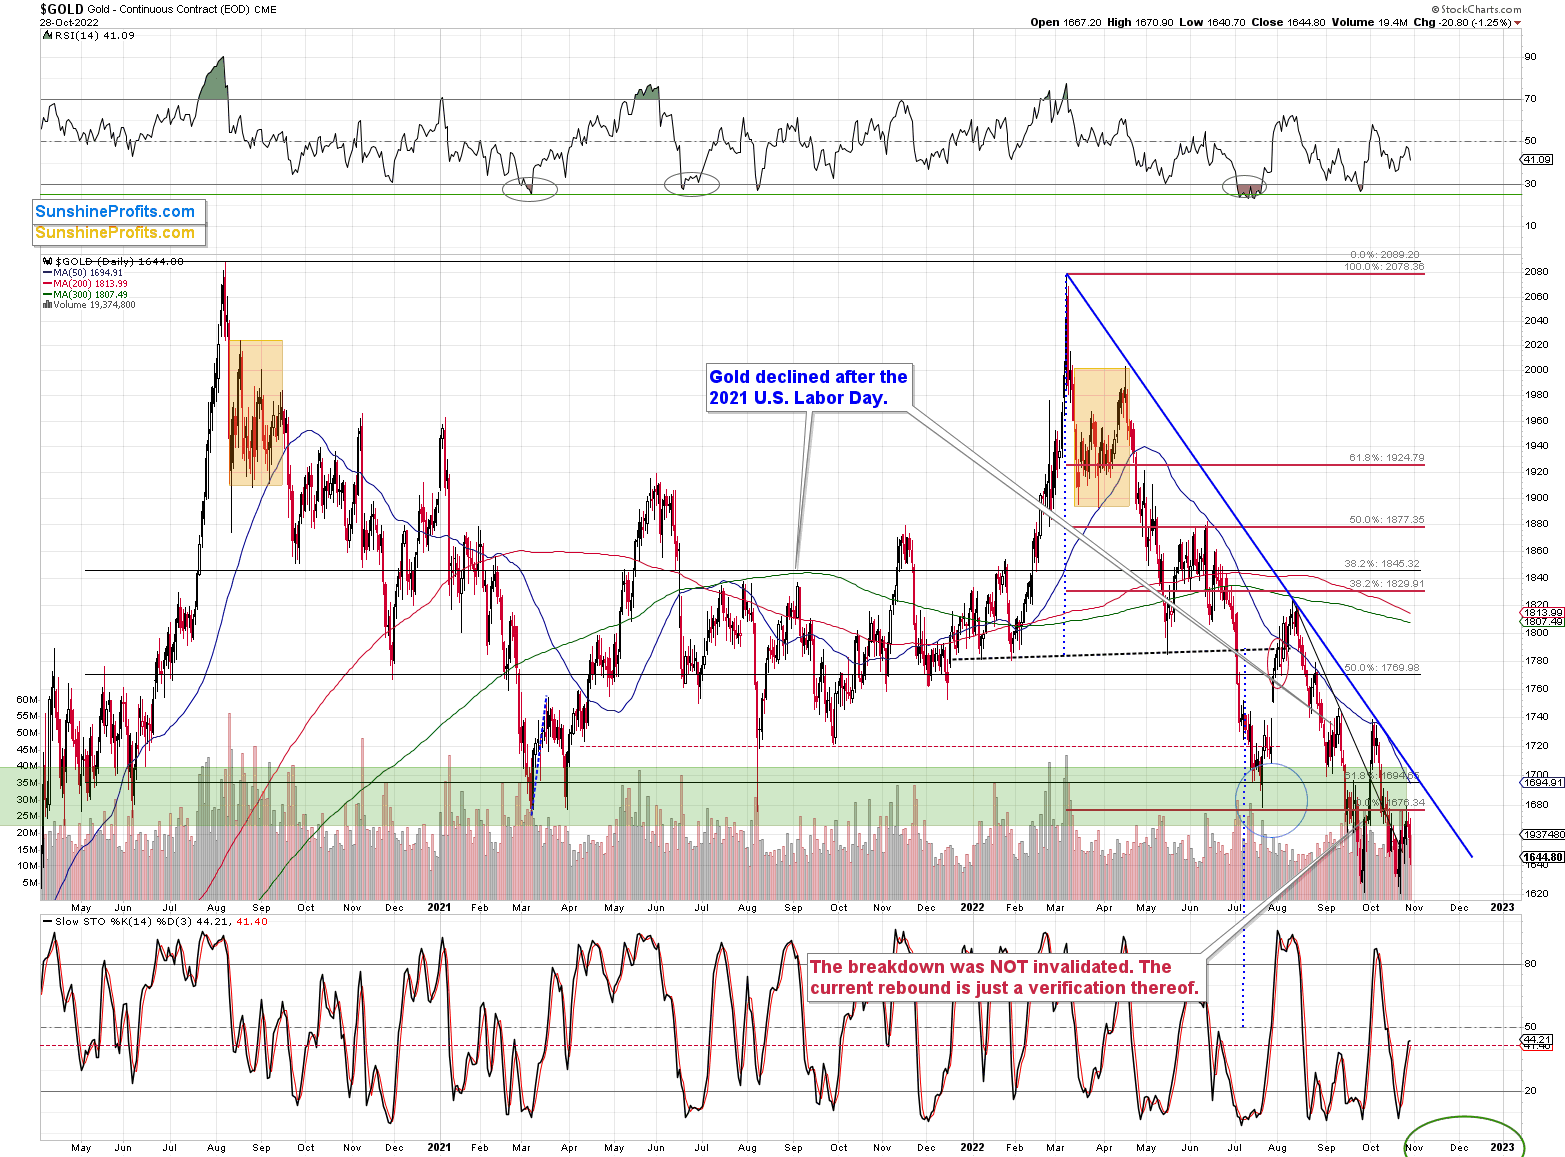
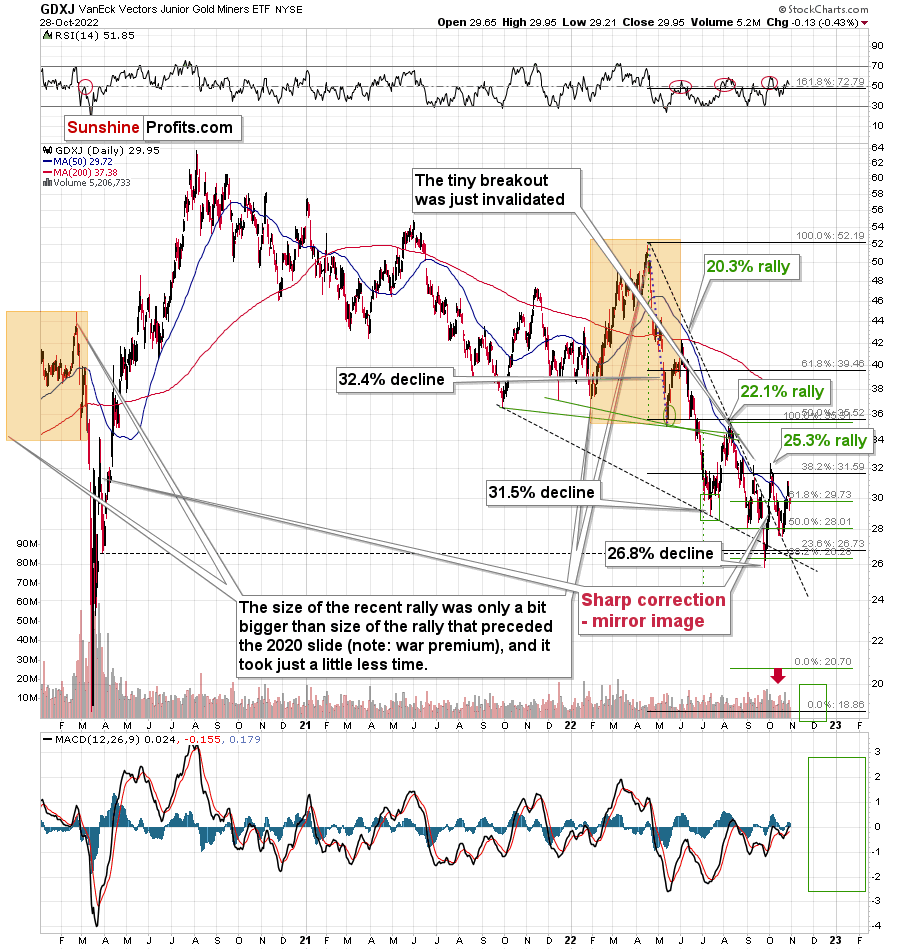
Gold is now relatively close to its 2022 lows, while junior miners are not, and it’s most likely due to the stock market’s recent strength.
Can this positive impact from stocks remain intact? It can, but it’s highly unlikely. The increasing real rates are simply strongly bearish, and for the above to happen, two things need to take place at the same time:
- Stocks would have to continue to rally in the following weeks / months.
- The relatively strong impact that stocks recently had on the junior miners’ performance would have to persist for longer.
Both are unlikely.
Starting with the latter, gold is ultimately a much more important price driver for junior miners than stocks are. After all, gold is the only current or expected source of revenue (thus profits) in the future.
As for the former, the rally is likely to be reversed, as I explained many times. For example, that’s what the world stock ($MSWORLD) index very strongly implies (you will find its analysis in Friday’s Gold & Silver Trading Alert).
The Bottom Line
While the stock market heads in one direction, the bond, FX, commodity, and futures markets have headed in another. Moreover, with employment still resilient and inflation highly problematic, the prospect of a pivot is more semblance than substance. Therefore, while the Fed could pull a Bank of Canada (BoC) and surprise with 50 basis points on Nov. 2 (though, unlikely), the FFR’s peak is much more important than what happens at any single meeting. Thus, the stock bulls should learn this lesson the hard way over the medium term.
In conclusion, the PMs declined on Oct. 28, as the S&P 500’s bullish price action contrasted the moves in other markets. So, while the USD Index and the U.S. 10-Year real yield have largely been in consolidation mode, it’s normal for a cooling-off period to occur after such strong rallies. However, we expect the pair to hit higher highs in the months ahead, and a realization should culminate with lower lows for gold, silver, mining stocks and the S&P 500.
Thank you for reading our free analysis today. Please note that the above is just a small fraction of the full analyses that our subscribers enjoy on a regular basis. They include multiple premium details such as the interim targets for gold and mining stocks that could be reached in the next few weeks. We invite you to subscribe now and read today’s issue right away.
Sincerely,
Przemyslaw Radomski, CFA
Founder, Editor-in-chief -
The Gold Market: Where a Lot Happens but Not Much Changes
October 28, 2022, 9:23 AMAvailable to premium subscribers only.
Thank you for reading our free analysis today. Please note that the above is just a small fraction of the full analyses that our subscribers enjoy on a regular basis. They include multiple premium details such as the interim targets for gold and mining stocks that could be reached in the next few weeks. We invite you to subscribe now and read today’s issue right away.
Sincerely,
Przemyslaw Radomski, CFA
Founder, Editor-in-chief -
Relatively Dovish Bank of Canada Depressed the Dollar
October 27, 2022, 9:11 AMThe cautious decision of the BoC to raise interest rates helped precious metals rise, worsening the USD’s situation. When will investors’ sentiment change?
While weak earnings from Microsoft and Alphabet (Google) sunk the S&P 500 by 0.74% on Oct. 26, gold rallied by 0.68%, silver by 0.71%, the GDX ETF by 2.95% and the GDXJ ETF by 3.05%.
In addition, the USD Index fell by 1.15% and the U.S. 10-Year real yield rose by one basis point. As a result, while false narratives helped uplift the PMs and depress the dollar basket, 2022 has been full of countertrend moves that ended in disappointment for the risk-on crowd.
Profitless Narratives
With ZeroHedge known to exaggerate meltdown and melt-up scenarios, concern has arisen over the potential for a sharp rise or fall in U.S. Treasury yields. One the one hand, Mark Cabana, Head of U.S. Rates Strategy at Bank of America, warned that a midterm victory for the Democrats could propel interest rates substantially higher. Moreover, the “forced selling” could elicit more “stress” in the bond market.
On the other hand, whispers have grown louder about a potential “intervention” in the U.S. Treasury market, which could elicit and rally in bonds and reduce interest rates. In a nutshell: a Fed pivot is on the horizon.
However, please remember that ZeroHedge is a quasi-news organization whose goal is to increase the number of clicks on its website. Therefore, much of the information on ZeroHedge is spun in a way that generates attention but doesn’t reflect fundamental reality. To explain, I wrote on May 25:
With inflation rivaling the 1970s, still increasing month-over-month (MoM), and U.S consumers still eager to spend, a third category of investors enter the equation: the hyper-inflationists. For context, they resemble permabears, but the idea is that the Fed can't stomach a recession, so officials will let inflation rage.
Please see below:
…. A decade of dovish pivots has a generation of investors believing that the central bank is all talk and no action. However, with inflation at levels unseen in 40+ years, Powell is not out of ammunition, and the Fed pivot crowd should suffer profound disappointment as the drama unfolds.
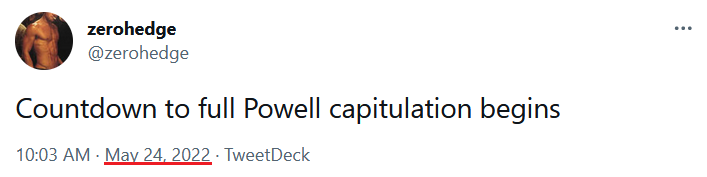
Thus, while ZeroHedge has been screaming about a pivot for many months, positioning for “Powell capitulation” would have resulted in substantial losses.
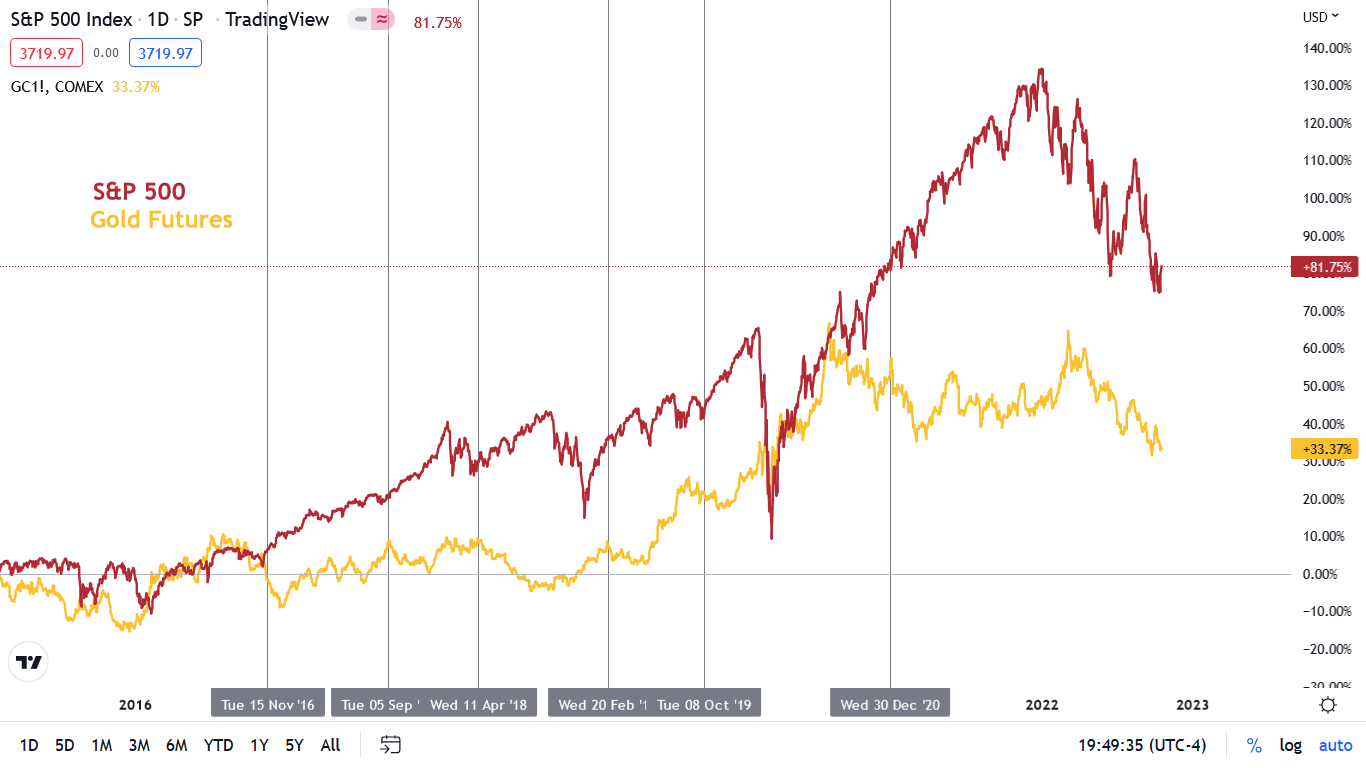
Please see below:
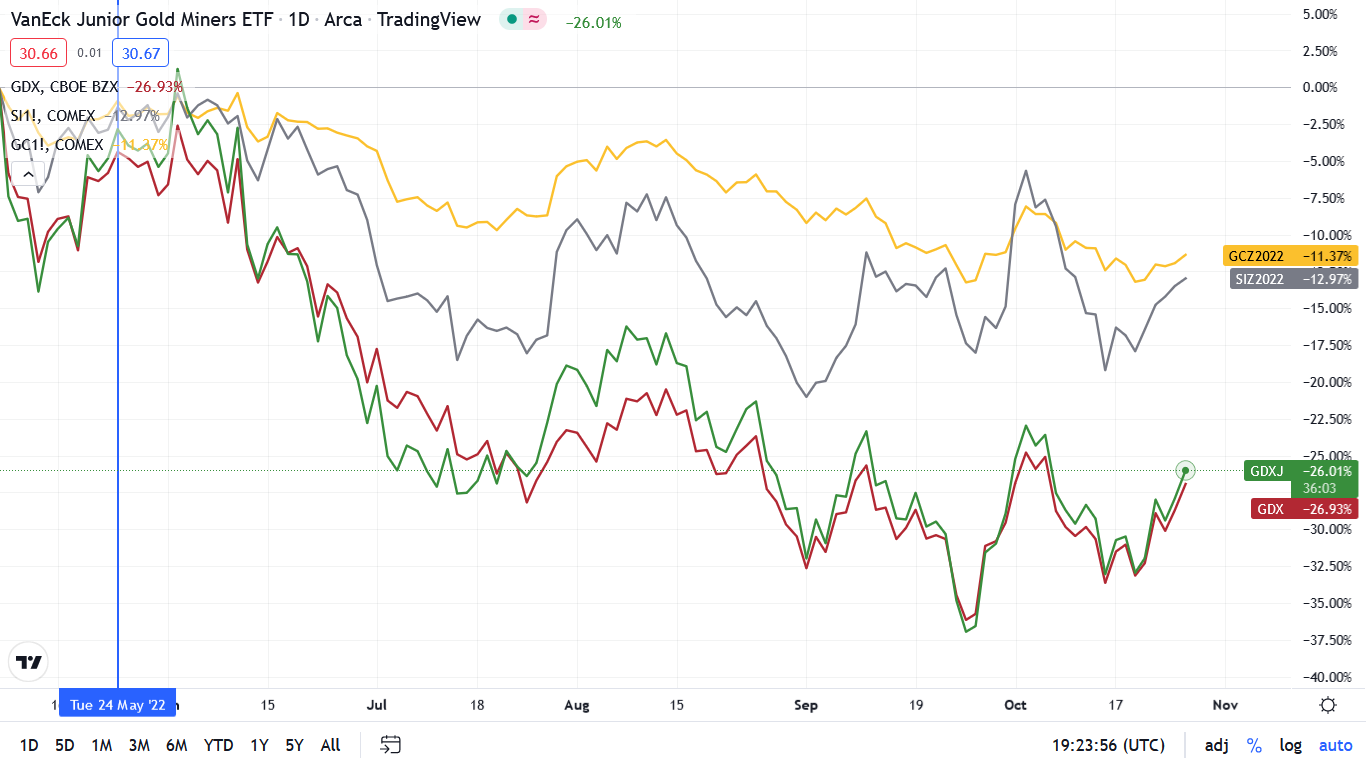
To explain, the gold, silver, red and green lines above track the performance of gold futures, silver futures, the GDX ETF and the GDXJ ETF. As you can see, the PMs have declined materially since ZeroHedge’s May 24th tweet, and mining stocks are down by more than 20%. As a result, please remember that while ZeroHedge’s articles are entertaining, they won’t make you any money.
To that point, following ZeroHedge has been the quickest way to the poor house in 2022. For example:
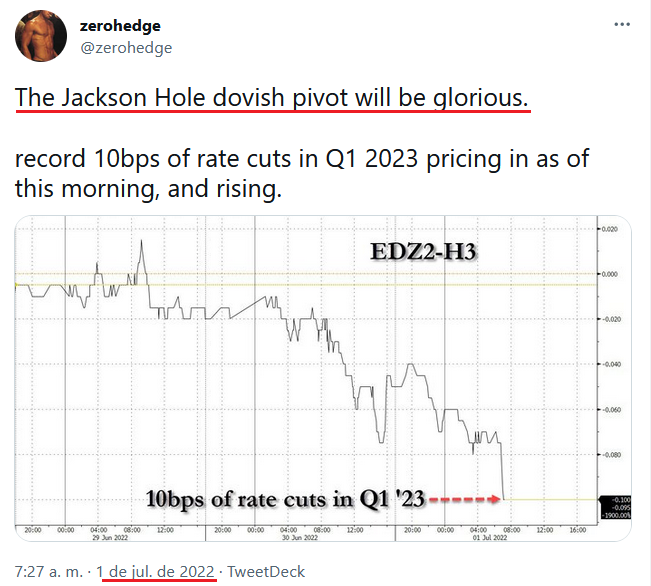
More importantly:
 Source: ZeroHedge
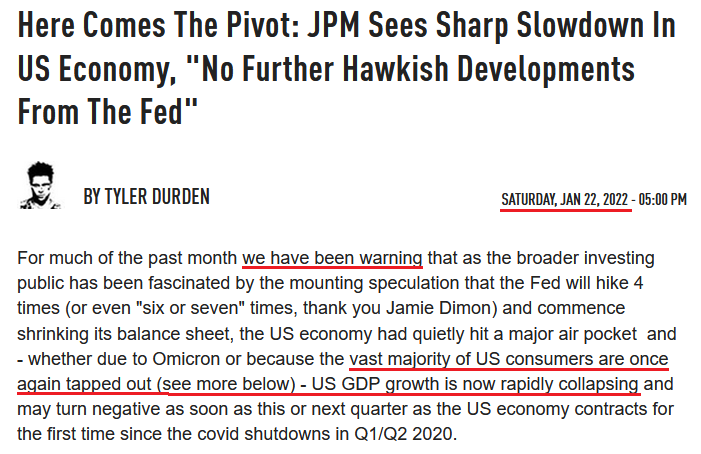
So while ZeroHedge has amplified the false pivot narrative for much of 2022, imagine if you had bought the PMs in January. You would have suffered major losses.
Furthermore, while the site proclaimed that “U.S. GDP growth is now rapidly collapsing” in January, it’s been several months and the Atlanta Fed raised its Q3 real GDP estimate to 3.1% on Oct. 26. Thus, it’s prudent to pay less attention to narratives and more attention to the data
Please see below:
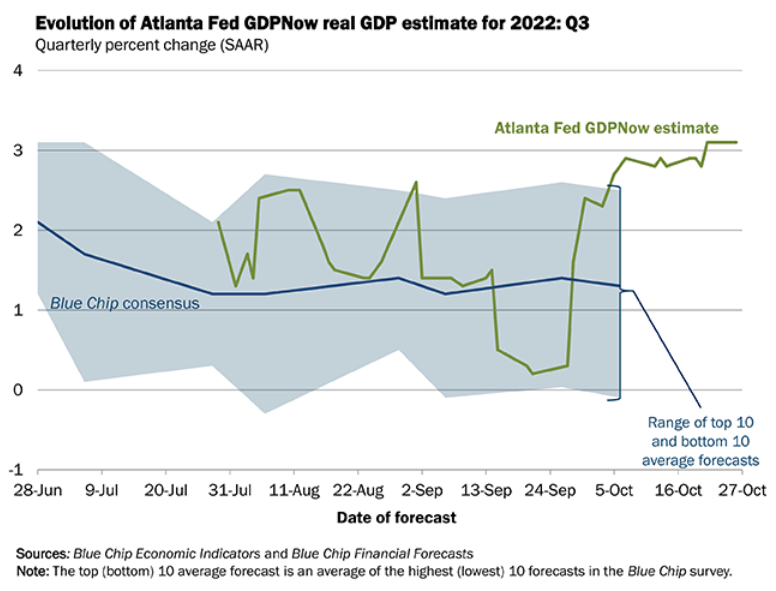
To explain, the green line above tracks the Atlanta Fed’s Q3 real GDP growth estimate, while the blue line above tracks the Blue Chip Consensus estimate (investment banks). If you analyze the right side of the chart, you can see that the green line hit a new projection high on Oct. 26. As such, ZeroHedge was, and still is, early in its doomsday prediction.
Turning to Cabana, he also has a history of perpetuating narratives that don’t come to fruition. To explain, I wrote on Oct. 4:
With tales of Treasury market illiquidity resurfacing – which could force the Fed to intervene to avoid a crash in bond prices – it’s important not to assign credibility to individuals that constantly sound the same alarm. Remember, it’s like The Boy Who Cried Wolf. They recycle the same warning, while the wolf only arrives 1% of the time.
Please see below:
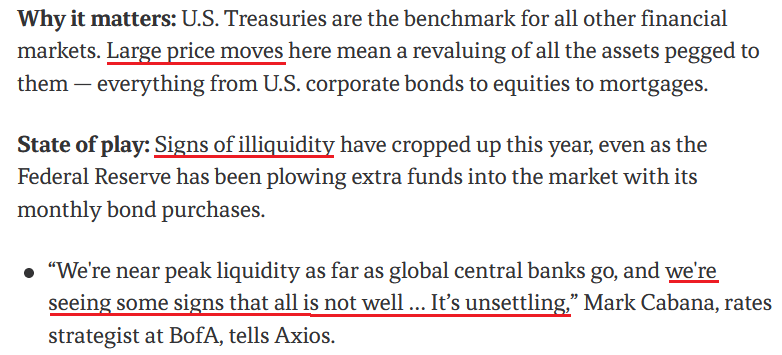 Source: Axios
To explain, the screenshot above is from an article written on Nov. 17, 2021. Here is the link if you want to read it: https://www.axios.com/2021/11/17/treasury-market-stress-signs-regulators
As you can see, Cabana said the same thing nearly a year ago. Moreover, the U.S. 10-Year Treasury yield ended the Nov. 17, 2021 session at 1.59%, while the GDXJ ETF closed at $47.38. So if you positioned for Cabana's warning back then, you would have lost a lot of money buying the U.S. 10-Year Treasury Note and the junior miners' index.
All in all, the moral of the story is to scrutinize where the information comes from; and while ZeroHedge has useful data, its analysis is biased. Therefore, if you take its conclusions at face value, you may be disappointed with the results.
What’s Wrong With the USD Index?
With the USD Index declining sharply on Oct. 26, the dollar basket has suffered in recent days. Furthermore, with risk-on currencies like the EUR, the GBP and the CAD rallying, the greenback has hit a rough patch.
But while the weakness is bullish for gold, silver and mining stocks, the underperformance is unlikely to last. For example, the Bank of Canada (BoC) raised its overnight lending rate by 50 basis points on Oct. 26. Now, the move was relatively dovish, as market participants largely expected a 75 basis point rate hike.
Likewise, with the BoC and the Fed often following in each other’s footsteps, the odds of a 75 basis point rate hike by the latter in December retreated on Oct. 26:
Please see below:
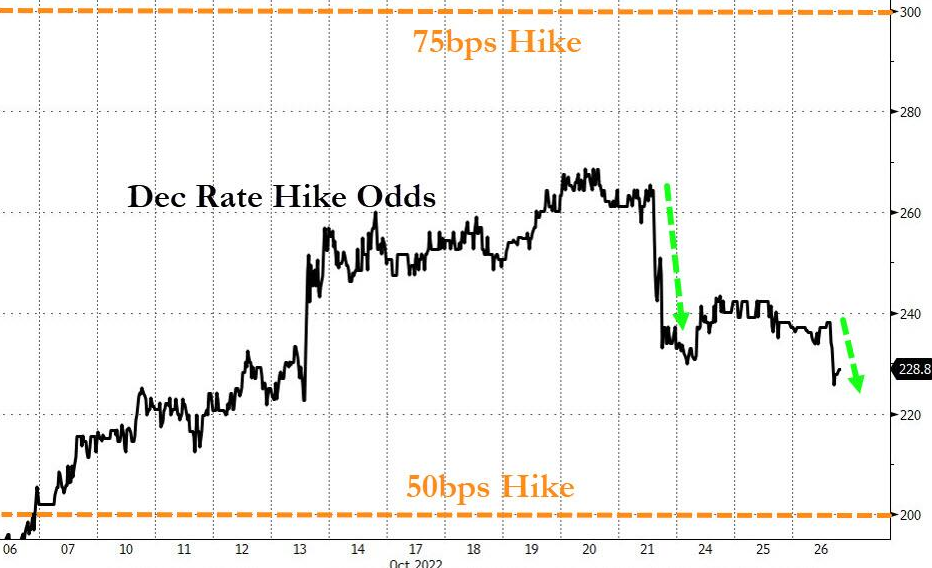 Source: Bloomberg/ZeroHedge
However, the BoC’s official statement read:
“Given elevated inflation and inflation expectations, as well as ongoing demand pressures in the economy, the Governing Council expects that the policy interest rate will need to rise further.”
Yet, BoC Governor Tiff Macklem (Canada’s Jerome Powell) said during his press conference:
“If we don’t do enough, Canadians will continue to endure the hardship of high inflation; and they will come to expect persistently high inflation, which will require much higher interest rates and potentially a severe recession to control inflation. Nobody wants that.
“If we do too much, we could slow the economy more than needed; and we know that has harmful consequences for people’s ability to service their debts, for their jobs and for their businesses.
“This tightening phase will draw to a close. We are getting closer, but we are not there yet.”
Thus, the last statement was music to the bulls' ears. With Macklem hinting that the BoC is "getting closer" to the end of its rate hike cycle, the crowd surmised that the Fed could be on a similar path. As a result, the buy bonds, sell the dollar trade materialized on Oct. 26, as pivot hopes intensified.
However, the BoC made a mistake. With the central bank essentially green-lighting a risk rally, the error will only cause more inflationary problems in the months ahead. As such, the BoC wants to rein in inflation without slowing the Canadian economy "more than needed."
In reality, the prospect is unrealistic and is doomed to fail. To quell inflation, the BoC needs to commit to higher interest rates, as a half-hearted attempt will lead the central bank to fail at both initiatives. So while the Fed may attempt a similar feat, it will only lead to more problems down the road. Overall, the BoC essentially performed a "transitory" part two on Oct. 26.
To that point, while the developments were bearish for the USD Index, support could be around the corner.
Please see below:
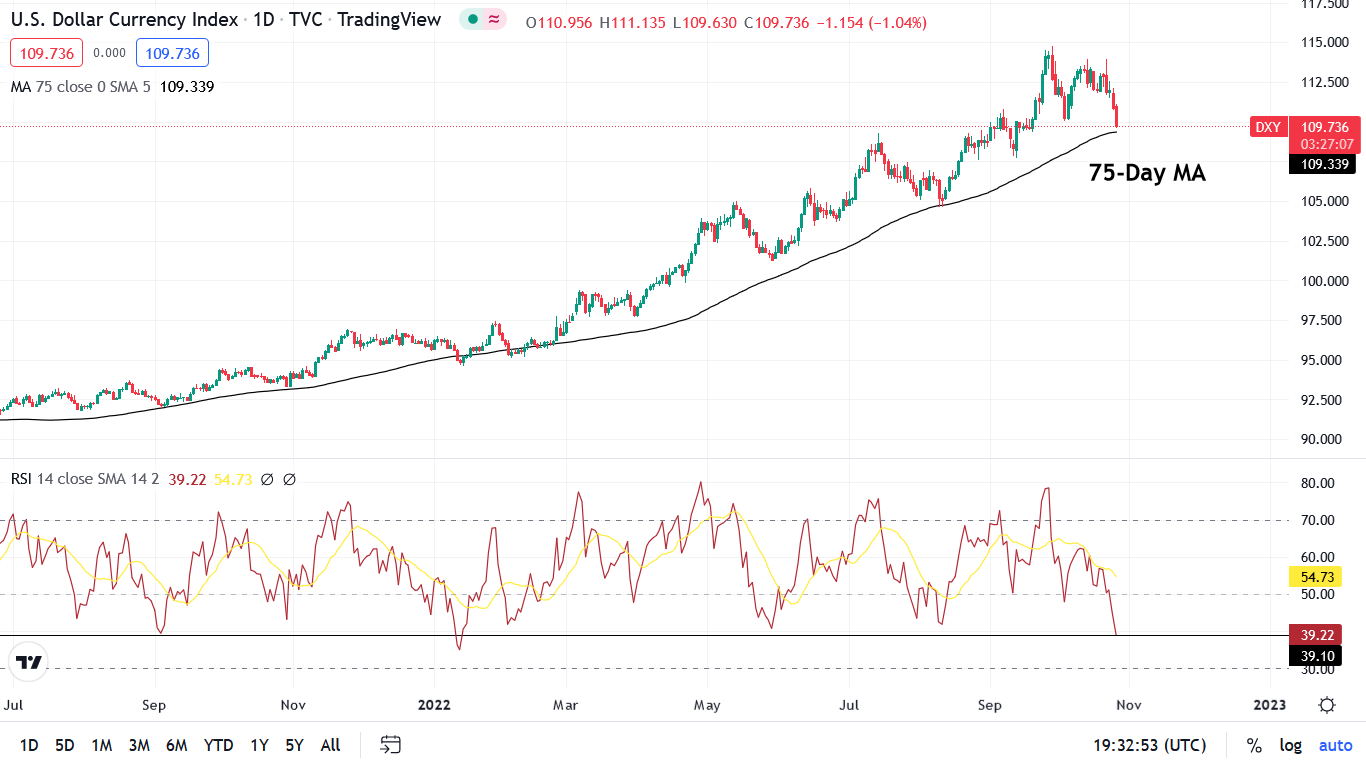
To explain, the candlestick chart above tracks the USD Index, while the black line at the top tracks its 75-day moving average. If you analyze the relationship, you can see that the 75-day MA has provided material support for the last ~16 months. Likewise, it roughly marked the bottom during the July/August pullback.
As a result, with the level fast approaching, it should help the greenback regain its footing. In addition, the USD Index’s daily RSI (the red line at the bottom) is near the levels that coincided with reversals over the last ~16 months. Thus, we may witness a comeback sooner rather than later.
Also noteworthy, Europe and Britain face worse growth-inflation dynamics than the U.S., so while sentiment has shifted, the fundamentals support a weaker EUR/USD and GBP/USD; and with Japan still implementing QE to suppress interest rates, the USD/JPY should have more upside. Therefore, the fundamentals support a stronger USD Index in the months ahead.
The Bottom Line
While gold, silver and mining stocks rallied on Oct. 26, investors are following the same losing playbook that has plagued them throughout 2022. Each time a dovish pivot is anticipated, the crowd believes the worst is in the rearview. However, you can’t reverse engineer a stable economy. With inflation still unanchored, a deceleration in rate hikes only makes a bad situation worse. So while investors may assume that cautious central banks are bullish, they’ll realize later that the policy stances create more problems than they solve.
Remember, when the Fed and the BoC called inflation “transitory” in 2021, investors happily bought into the narrative. Yet, that decision wasn’t so wise when the bear market arrived in 2022. As such, we see this as another iteration of the same mistake, and expect gold, silver and mining stocks to hit lower lows before long-term buying opportunities emerge.
In conclusion, the PMs rallied on Oct. 26, as the BoC helped uplift sentiment. However, while the USD Index often suffers when false narratives occur, it has pulled back and then ascended to new highs several times in 2022. As a result, a similar outcome should occur over the medium term.
Thank you for reading our free analysis today. Please note that the above is just a small fraction of the full analyses that our subscribers enjoy on a regular basis. They include multiple premium details such as the interim targets for gold and mining stocks that could be reached in the next few weeks. We invite you to subscribe now and read today’s issue right away.
Sincerely,
Przemyslaw Radomski, CFA
Founder, Editor-in-chief -
How Quickly Will Gold and the USD Change Roles Again?
October 26, 2022, 8:09 AMOptimism influenced precious metals, but despite favorable conditions, their rallies were not impressive. What does that mean for the medium term?
The S&P 500 was in rally mode on Oct. 25, as the index jumped by 1.63%; and joining the festivities, gold increased by 0.24%, silver by 0.83%, the GDX ETF by 2.01% and the GDXJ ETF by 2.12%.
In contrast, the USD Index declined by 0.96% and the U.S. 10-Year real yield dropped by seven basis points. However, while the price action created the perfect environment for the PMs, their rallies were relatively uninspiring. Furthermore, with the optimism unlikely to last, a reversal of fortunes should be on the horizon.
Can’t Squeeze Forever
With the S&P 500 continuing to squeeze higher on Oct. 25, gold, silver and mining stocks participated in the risk rally. However, I noted on Oct. 19 that while the S&P 500 confronted a bullish tactical setup, its fundamental outlook remained profoundly bearish. I wrote:
Positioning, sentiment and seasonality support a higher S&P 500, while the medium-term technicals and fundamentals are profoundly bearish. Thus, we consider any strength a bear market rally and expect the index to hit lower lows in the months ahead. However, since asset prices don't move in a straight line, the setup is tactically bullish.
So while the S&P 500 has rallied sharply in recent days, the short-covering optimism ran into resistance after hours on Oct. 25. For example, Alphabet (Google) released its third-quarter earnings after the bell; and with the online advertising giant missing analysts’ estimates on both the top and bottom lines, the fundamental realities of unanchored inflation and higher interest rates re-emerged.
Please see below:
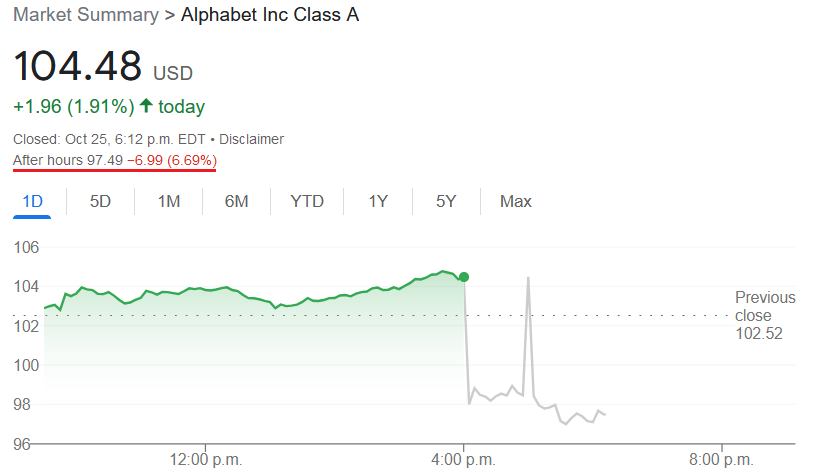 Source: Google
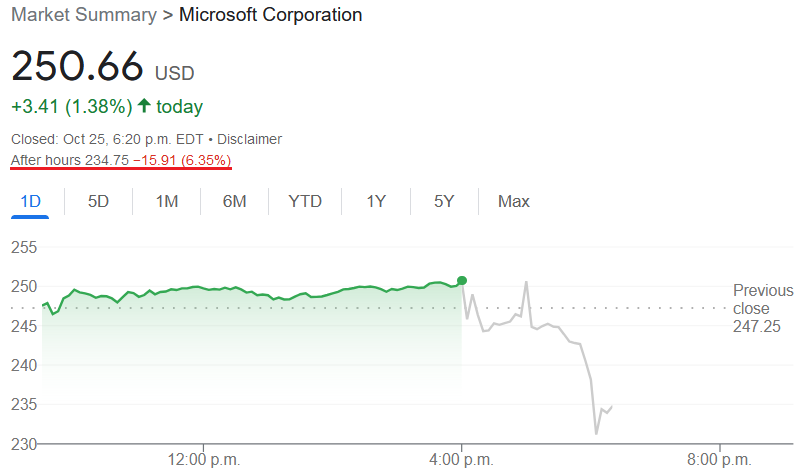
 Likewise, Microsoft also reported after the bell on Oct. 25; and while the company surpassed analysts’ quarterly estimates, frail cloud performance and weak guidance helped batter the stock after hours.
Please see below:
 Source: Google
Thus, with two of the four largest companies in the S&P 500 suffering, the squeeze may have already run its course. Moreover, while positioning is still heavily short, the index offered tactical value near 3,600, not 3,850.
In addition, with the bearish medium-term fundamentals rearing their ugly head, and the Fed poised to raise interest rates by 75 basis points next week, stocks offer a poor risk-reward proposition when the U.S. federal funds rate (FFR) should hit 4%.
Also, the PMs confront the same problem when risk-free assets offer a 4% return. As such, the Fed’s inflation fight should continue to drive money out of risk assets and into cash, and the prospect is highly bearish for the PMs.
No Pivot
After investors confused a potential slowdown in rate hikes for a dovish pivot, it’s hard to count how many times they attempted to create their own reality in 2022. However, while each iteration of optimism led to short-term rallies, they were followed by new lows for the S&P 500 and the PMs.
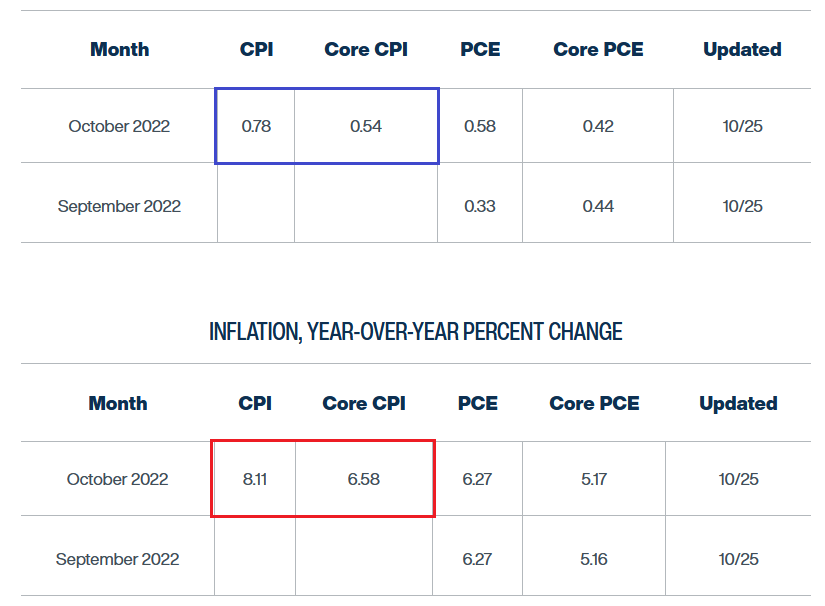
Therefore, with inflation still problematic, the Fed has yet to realize enough progress to support asset prices. For example, the Cleveland Fed updated its inflation Nowcast on Oct. 25; and with the headline and core Consumer Price Indexes (CPI) expected to increase by 8.11% and 6.58% (the red box) year-over-year (YoY) in October, we’re a long way from 2%.
Please see below:
 Source: Cleveland Fed
Furthermore, if you analyze the blue box at the top, you can see that the headline and core CPIs are projected to increase by 0.78% and 0.54% month-over-month (MoM); and if we annualize these MoM estimates, they work out to 9.77% and 6.68%, respectively. As a result, the YoY and MoM projections are far from pivot levels and highlight the stubbornness of inflation.
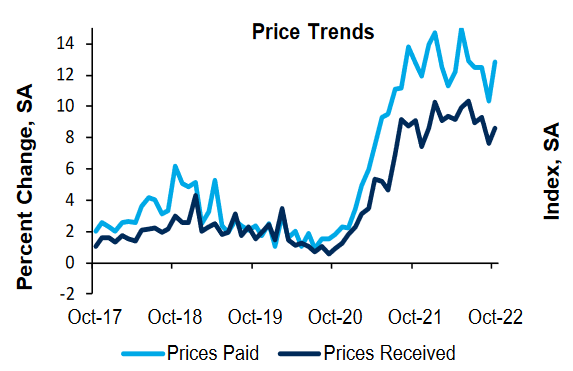
As further evidence, the Richmond Fed released its Fifth District Survey of Manufacturing Activity on Oct. 25. The headline index declined from 0 in September to -10 in October, as “two of its three component indexes deteriorated notably.”
However, while new orders and shipments suffered mightily, the report revealed that “the employment index remained unchanged at 0 in October, as hiring challenges persisted.” Thus, labor market conditions did not weaken, which is bullish for the FFR.
More importantly, the report added:
“The average growth rate of prices paid and prices received both increased again in October, after moderating in September. Expectations for both over the next 12 months also increased slightly from September.”
So while the crowd hopes that inflation will magically disappear, the reality is much different.
Please see below:
 Source: Richmond Fed
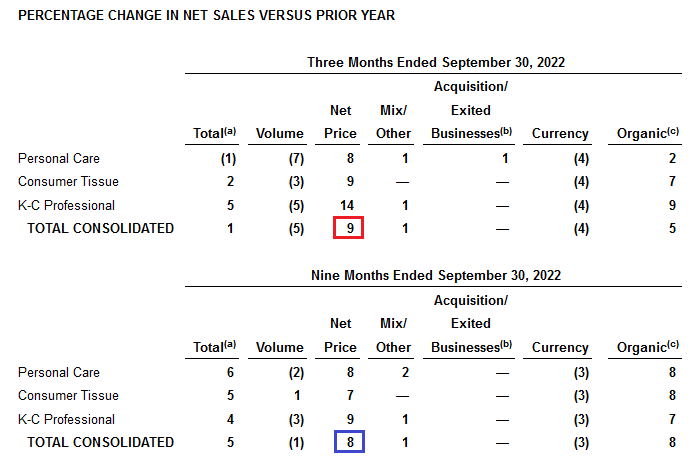
In addition, Kimberly-Clark – an American personal care company with a more than $40 billion market cap – released its third-quarter earnings on Oct. 25. CEO Mike Hsu said during the Q3 earnings call:
“We're up or even in about half of our categories, a little bit more than that in personal care; and we were very fast on pricing. We've been very decisive on pricing all year.”
CFO Nelson Urdaneta added:
“As we look into Q4, our outlook in which there is an implied step up like what we saw in Q3, the drivers behind it would be, first, is around pricing realization. As a reminder, we've implemented additional pricing actions in the third quarter, and those will be fully realized as we go into the fourth quarter. So we do expect in the fourth quarter another step-up in terms of price realization as we look at our overall outlook.”
As a result, inflation is not faltering, and a much higher level of demand destruction is needed to cool the pricing pressures.
Please see below:
 Source: Kimberly-Clark
To explain, Kimberly-Clark realized 9% YoY net pricing in Q3 (the red box). However, on a nine-month basis, the figure is 8% (the blue box). Therefore, the company has increased its prices faster in the last three months versus the six months prior, which highlights the difficulty of the Fed’s inflation fight.
Finally, Coca-Cola – one of the largest beverage companies in the world – released its third-quarter earnings on Oct. 25. CFO John Murphy said during the Q3 earnings call:
“We are encouraged by the momentum in our top line and we leverage our capabilities to sustain top-line growth with the ongoing inflationary backdrop. As we look to our cost outlook, we expect global inflation to continue to impact our expenses across the board and commodities to remain volatile.”
CEO James Quincey added:
“It’s likely that next year price/mix will run ahead of volume in a similar way it has this year. I mean our long-term growth algorithm has assumed a relative balance between price and mix. Clearly, at the moment, we're in a period where there's more price/mix than there is volume, and that seems that seems likely to continue into next year.”
Please see below:
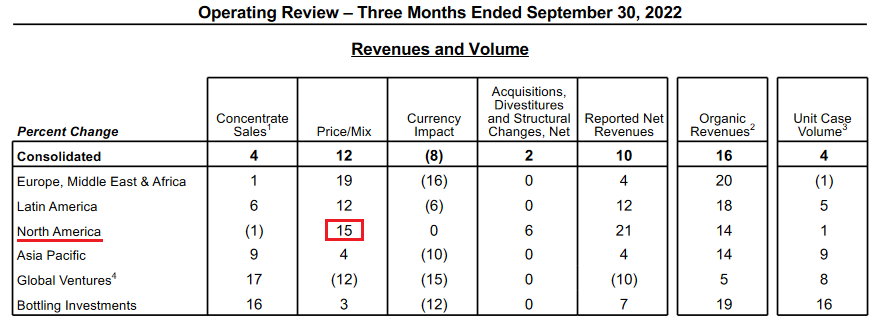 Source: Coca-Cola
To explain, Coca-Cola increased its North American prices by up to 15% in Q3, which highlights the pricing power some companies have in the marketplace. More importantly, the results mirror Kimberly-Clark.
Please see below:
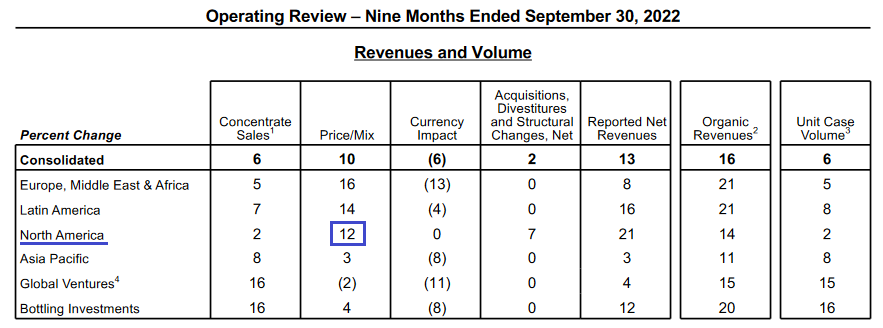 Source: Coca-Cola
To explain, Coca-Cola realized a North American price/mix of 15% in Q3 and 12% over the last nine months. As a result, the company’s pricing actions have increased throughout 2022 rather than decelerating as the Fed had hoped. Therefore, while I’ve warned repeatedly that the Fed’s inflation fight will be one of attrition, the consensus still underestimates the challenges that lie ahead.
The Bottom Line
With Alphabet and Microsoft spoiling the party after hours on Oct. 25, the pair brought investors back to reality. Moreover, with the Fed still miles away from its 2% inflation goal, the FFR should continue its ascent until demand destruction materializes. As such, investors don’t realize that resilient consumer spending and corporate earnings (which most companies have delivered so far in Q3) will necessitate a higher FFR to curb inflation. Thus, the liquidity drain should remain in effect for the foreseeable future.
In conclusion, the PMs rallied on Oct. 25, as the S&P 500’s optimism was contagious. Furthermore, the declines in the USD Index and the U.S. 10-Year real yield were music to the bulls’ ears. However, with the fundamentals still profoundly bearish and Big Tech showing cracks in its foundation, this bear market rally should fail. So we expect gold, silver, mining stocks, and the S&P 500 to hit lower lows in the months ahead.
Thank you for reading our free analysis today. Please note that the above is just a small fraction of the full analyses that our subscribers enjoy on a regular basis. They include multiple premium details such as the interim targets for gold and mining stocks that could be reached in the next few weeks. We invite you to subscribe now and read today’s issue right away.
Sincerely,
Przemyslaw Radomski, CFA
Founder, Editor-in-chief -
Gold Stubbornly Fails to Profit From Its Rivals’ Weakness
October 25, 2022, 9:31 AMAlthough the dollar has shown little strength lately, gold and mining stocks are not taking advantage of the situation to rebound. What are the conclusions?
The S&P 500 continued its ascent on Oct. 24, as the index rallied by 1.19%; and while silver followed suit and jumped by 0.65%, gold declined by 0.13%, the GDX ETF by 1.68% and the GDXJ ETF by 1.98%.
In addition, the relative weakness was pronounced since the USD Index was roughly flat and the U.S. 10-Year real yield declined. As a result, with gold and mining stocks unable to gain any momentum when their adversaries struggled, their performances should worsen if (when) the USD Index and the U.S. 10-Year real yield resume their uptrends.
The PMs’ Plight
While the S&P 500 exuded optimism on Oct. 24, gold, silver and mining stocks were relative laggards. Moreover, with the GDXJ ETF declining by nearly 2%, I noted on Oct. 19 that the PMs can fall when the general stock market rises. I wrote:
While the S&P 500 confronts a bullish tactical setup, the PMs’ don’t need to follow in the index’s footsteps (…).
To explain, the vertical gray lines above depict periods where the S&P 500 rallied and the gold futures price declined. Therefore, while it would be helpful for the S&P 500 to fall, the index's plight is not necessary for the PMs to endure weakness.
All in all, positioning, sentiment and seasonality support a higher S&P 500, while the medium-term technicals and fundamentals are profoundly bearish. Thus, we consider any strength a bear market rally and expect the index to hit lower lows in the months ahead. However, since asset prices don't move in a straight line, the setup is tactically bullish.
So while the index rallied by more than 1% on Oct. 24, the positioning and sentiment extremes that fueled the S&P 500 are not present for gold.
For example, non-commercial (speculative) futures traders are significantly net short the S&P 500. Likewise, after they increased their net short exposure from ~164,000 contacts to ~223,000 contracts last week, their behavior encourages an S&P 500 short squeeze. As such, a small amount of optimism can push the index higher.
Please see below:
 Source: Commitments of Traders (COT) report
To that point, I noted on Oct. 19 how investors attempt to front-run catalysts before they emerge. I wrote:
Corporations remain the largest buyers of U.S. equities, and with the buyback blackout period ending next week, it could provide further support for stocks. Furthermore, when you add large short bets by hedge funds and retail traders purchasing put options like there is no tomorrow, the positioning imbalance is relatively bullish for the S&P 500.
Moreover, with the bears becoming the consensus, expecting a lower S&P 500 in the short term is a crowded trade.
Please see below:
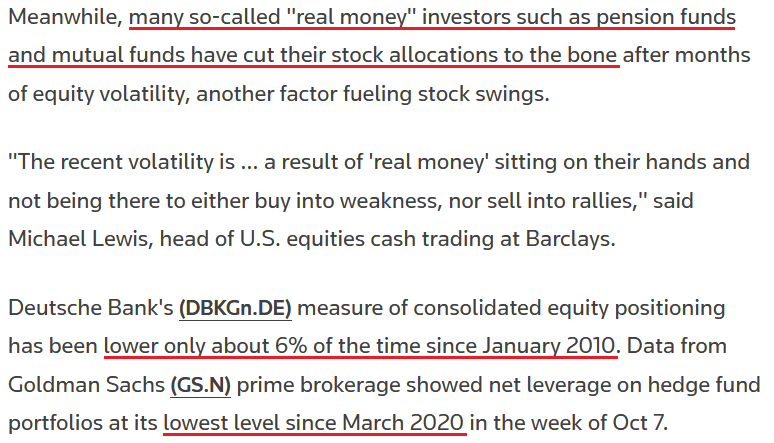 Source: Reuters
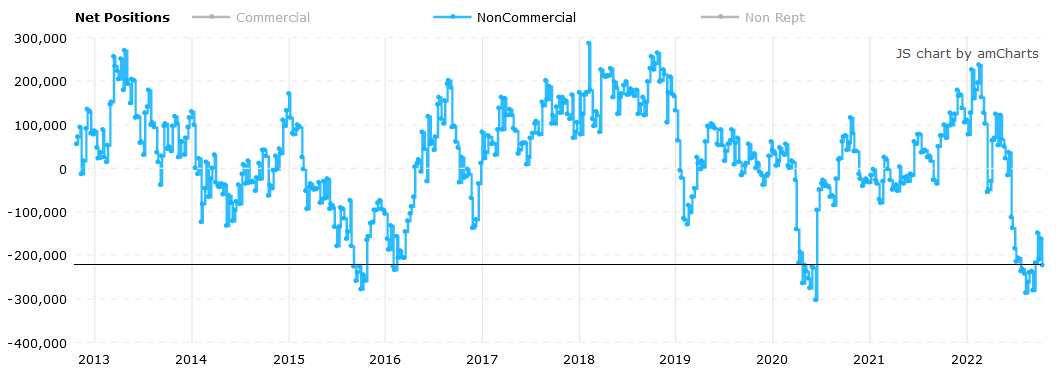
In stark contrast, speculators are net long gold; and while non-commercial futures traders reduced their net long exposure from ~94,000 contracts to ~77,000 contracts last week, the crowd is still bullish on the yellow metal. So the positioning ramifications are much different, and gold can’t rely on a short squeeze to propel it higher.
Please see below:
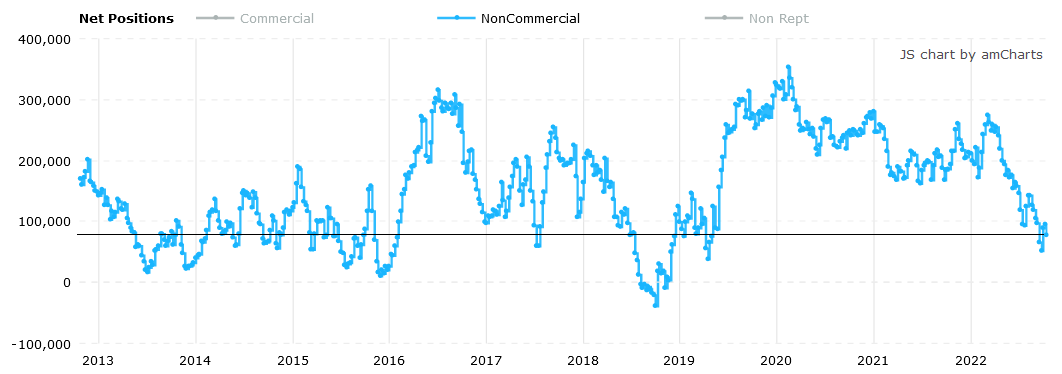 Source: COT report
Thus, while the S&P 500 could rise over the next few weeks, please remember that bear market rallies are a dime a dozen, and while the S&P 500 lost more than 50% of its value during the 2008 crisis, there were plenty of countertrend moves along the way.
Therefore, while the S&P 500’s short-term outlook is relatively bullish (though, it was more bullish at ~3,600), its medium-term outlook is profoundly bearish. As a result, it’s important to ignore the short-term sentiment and focus on the technical and fundamental developments that should occur in the months ahead.
In addition, the PMs underperformed the S&P 500 on Oct. 24, and their short-term outlooks are bearish for many reasons. As such, we still believe that shorting the GDXJ ETF offers an attractive risk-reward proposition.
Interest Rate Uncertainty
With the Wall Street Journal's (WSJ) Nick Timiraos noting on Oct. 21 that Fed officials are more open to smaller rate hikes during the fall and winter months, his not-so-subtle hint helped fuel the recent risk rally.
Please see below:
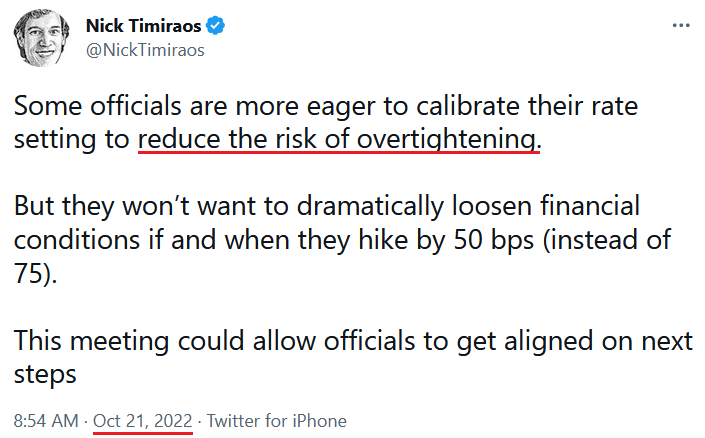
Moreover, while the S&P 500’s price action makes it seem like the revelation is something to celebrate, the reality is that the implications are profoundly hawkish. To explain, I wrote on Oct. 24:
The FFR is already at 3.25%, and a 75 basis point rate hike is likely a done deal on Nov. 3; and if the Fed hikes rates by 50 basis points in December, the FFR will end 2022 at 4.5%....
Thus, while our 4.5% FFR projection was in the major minority in August, it’s now the consensus; and with our upper estimate of 5.5% in 2023 still plausible, the pace of the Fed’s FFR increases implies nothing about its peak.
Furthermore, while investors hope that the worst is in the rearview, history shows that every inflation fight since 1954 has ended with a recession, and a higher FFR is only one part of a two-part story.
So while the medium-term implications are highly ominous, there are concerns that the short-term outlook has shifted. For example, a subscriber asked if the Fed doesn’t raise interest rates in December, is it bullish for the PMs?
Well, that outcome is bullish, and the PMs would likely rally. However, even Timiraos admitted the conversation is about “if and when they hike by 50 bps (instead of 75).” Therefore, the Fed wants to slow the pace of its rate hikes (which was always expected), not stop them altogether (no pivot).
Second, positioning is a critical component. I noted above that speculators are net long gold and net short the S&P 500; and S&P 500 shorts are encouraged to cover their positions on good news, which helps drive the index higher. Also, the positioning extremes encourage medium-term bears to flip short-term bullish.
Please see below:
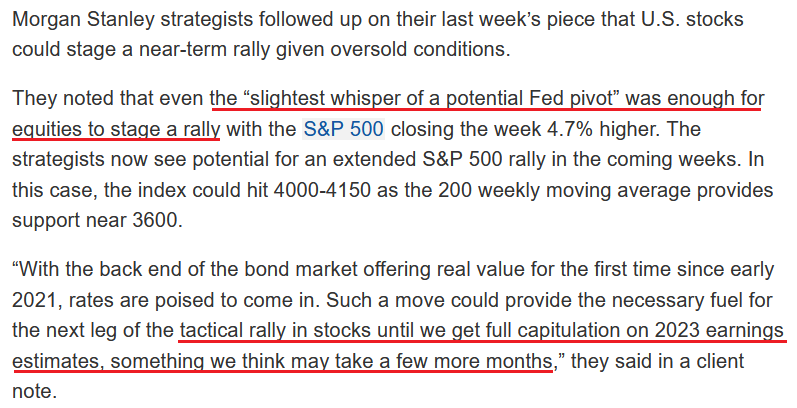 Source: Investing.com
 To explain, Morgan Stanley’s Chief U.S. Equity Strategist Mike Wilson has been a vocal bear in 2022. However, with a deceleration in bad news usually the catalyst to unwind crowded bets, short covering has a material impact on asset prices.
Yet, I noted above that speculators are net long gold, so the short-term calculus is much different. Conversely, if speculators were overwhelmingly net short gold like the S&P 500, the potential for a short squeeze would be concerning. However, that is not the case right now.
Third, while investors may cheer a 50 basis point rate hike in December, they’re forgetting about the impact of quantitative tightening (QT). With the Fed’s balance sheet hitting another 2022 low last week, the liquidity drain continues to intensify.
Moreover, with the Fed increasing Treasury bond supply, the behavior puts upward pressure on interest rates. As a result, while Wilson has been expecting lower interest rates for some time, bond buyers are few and far between when the Fed is no longer supporting the market.
Please see below:
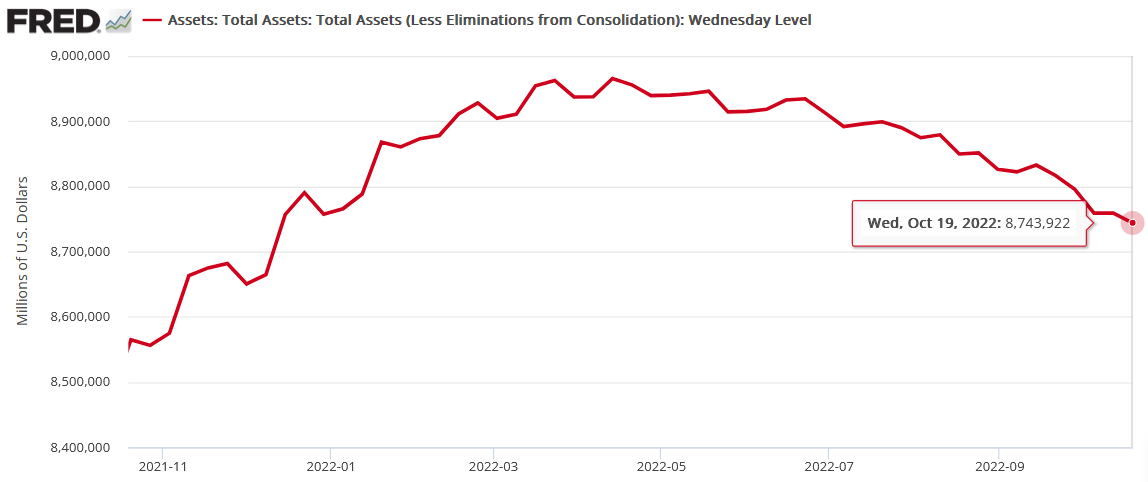
As further evidence, the iShares 20+ Year Treasury Bond (TLT) ETF highlights the dynamic. With long-term bonds still reeling, fixed income investors are nowhere near as enthusiastic as the stock market bulls.
Please see below:
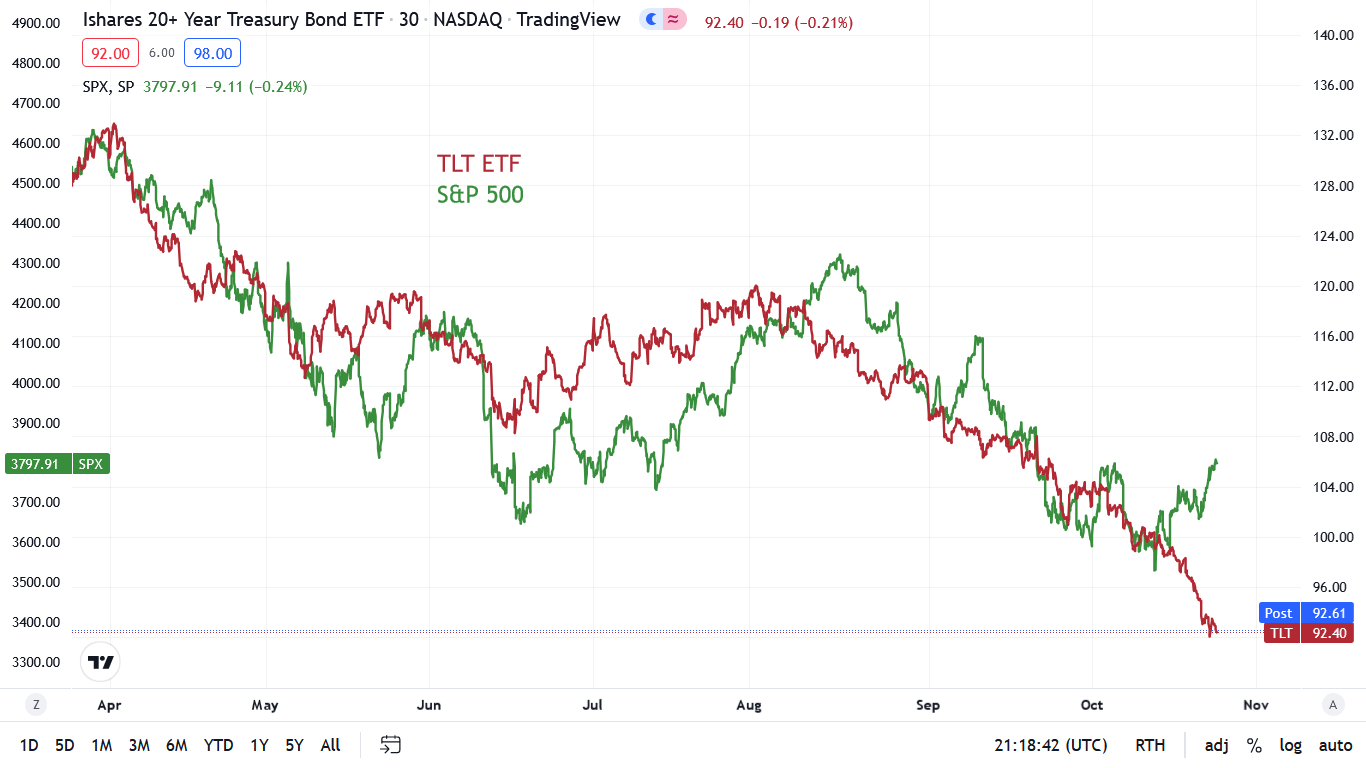
To explain, the red line above tracks the 30-minute movement of the TLT ETF, while the green line above tracks the 30-minute movement of the S&P 500. If you analyze the right side of the chart, you can see that a material divergence is present. Thus, as the TLT ETF falls (rates rise), the S&P 500 should also move lower. However, when S&P 500 sentiment and positioning are this bearish, a short-term decoupling can occur.
Conversely, with positioning a non-factor, gold's short-term outlook is much less optimistic.
Please see below:
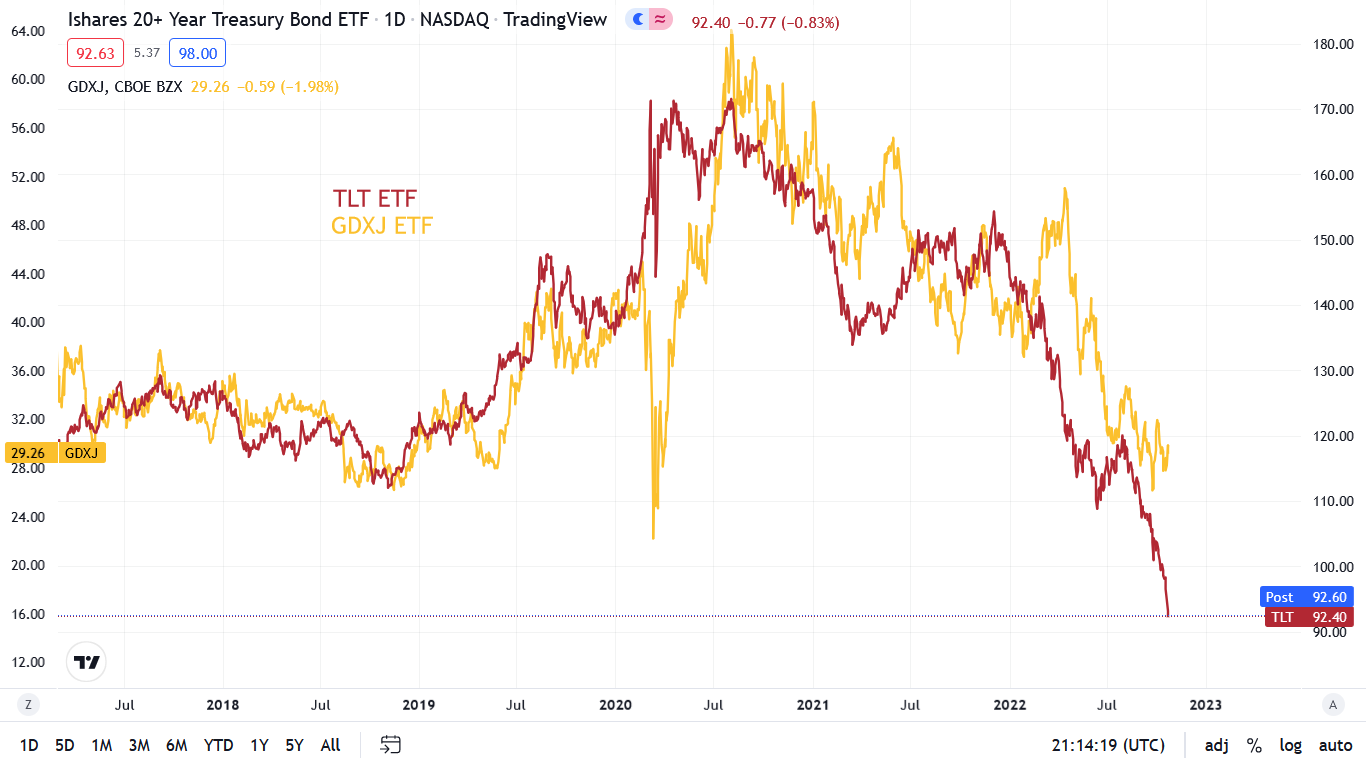
To explain, the red line above tracks the daily movement of the TLT ETF, while the gold line above tracks the daily movement of the GDXJ ETF. As you can see, the junior miners are not fans of higher long-term interest rates; and with the Fed’s QT program designed to increase long-term yields to combat inflation, the PMs’ short-term outlooks remain bearish.
The Bottom Line
While large intraday swings have become the norm, the S&P 500 is supported by a positioning imbalance that is not present with gold. So while the former may rally until investors become more neutral, the yellow metal doesn’t require the same kind of recalibration. As a result, the PMs have the potential to decline in both the short and medium term.
In conclusion, the PMs were mixed on Oct. 24, as silver ended the day in the green. However, gold and mining stocks struggled even as the S&P 500 rallied, the USD Index was roughly flat and the U.S. 10-Year real yield declined. Therefore, we believe the PMs confront more downside than upside risk in the weeks and months ahead.
Thank you for reading our free analysis today. Please note that the above is just a small fraction of the full analyses that our subscribers enjoy on a regular basis. They include multiple premium details such as the interim targets for gold and mining stocks that could be reached in the next few weeks. We invite you to subscribe now and read today’s issue right away.
Sincerely,
Przemyslaw Radomski, CFA
Founder, Editor-in-chief


Gold Investment News
Delivered To Your Inbox
Free Of Charge
Bonus: A week of free access to Gold & Silver StockPickers.
Gold Alerts
More-
Status
New 2024 Lows in Miners, New Highs in The USD Index
January 17, 2024, 12:19 PM -
Status
Soaring USD is SO Unsurprising – And SO Full of Implications
January 16, 2024, 8:40 AM -
Status
Rare Opportunity in Rare Earth Minerals?
January 15, 2024, 2:06 PM

