
tools spotlight

-
Gold Price Upswing: Have We Really Reached Peak Inflation?
November 11, 2022, 8:52 AMA calmer inflation print sparked panic buying on Nov. 10 - the S&P 500 soared by 5.54%. Moreover, with gold rallying by 2.33%, silver by 1.76%, the GDX ETF by 7.51% and the GDXJ ETF by 8.57%, the crowd assumes the worst is in the rearview. To that point, the USD Index fell by 2.14%, while the U.S. 10-Year real yield dropped by 27 basis points.
However, investors’ optimism is built on a faulty foundation, and a reversal of fortunes should occur sooner rather than later.
Old Habits Die Hard
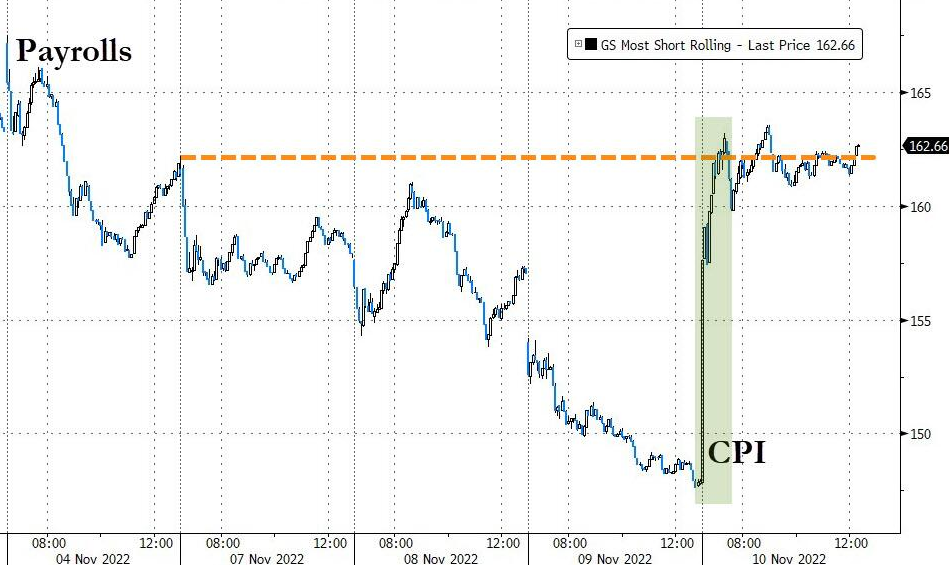
With the Consumer Price Index (CPI) coming in weaker-than-expected on Nov. 10, short squeezes ran rampant and uplifted gold, silver, mining stocks and the S&P 500. For example, Goldman Sachs’ basket of the most-shorted stocks rallied by 10%, and the daily upswing was the third-largest since before the global financial crisis (GFC).
Please see below:
 Source: Bloomberg/ZeroHedge
To explain, the right side of the chart shows how the CPI release coincided with substantial short-covering and helped propel liquidity-fueled assets higher. As a result, while the price action seemed bullish on the surface, the main driver of the risk rally was an unwinding of bearish bets.
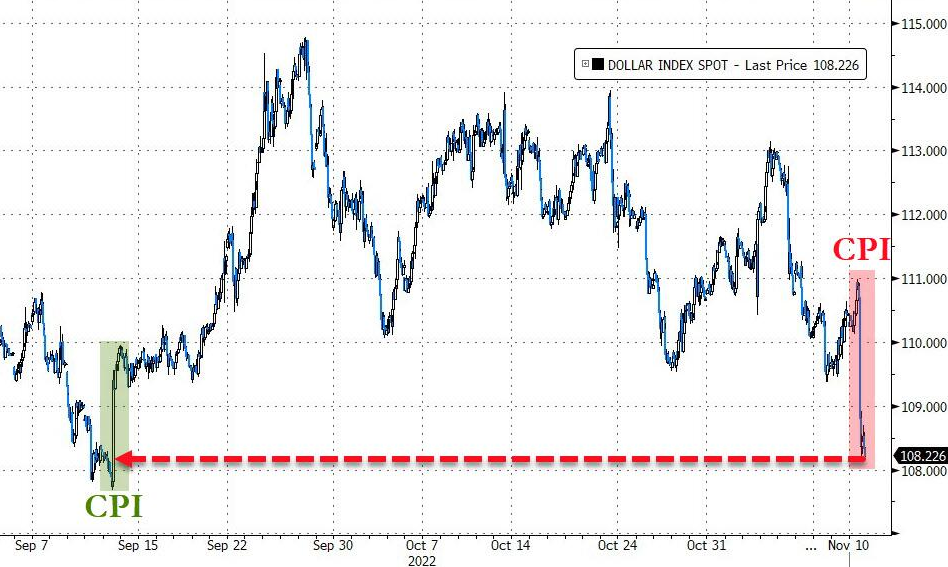
Likewise, with a cooler CPI supporting risk-on sentiment, the USD Index headed in the opposite direction.
Please see below:
 Source: Bloomberg/ZeroHedge
To explain, the right side of the chart shows how the CPI release helped push the USD Index lower, as investors swapped the leaders for the laggards on Nov. 10. However, the price action was much more semblance than substance, and the bulls are missing the forest through the trees.
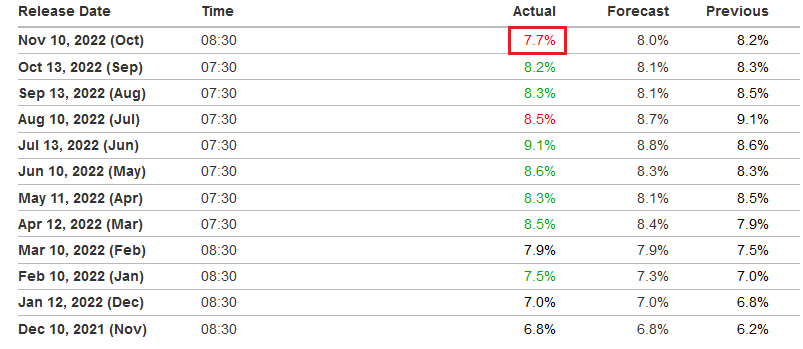
For starters, while the CPI missed the mark on Nov. 10, it was only the second time in the last 12 months that inflation underperformed expectations. Therefore, the crowd is way ahead of themselves here, and normalizing the metric to 2% is a challenge that’s far from priced in.
Please see below:
 Source: Investing.com
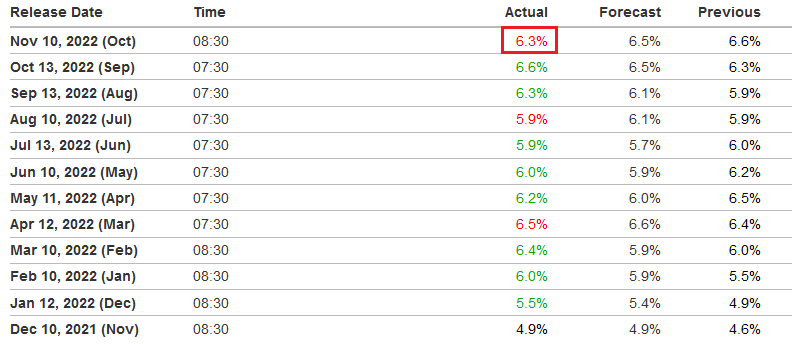
Second, the core CPI – which excludes the inflationary impact of food and energy – only missed the consensus estimate for the third time in the last 12 months. Moreover, the October figure is still higher than the results from April, May, June and July (released one month later). Thus, the exuberance on Wall Street materially contrasts the Fed's realized progress.
Please see below:
 Source: Investing.com
 Third, while investors celebrated the CPI’s mild deceleration, they didn’t realize that the Atlanta Fed’s Sticky CPI’s remained at their 2022 highs.
Please see below:
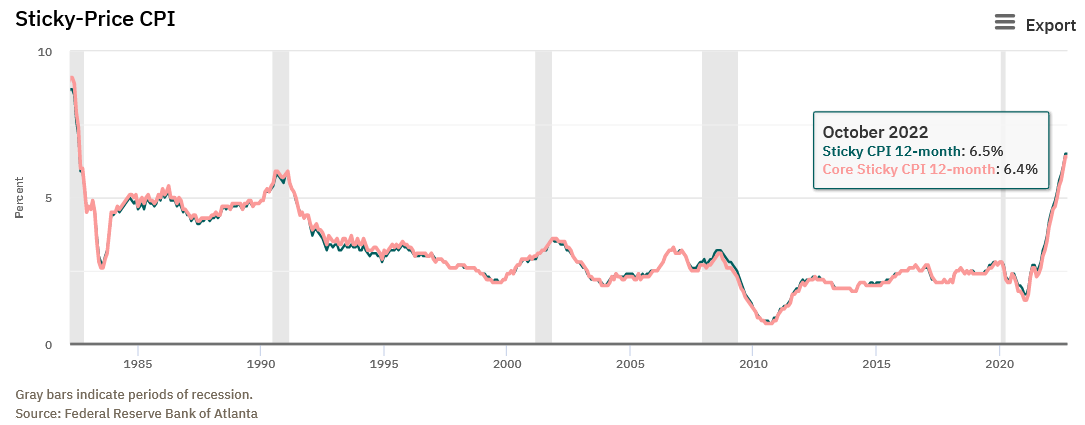
To explain, the blue and pink lines above track the year-over-year (YoY) percentage changes in the Sticky and core Sticky (excluding food and energy) CPIs. If you analyze the right side of the chart, you can see that both metrics are at their highest levels since 1982.
For context, the Atlanta Fed highlighted the reliability of the Sticky CPI. Researches stated:
“The Sticky CPI is calculated from a subset of goods and services included in the CPI that change price relatively infrequently. Because these goods and services change price relatively infrequently, they are thought to incorporate expectations about future inflation to a greater degree than prices that change on a more frequent basis. One possible explanation for sticky prices could be the costs firms incur when changing price.”
Furthermore, the October 2022 readings of 6.5% and 6.4% match the peaks from September, so while inflation may seem like an old problem, investor sentiment is significantly out of touch with reality.
All in all, the price action on Nov. 10 was unkind to our GDXJ ETF short position. However, the recent rally is another example of hope overpowering reality. In the real world, normalizing inflation is challenging because it often plateaus or reverses higher when central banks show patience.
In addition, the headline CPI's 0.44% month-over-month (MoM) increase annualizes to 5.41%. Therefore, if the MoM pace continues at this rate, the headline CPI will still be ~2.7x higher than the Fed's 2% target.
As such, I noted on Nov. 7 that investors' lack of historical knowledge should be their undoing over the medium term. I wrote:
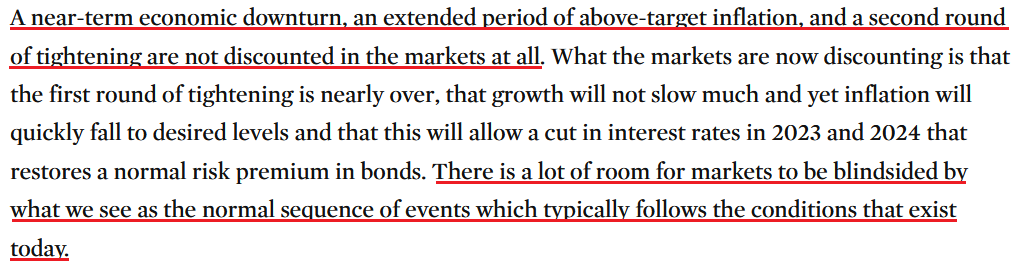
Bridgewater Associates is the largest hedge fund in the world, with more than $100 billion in assets under management (AUM). Co-CIO Bob Prince wrote on Oct. 11:
Going forward, the policy choices will be far more challenging when the goals of full employment and stable prices are at odds and the contraction in employment has not been sustained for long enough to bring down wage growth.
“For most central banks, at that stage there is a tendency to pause and see how things transpire. Such a pause tends to give markets a celebratory reprieve, producing a period of very good asset returns and a pickup in growth, both of which conspire to prevent wages and inflation from settling at the desired level, which necessitates the next round of tightening.”
Please see below:
 Source: Bridgewater Associates
Fed Officials Weigh In
With Fed officials behaving as Prince explained, attempts to balance inflation and growth have occurred throughout history. However, the lesson from those debacles is that when the Fed tries to create the perfect ending, it fails at both objectives. As a result, officials’ appetite for patience is normal but highly unlikely to prevent a recession.
On the dovish side, Kansas City Fed President Esther George said on Nov. 10:
“Without question, monetary policy must respond decisively to high inflation to avoid embedding expectations of future inflation. A more measured approach to rate increases may be particularly useful as policymakers judge the economy's response to higher rates….
“I continue to see several advantages for a steady and deliberate approach to raising the policy rate.”
Dallas Fed President Lorie Logan said on Nov. 10:
“I believe it may soon be appropriate to slow the pace of rate increases so we can better assess how financial and economic conditions are evolving….This morning's CPI data were a welcome relief, but there is still a long way to go. Inflation is much too high.”
Philadelphia Fed President Patrick Harker said on Nov. 10:
“I am in the camp of wanting to get to what would clearly be a restrictive stance, somewhere north of four-ish, you know, 4.5%, and then I would be okay with taking a brief pause, seeing how things are moving; and then if we have to, we can continue to tighten.”
San Francisco Fed President Mary Daly said on Nov. 10:
“I would rather move [the U.S. federal funds rate (FFR)] a little bit higher and have to come back then to move a little bit less high and to then tell people we’re going to go higher, because at some point it does seep into inflation expectations.
“I don’t want to be over tightening to the point where we throw the economy into a sharp recession, but if we are talking about a rate hike on either side, I want to fully get inflation sustainably down to 2% on average.”
On the hawkish side, Cleveland Fed President Loretta Mester said on Nov. 10:
“Given that inflation has consistently proven to be more persistent than expected and there are significant costs of continued high inflation, I currently view the larger risks as coming from tightening too little….
“I believe monetary policy will need to become more restrictive and remain restrictive for a while in order to put inflation on a sustainable downward path to 2%.”
Minneapolis Fed President Neel Kashkari said on Nov. 9:
“I think we are on a good path right now: I think we are united in our commitment to getting inflation back down to 2%.... Any talk of a pivot is entirely premature.” The economy is a “long, long, long way” from the point where inflation and employment conflict.
So, while several Fed officials made the rounds, some preached caution while others were more forceful. However, the key point is that no one is talking about rate cuts, and a slower pace of rate hikes is not a pivot.
Remember, while Harker mentioned “a brief pause” near 4.5%, the rest either favored smaller rate increases or maintaining the current path. Therefore, while rate hikes of 25 and 50 basis points would have been considered materially hawkish in 2021, the recent string of 75 basis point increases make them seem relatively dovish.
However, their impact on the U.S. economy is the same, and the FFR’s peak is much more important than the pace at which it rises. As such, investors are attempting to manufacture a dovish pivot, and as Prince wrote, “there is a lot of room for markets to be blindsided” in the months ahead.
The Bottom Line
While investors celebrated the mild drop in the CPI, their willingness to assume that inflation will decline linearly should be their downfall. Throughout 2022, bear market rallies have uplifted gold, silver, mining stocks and the S&P 500 as uninformed narratives are powerful. However, their short shelf life has culminated with new lows once reality re-emerged. Thus, we expect a similar outcome over the medium term.
In conclusion, the PMs rallied on Nov. 10, as the ‘peak inflation’ crowd made another attempt at calling the bottom. Moreover, with the USD Index and U.S. Treasury yields declining sharply, the crowd believes a new bull market is on the horizon. However, the optimism is misguided, and the historical implications of how this all ends couldn’t be clearer.
Thank you for reading our free analysis today. Please note that the above is just a small fraction of the full analyses that our subscribers enjoy on a regular basis. They include multiple premium details such as the interim targets for gold and mining stocks that could be reached in the next few weeks. We invite you to subscribe now and read today’s issue right away.
Sincerely,
Przemyslaw Radomski, CFA
Founder, Editor-in-chief -
What Kind of Bearish Surprises Await the Gold Market?
November 10, 2022, 8:51 AMAvailable to premium subscribers only.
Thank you for reading our free analysis today. Please note that the above is just a small fraction of the full analyses that our subscribers enjoy on a regular basis. They include multiple premium details such as the interim targets for gold and mining stocks that could be reached in the next few weeks. We invite you to subscribe now and read today’s issue right away.
Sincerely,
Przemyslaw Radomski, CFA
Founder, Editor-in-chief -
What Happens to Gold After US Midterm Elections?
November 9, 2022, 7:35 AMRemember when Trump was elected as the U.S. President? And remember what happened to the price of gold at that time?
I marked in on the above chart, but to make it clearer, I’ll zoom in.
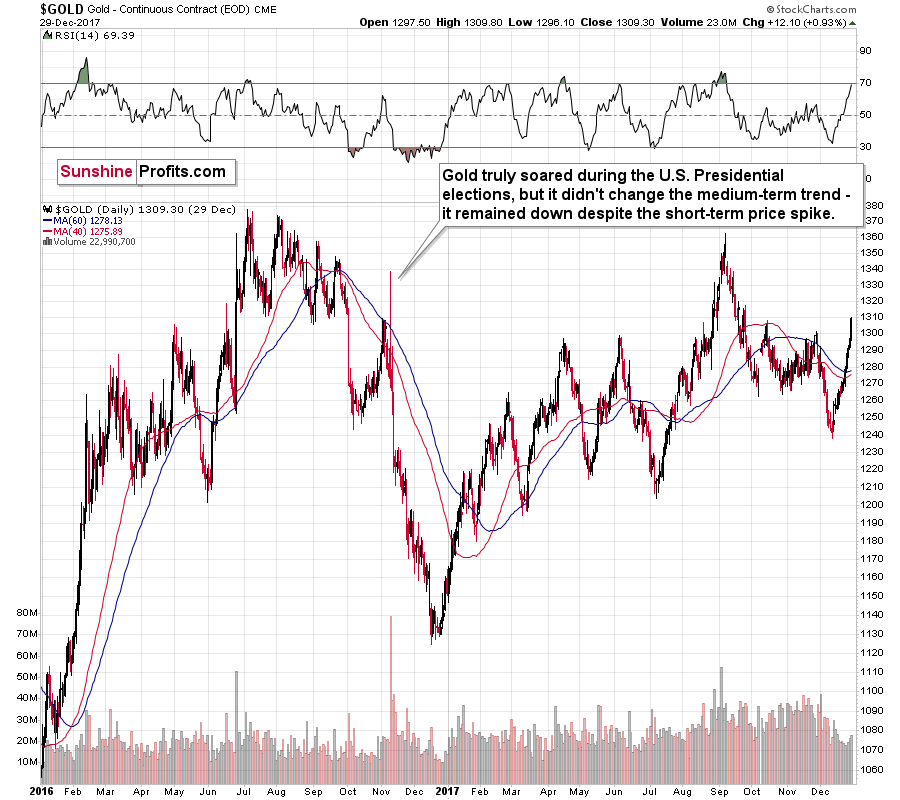
Gold truly soared during the 2016 U.S. Presidential elections, but it didn't change the medium-term trend - it remained down despite the short-term price spike.
The election-based price spike took place after a corrective short-term rally.
And what happened yesterday and in the preceding days?
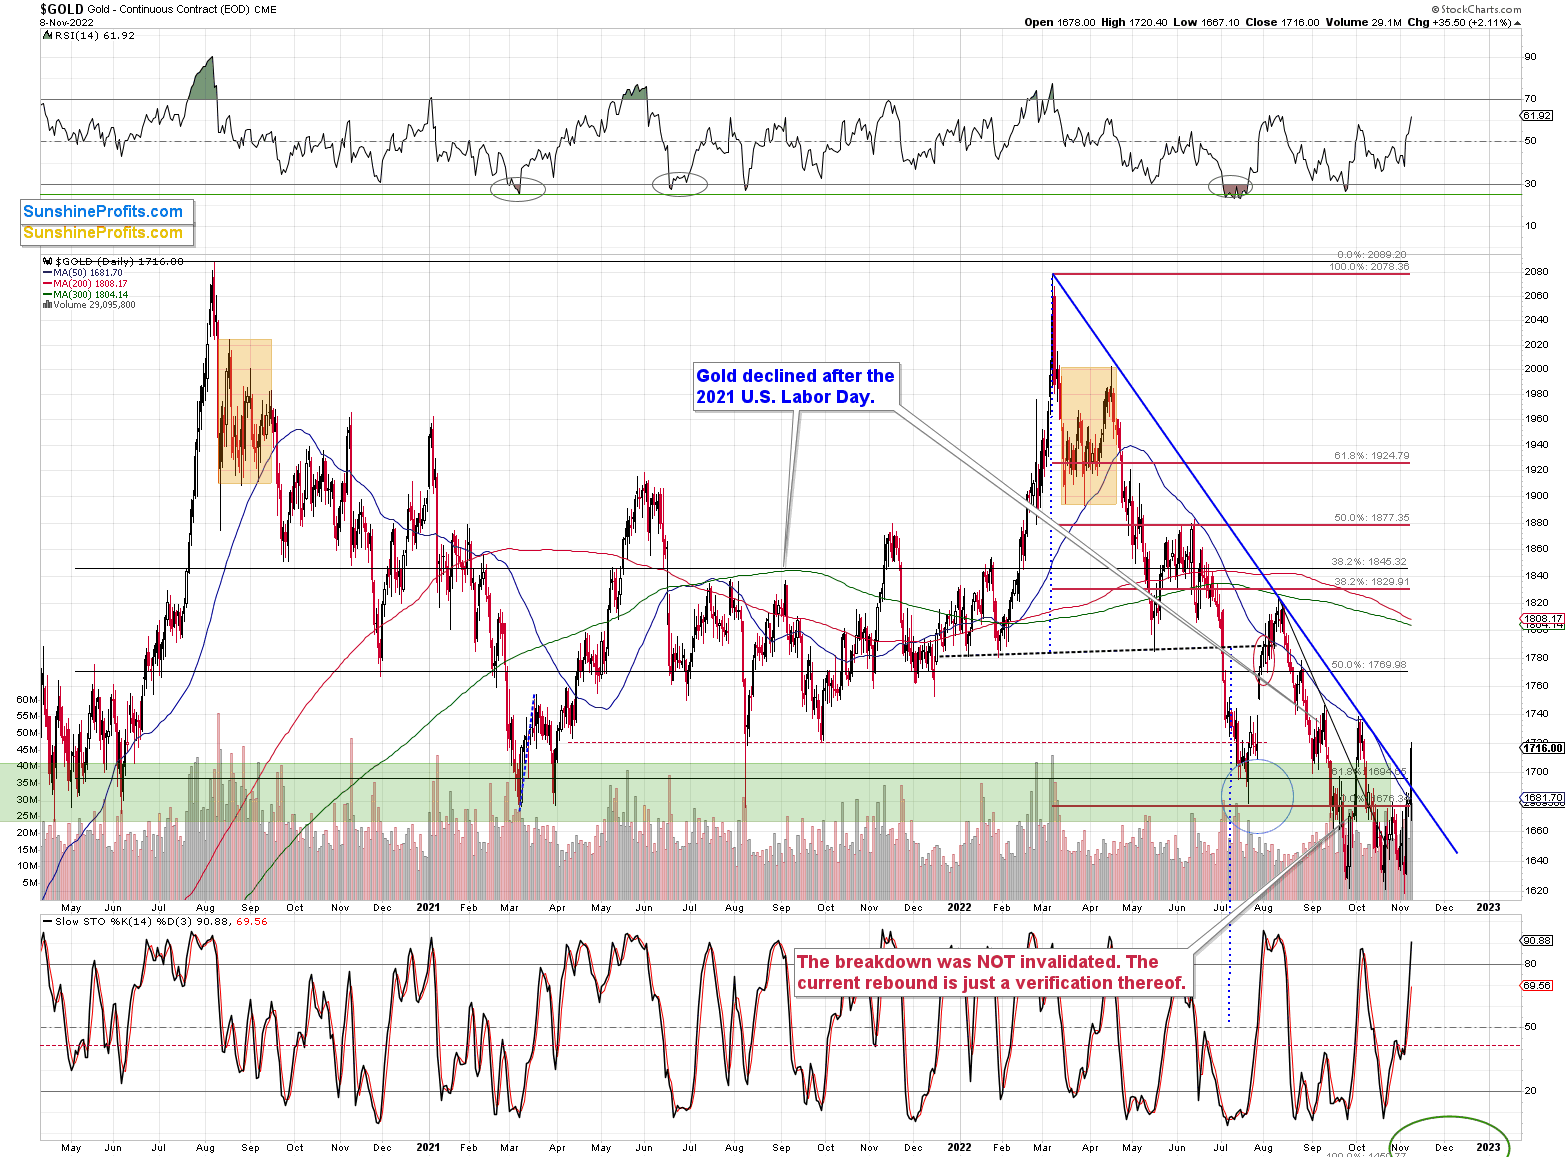
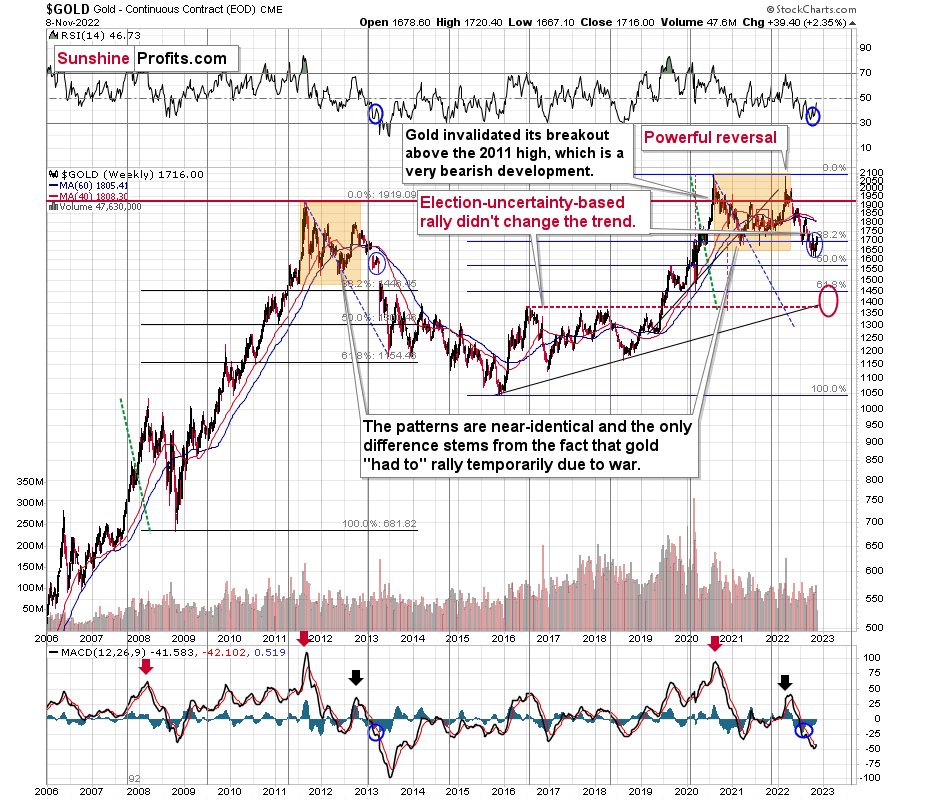
Gold moved sharply higher after a short-term rally. The history tends to rhyme, so I doubt that yesterday’s price action is able to trigger a sustainable rally.
That was just a single daily close above the declining, medium-term resistance line (marked with blue), and the 50-day moving average. Will this breakout be confirmed? Again, I doubt it.
Interestingly, based on yesterday’s rally, the gold-based RSI moved slightly above 60. That’s exactly what happened back in 2016 after the U.S. Presidential elections. And that was a local top – right before a massive slide. Gold then declined by almost 16% in less than two following months.
If the same was to happen now, gold would move to about $1,450. And yes, that would be in perfect tune with my previous analyses. That’s where we have strong support based on the 2020 lows.
Let’s keep in mind that the two key fundamental drivers of gold price are: the real interest rates, and the USD Index.
The real interest rates are clearly headed higher (nominal rates are going up, and eventually inflation is likely to come down), which is bearish for gold.
And the USD Index…
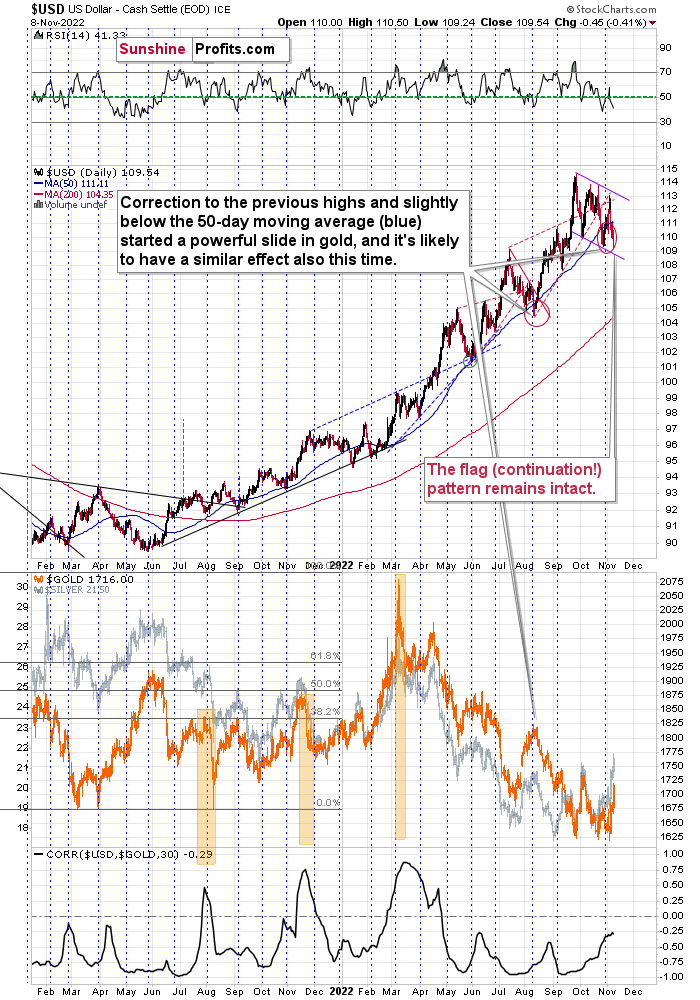
In short, the USD Index remains in its flag pattern that started in September. A flag pattern is a continuation pattern where the price trades sideways (but slightly against the trend) and it continues… until it doesn’t. Quite often, the pattern ends after two or three bottoms. We already had two, and it seems that the third one is about to be formed or it has already formed.
The RSI is slightly below 50 and the USDX itself is a bit below its 50-day moving average (blue line). In the previous months, this combination of factors meant that another sizable rally was just around the corner. As history tends to rhyme, the implications are bullish.
Since March, gold has been moving in the opposite direction to the USD Index, so the implications of the above are bearish for gold and the rest of the precious metals sector.
Why wasn’t gold moving against the USD Index in February? Because of the fear and uncertainty related to the Russian invasion of Ukraine. Please note that the war in Ukraine is still in place, and yet, gold is hundreds of dollars below its 2022 high. This serves as a strong confirmation of gold’s current weakness.
All in all, despite the very recent upswing in gold, the outlook for the precious metals sector remains very bearish in the medium term.
Thank you for reading our free analysis today. Please note that the above is just a small fraction of the full analyses that our subscribers enjoy on a regular basis. They include multiple premium details such as the interim targets for gold and mining stocks that could be reached in the next few weeks. We invite you to subscribe now and read today’s issue right away.
Sincerely,
Przemyslaw Radomski, CFA
Founder, Editor-in-chief


Gold Investment News
Delivered To Your Inbox
Free Of Charge
Bonus: A week of free access to Gold & Silver StockPickers.
Gold Alerts
More-
Status
New 2024 Lows in Miners, New Highs in The USD Index
January 17, 2024, 12:19 PM -
Status
Soaring USD is SO Unsurprising – And SO Full of Implications
January 16, 2024, 8:40 AM -
Status
Rare Opportunity in Rare Earth Minerals?
January 15, 2024, 2:06 PM

