
tools spotlight

-
Invalidations Across the Market Have Major Implications for Gold
December 7, 2022, 7:52 AMThe invalidations of breakouts and breakdowns are strong signals in the opposite direction, and we just saw them throughout the market – also in gold.
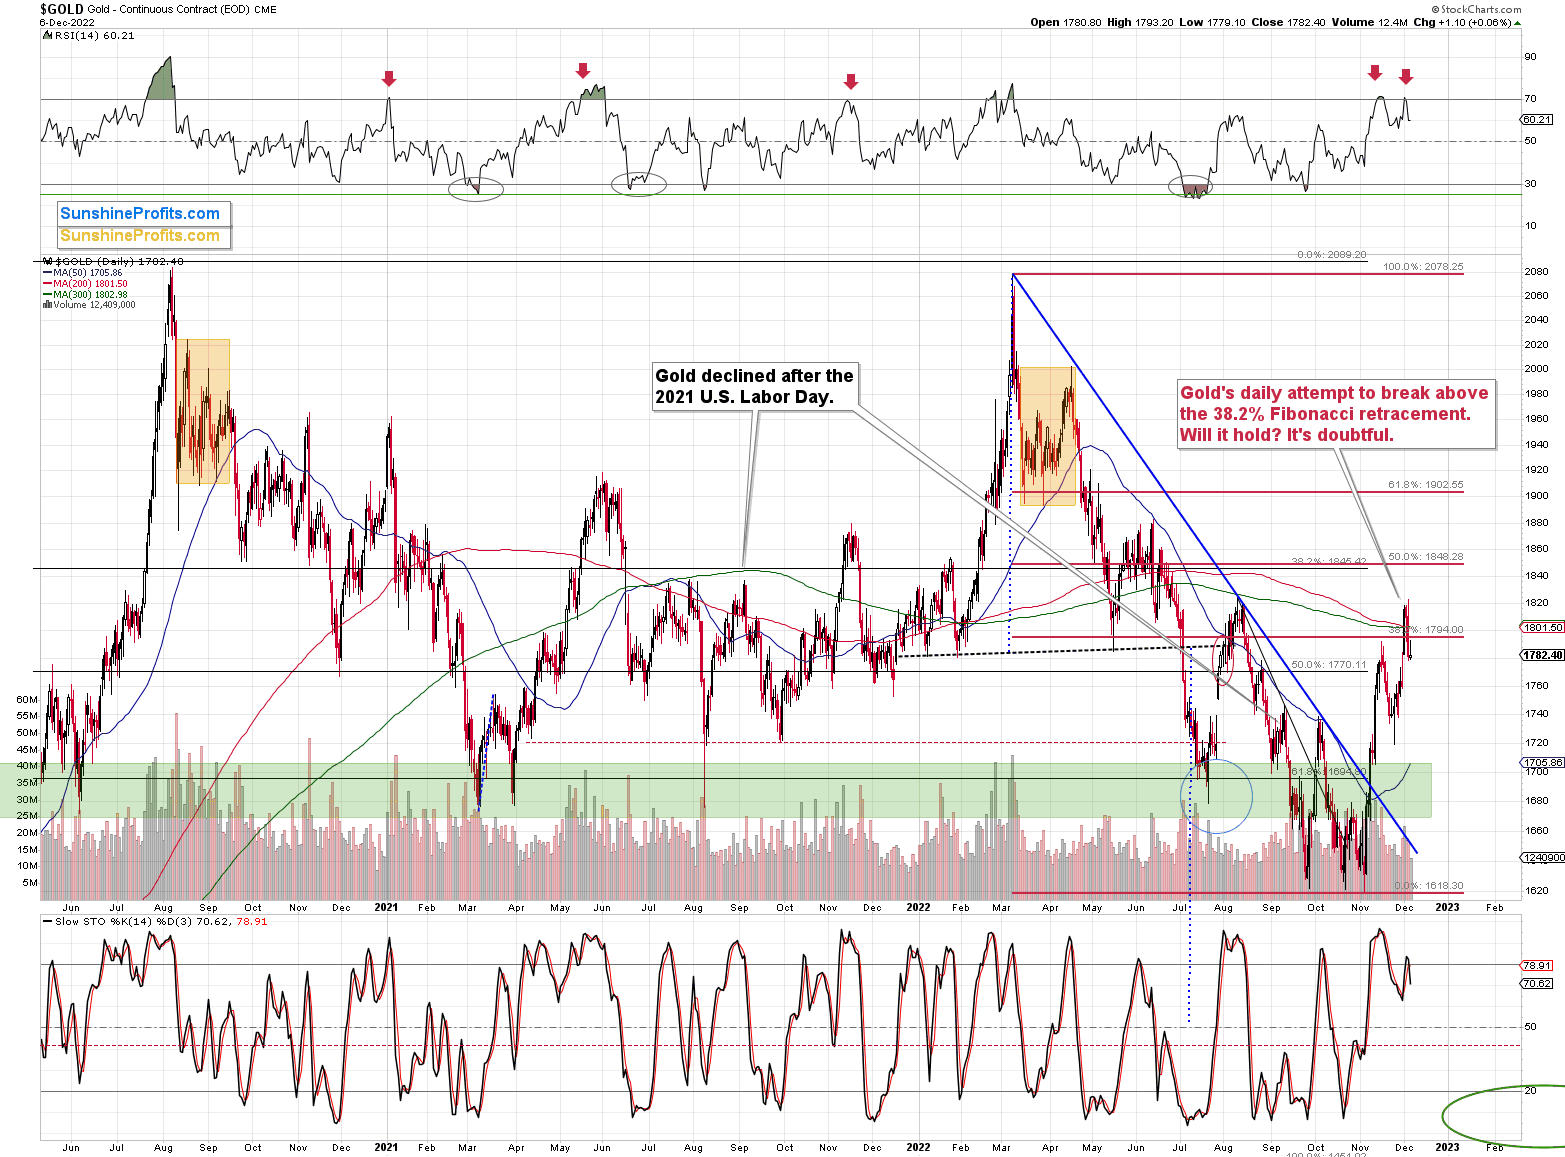
The gold price has recently invalidated its small breakout above the 38.2% Fibonacci retracement level, which is a strong bearish sign. If it was just gold where we saw this kind of performance, we could say it was by chance.
However, since we saw it almost everywhere (at least in almost every market that really counts for precious metals investors and traders), it’s something that shouldn’t be overlooked.
Especially since this invalidation coincided with a sell signal from the RSI indicator, which had just dropped below the 70 level. I used red arrows to mark previous cases where we saw something similar, and — you guessed it — declines followed in the majority of those cases.
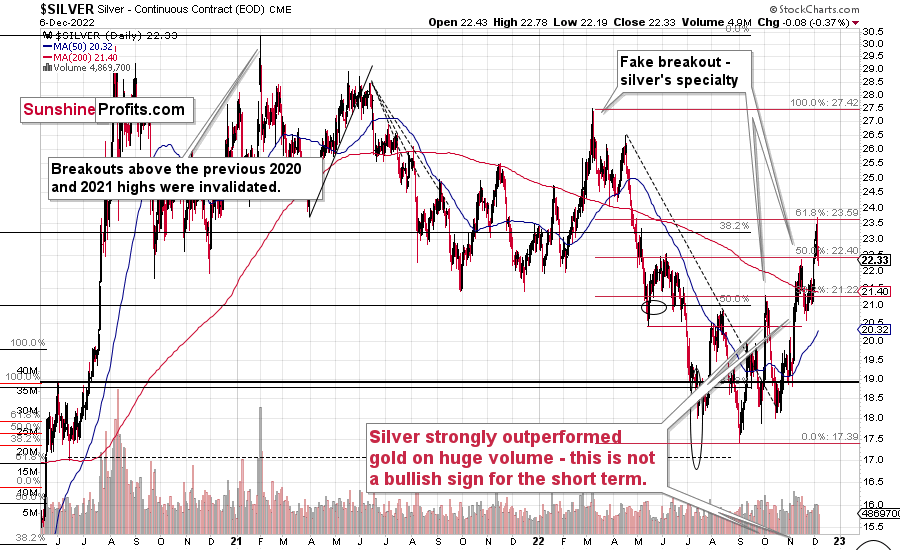
Silver is the odd guy, because it didn’t invalidate the breakout above the 38.2% retracement based on the 2022 decline. Instead, it invalidated its tiny breakout above the 61.8% retracement.
Fair enough, since silver is known to outperform gold just before bigger declines. The size of the correction seems to confirm this trading technique.
In today’s pre-market trading (chart courtesy of https://www.silverpriceforecast.com), silver was up slightly more than gold, compared to the size of yesterday’s intraday decline.
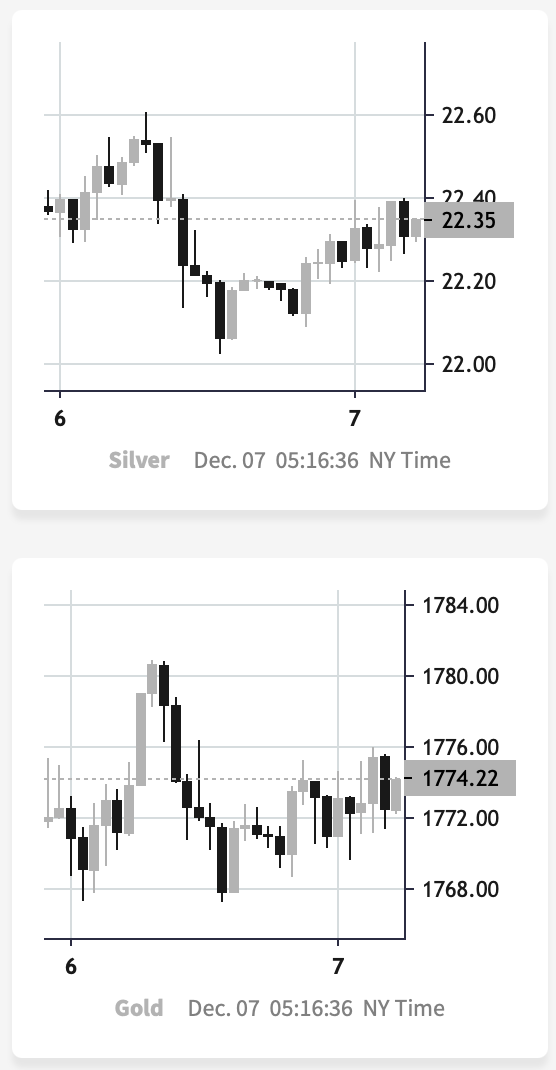
This is a subtle indication that silver’s very short-term outperformance remains intact, and it continues to have bearish implications for the short term.
Stocks Invalidated Their Breakout, Too
As I wrote earlier, it’s not just the precious metals market that invalidated its recent breakouts – we saw something very similar in the S&P 500 Index.
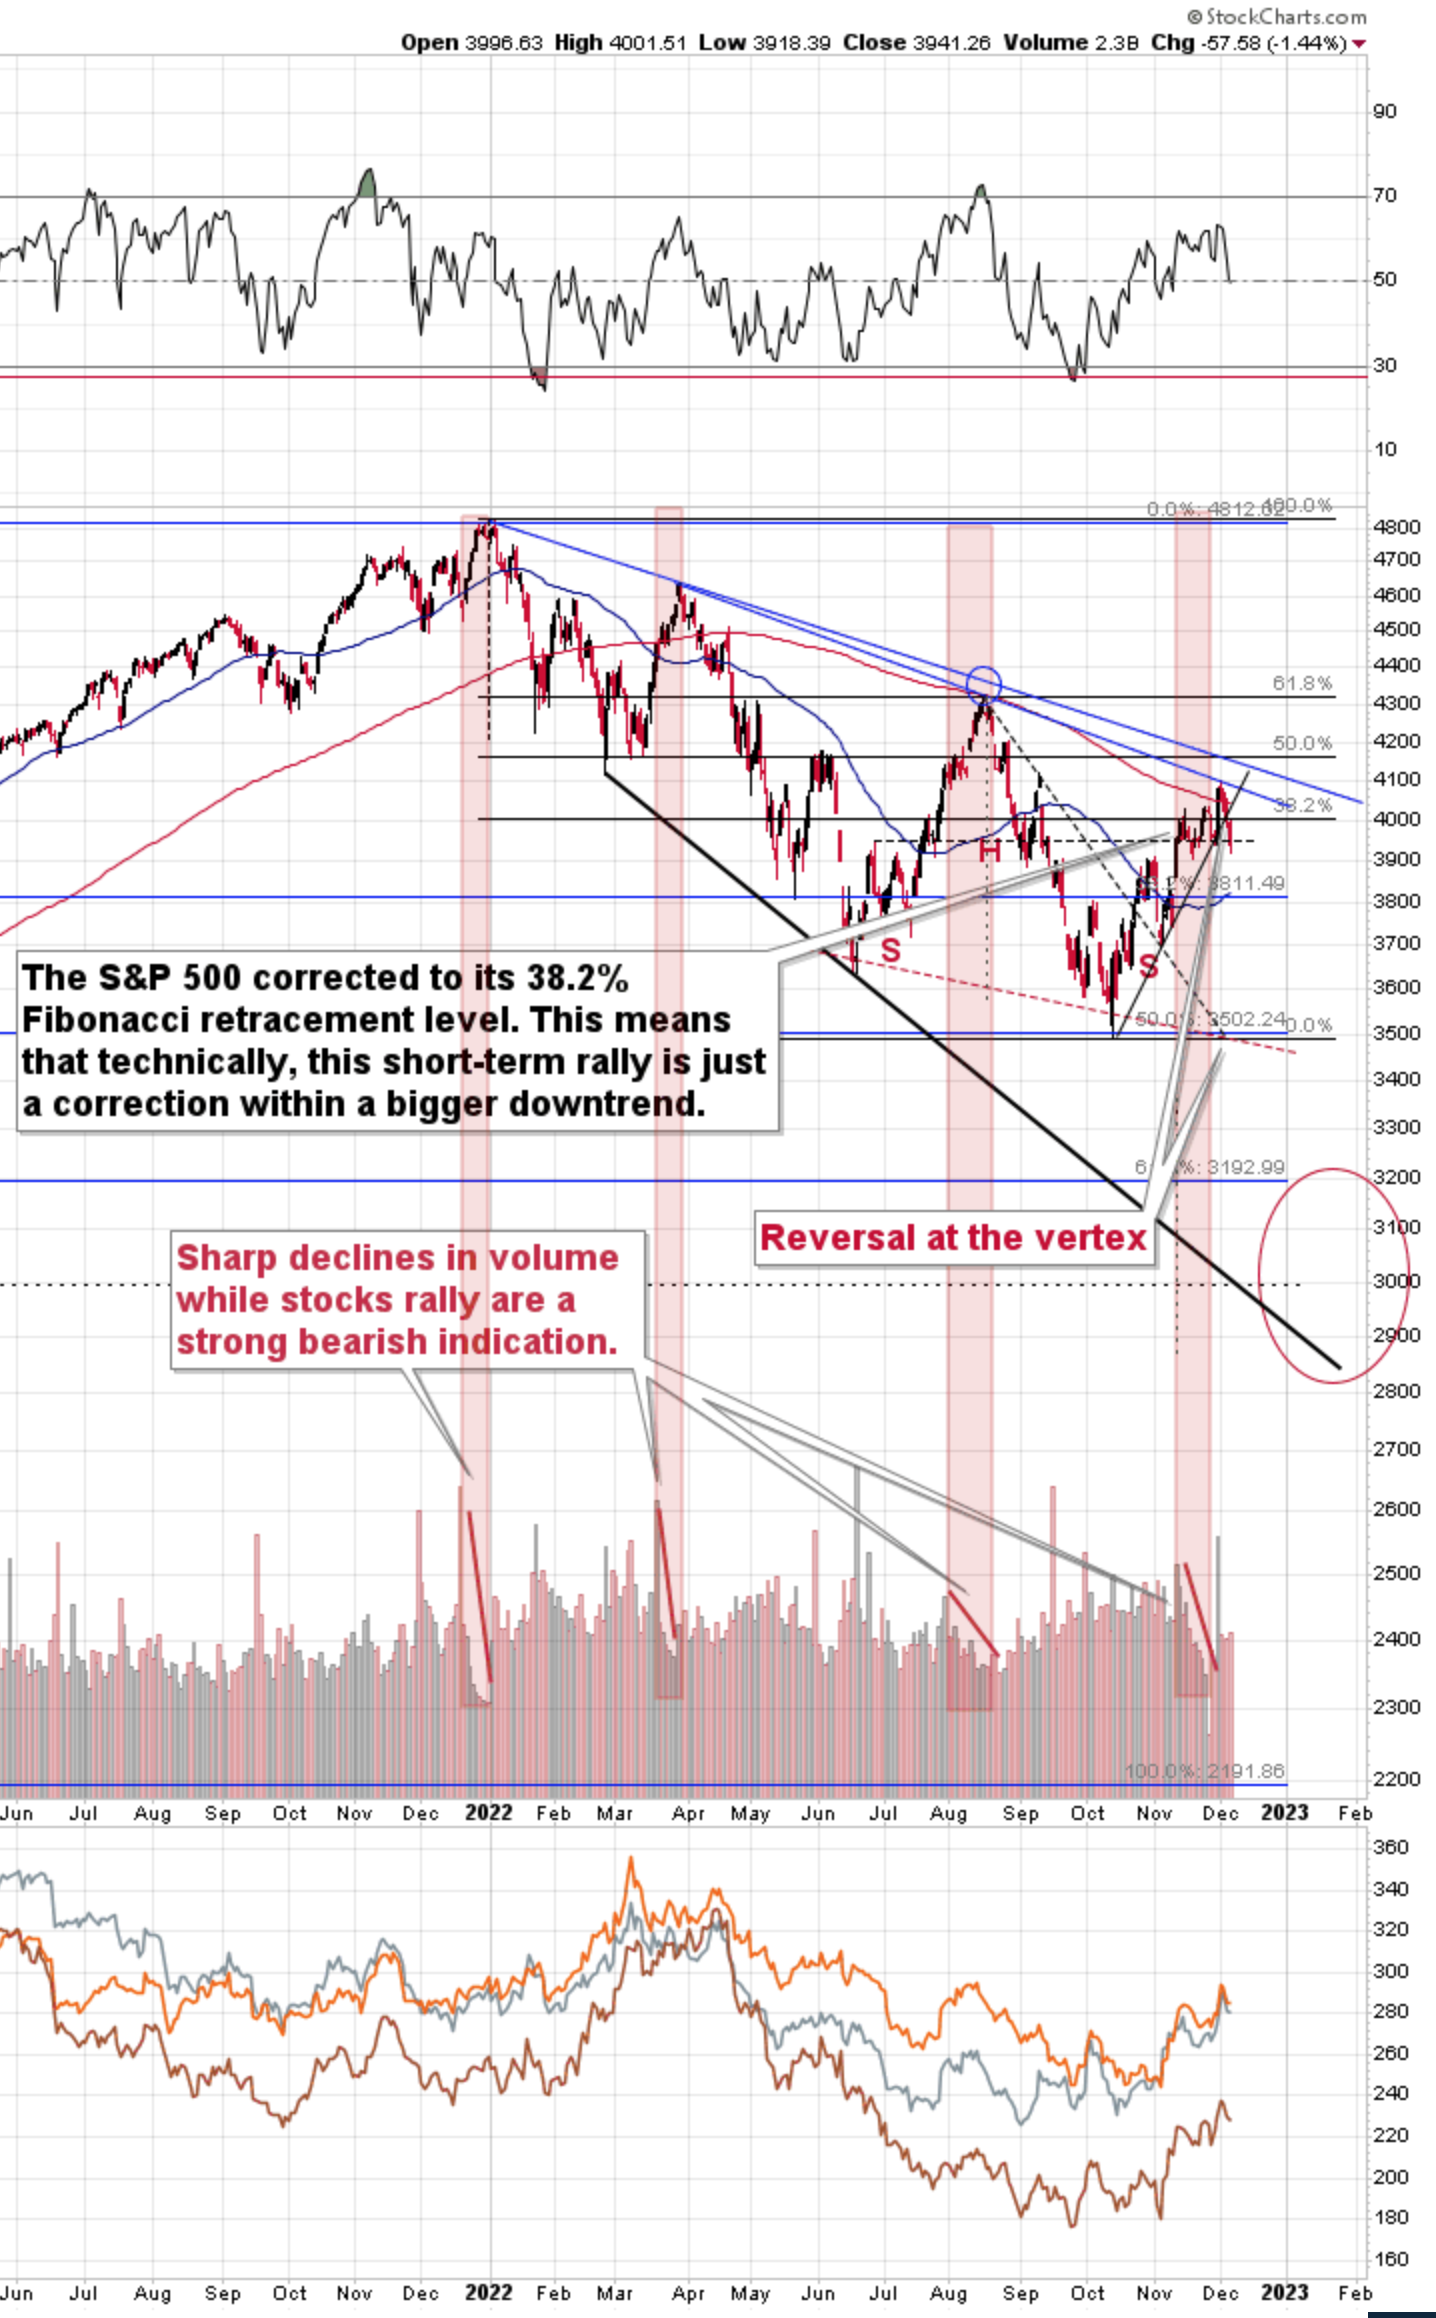
The broad market moved lower this week, and there are two good reasons to think that this time, the small move lower is just the beginning of a much bigger move to the downside.
One of the reasons is that this move lower came right after the triangle-vertex-based turning point. The declining black and red lines (both dashed) intersect at more or less the very recent top. As their name says, those turning points mark… Well, turning points. And since the most recent short-term move was to the upside, it currently has bearish implications.
The second reason is that stocks now broke below their rising support line (marked with a solid black line), and that’s not what happened during the two previous small moves lower.
The analogy in the price-volume link (marked with red rectangles) also points to much lower prices in the stock market.
Why is this important for gold and silver investors and traders? Because the last two big moves took place more or less in line with each other – in stocks and in precious metals (and miners). The slide in stocks could also trigger something similar in the case of commodities like crude oil. The same thing is likely to happen again this time, especially given what’s happening in the USD Index.

The USDX just invalidated a small breakout below its previous 2022 lows and its 38.2% Fibonacci retracement level. And it did so while being oversold from RSI’s point of view.
In fact, looking at the RSI, the current situation is very similar to what we saw in early June 2021. And you know what happened to gold shortly thereafter? It plunged.
So all in all, the outlook for the precious metals market is currently very bearish, not just from a medium-term point of view (which is mostly based on factors that I didn’t cover above), but also from a short-term point of view. Given the situation in both precious metals, and the stock market, it seems that the junior mining stocks are poised to decline the most.
Thank you for reading our free analysis today. Please note that the above is just a small fraction of the full analyses that our subscribers enjoy on a regular basis. They include multiple premium details such as the interim targets for gold and mining stocks that could be reached in the next few weeks. We invite you to subscribe now and read today’s issue right away.
Sincerely,
Przemyslaw Radomski, CFA
Founder, Editor-in-chief -
The Gold Market: The Name of the Game Is Invalidations
December 6, 2022, 9:44 AMThe recent developments in the gold market are mostly invalidations. However, they do not only come from the USDX, which usually affects the price of the yellow metal the most.
Today’s technical analysis once again takes the video format:
Thank you for reading our free analysis today. Please note that the above is just a small fraction of the full analyses that our subscribers enjoy on a regular basis. They include multiple premium details such as the interim targets for gold and mining stocks that could be reached in the next few weeks. We invite you to subscribe now and read today’s issue right away.
Sincerely,
Przemyslaw Radomski, CFA
Founder, Editor-in-chief -
How the USDX Helps Understand Gold Price Movements
December 5, 2022, 9:30 AMAt the turn of the month is when the dollar index tends to reverse. Does it mean something opposite for the precious metals market?
All eyes on the USD Index! At least that’s where they should be if one wants to make sense of the recent price moves.
In last Tuesday’s analysis, I wrote the following about the USD Index:
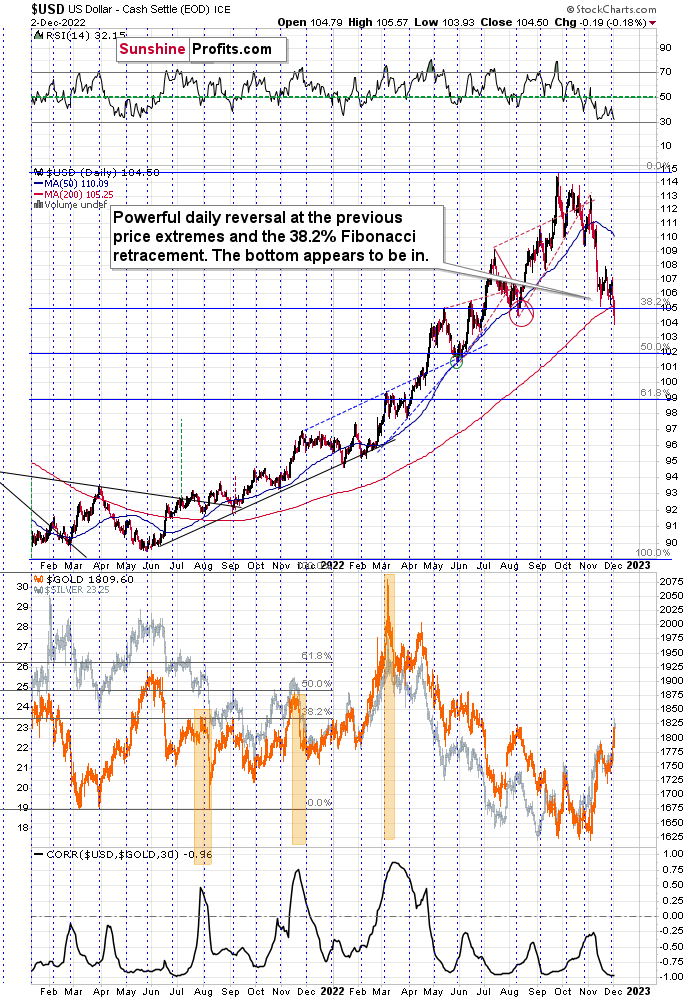
For example, the USD Index could decline to its strong support level at the 38.2% Fibonacci retracement and the August 2022 low as well as the May 2022 high. Such a move would likely imply the RSI at about 30, which would be a crystal-clear signal for many traders that the bottom is in.
To clarify, if that happened, the USD Index would be as oversold from a short-term point of view as it was at its 2021 bottom – when it was trading at about 90.
On Friday, I added:
The USD Index moved slightly below the above-mentioned levels, while the RSI remains just above 30. In other words, the situation is just like it was in mid-2021, with the exception that the prices appear to have moved ahead of themselves.
Now, the move below the support levels is not confirmed, and I doubt that it will be confirmed. An invalidation is a much more likely scenario. Unless we see the breakdown confirmed, nothing really changes.
The USD Index appears to be extremely oversold on irrational behavior, and neither is likely to last. Especially now that it's the turn of the month, when the USD Index tends to reverse. This means that the top in the precious metals market is also likely in or at hand.
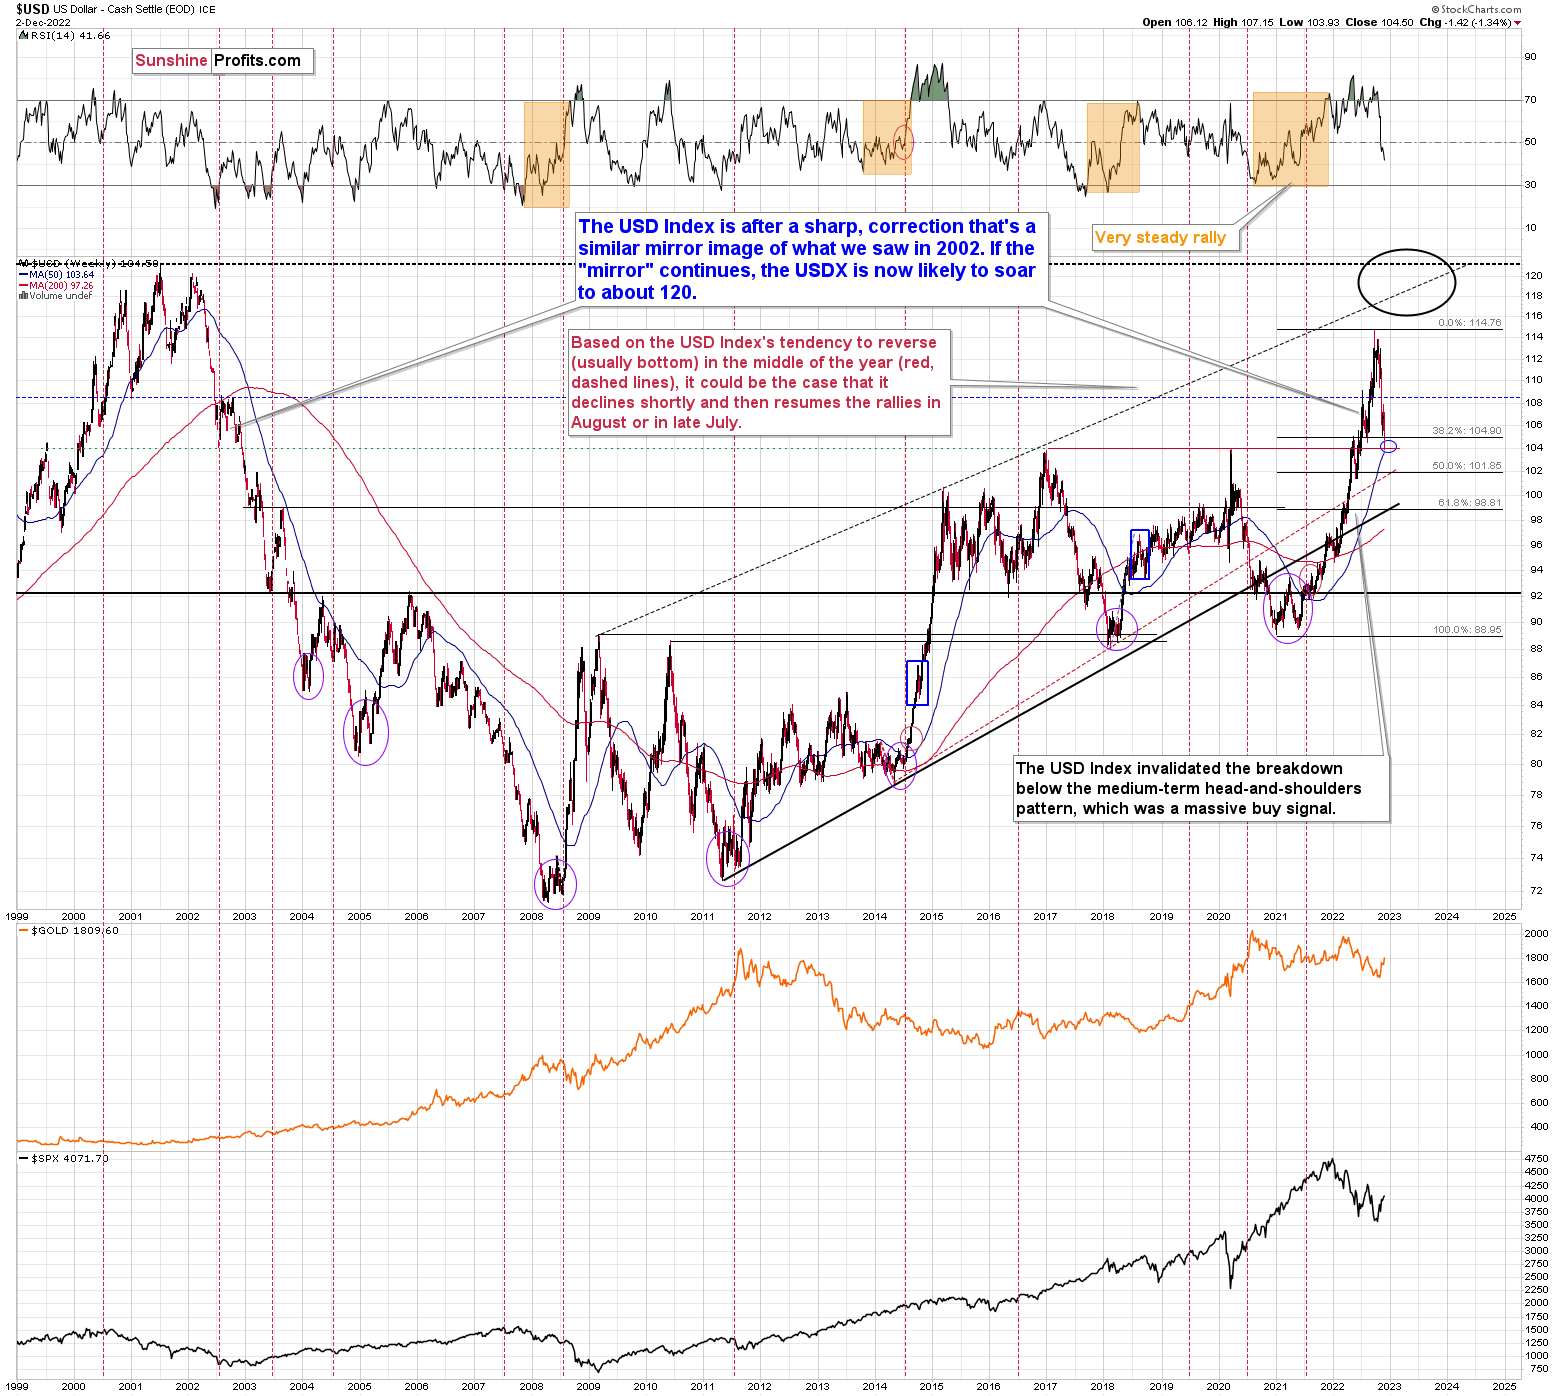
Moreover, please note that there is a yet another, even stronger, support on the above long-term chart.
The 2016 and 2020 tops (as well as the 2002 low and the 1999 top) currently serve as very strong support at about 104 level.
At the moment of writing these words, the USD Index futures’ pre-market low was 104.33 – extremely close to the above-mentioned support.
This might be the most important indication that the bottom in the USD Index is at hand, and the opposite is likely the case for stocks and the precious metals sector.
Friday’s intraday low was 103.93, which means that the above-mentioned very strong support level was reached.
The USDX futures are slightly down in today’s pre-market trading, but it could be the case that the rest of the world (where the exchanges were closed) is reacting to the recent events.
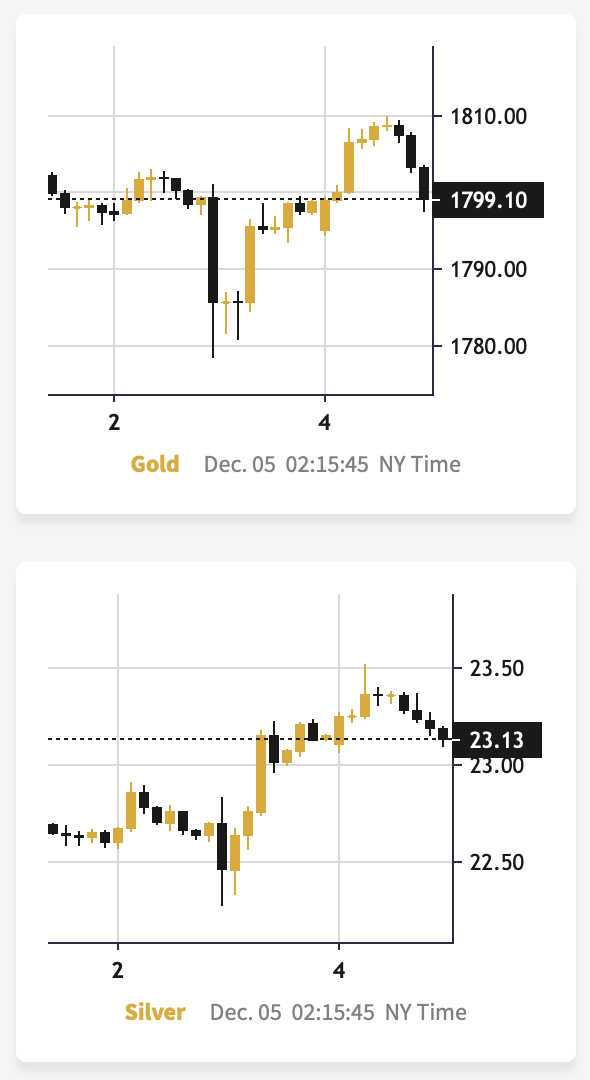
Interestingly, gold and silver moved higher initially, but then they quickly moved back down. In fact, at the moment of writing these words, gold is once again trading below $1,800, and the silver price is on its way to moving back below $23, too (chart courtesy of https://www.goldpriceforecast.com).
Anyway, as the 2016 and 2020 tops are reached, the bottoms are likely to be in. It could be the case that the USDX continues to trade around the 104 level for a couple of days before soaring, but a quicker rebound seems more likely to me.
Let’s not forget about the USD Index’s tendency to reverse at the turn of the month. We’re still very close to it, which means that this effect’s bullish implications remain intact.
Exactly the opposite is likely to be the case for the precious metals market.
As you can see on the above chart (when comparing its upper and lower parts), the decline in the USD Index corresponded to the rallies in gold and in the stock market.
And as you can see on the lower part of the first of today’s charts, the correlation between gold and the USD Index has been extremely negative recently.
Consequently, the odds are that the USD Index is about to rally, which is likely to push precious metals prices lower.
Thank you for reading our free analysis today. Please note that the above is just a small fraction of the full analyses that our subscribers enjoy on a regular basis. They include multiple premium details such as the interim targets for gold and mining stocks that could be reached in the next few weeks. We invite you to subscribe now and read today’s issue right away.
Sincerely,
Przemyslaw Radomski, CFA
Founder, Editor-in-chief -
Will Gold Be Able to Stay Above Its Resistance Level?
December 2, 2022, 10:19 AMGold recently corrected a large part of its previous move, but later traded above an important resistance level. Will it be able to sustain this move?
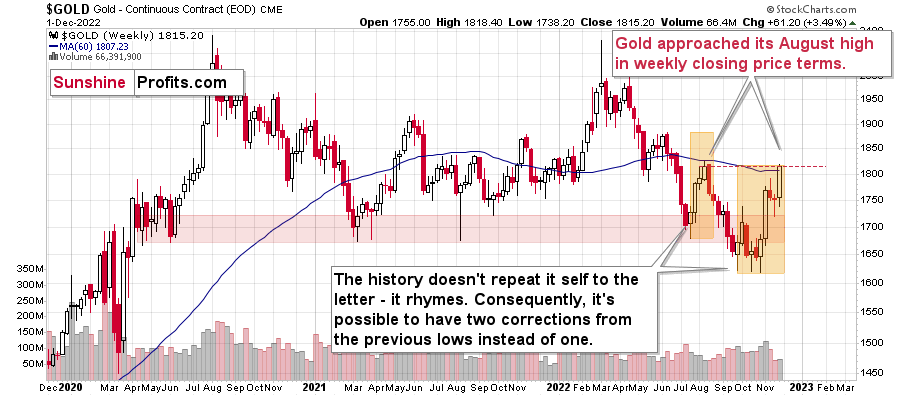
The above chart features gold price in terms of weekly candlesticks. As you can see, it just approached its August high.
The resistance is provided by the weekly closing prices, and since the current week ends today (Dec. 2), it’s likely that gold’s rally was just stopped or that it will be stopped today.
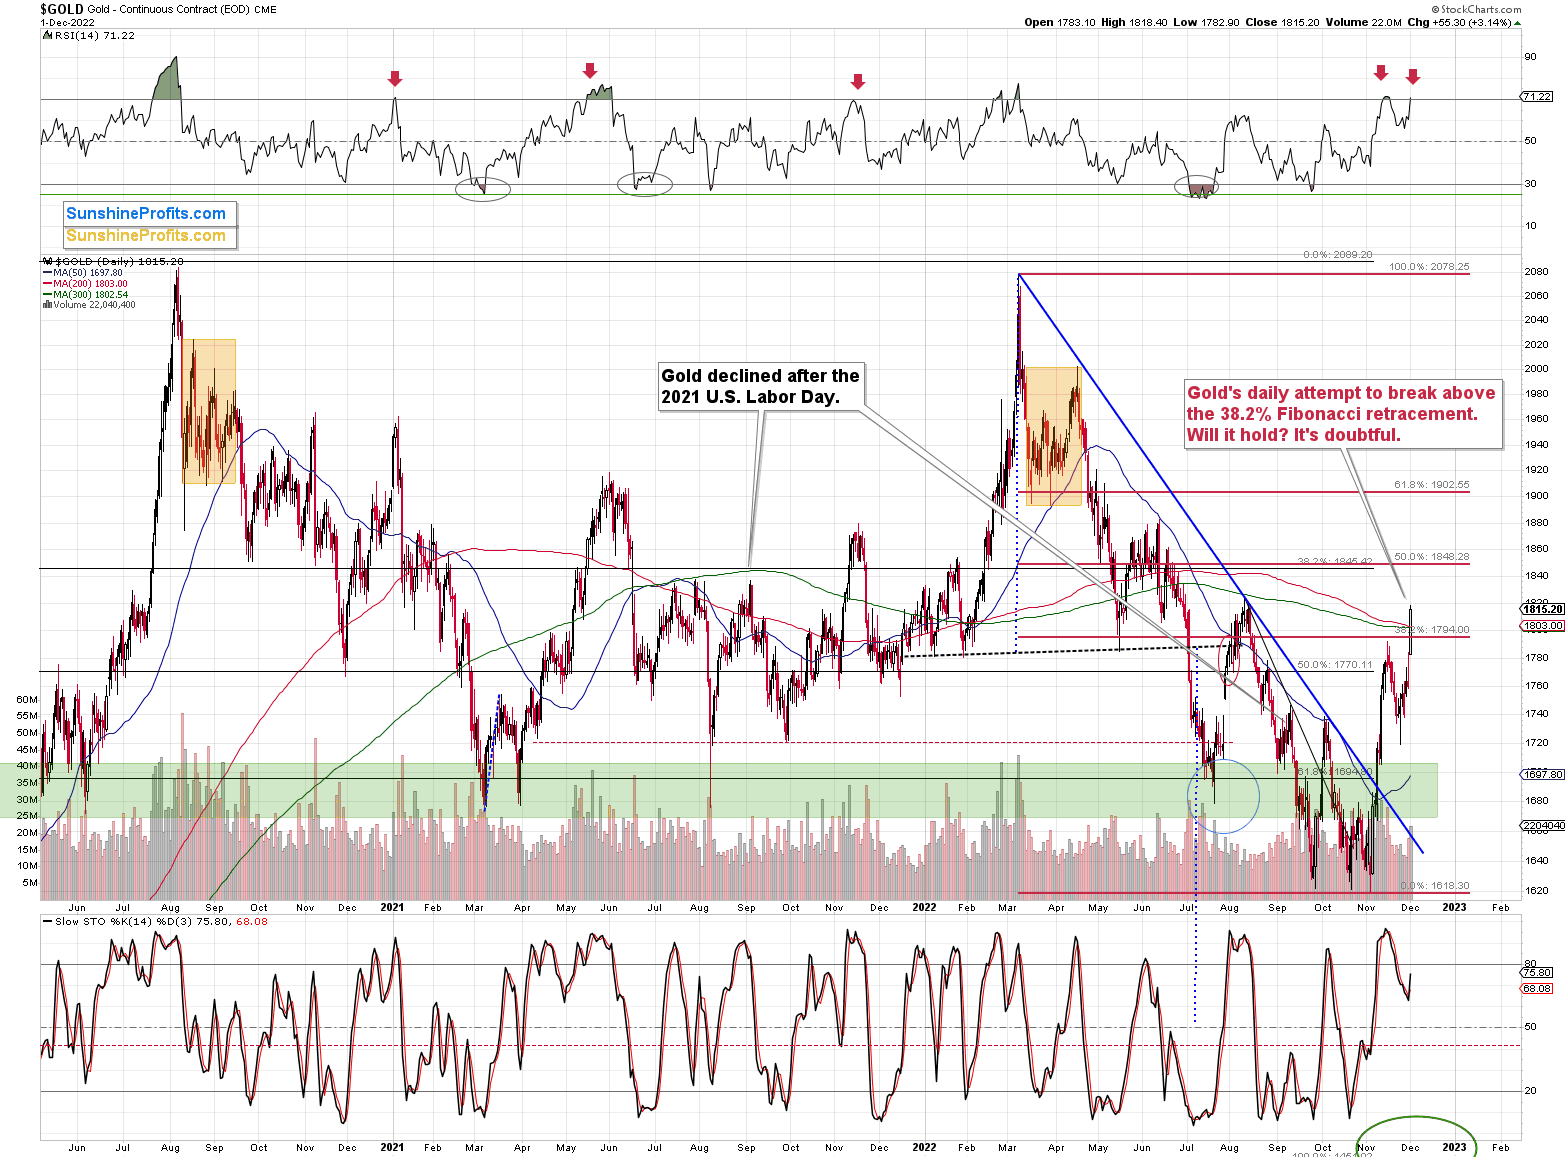
Gold, just like many other markets, recently corrected ~38.2% of its previous move.
Yesterday, however, gold rallied above this important resistance level. Now, the question is: will gold be able to hold this move, or will it invalidate the breakdown shortly?
The RSI just moved above 70, and it’s a classic sell signal, which had worked many times before.
The weekly resistance that I wrote about earlier is an important factor as well.
Not to mention another signal from the silver-to-gold link (chart courtesy of https://goldpriceforecast.com/).
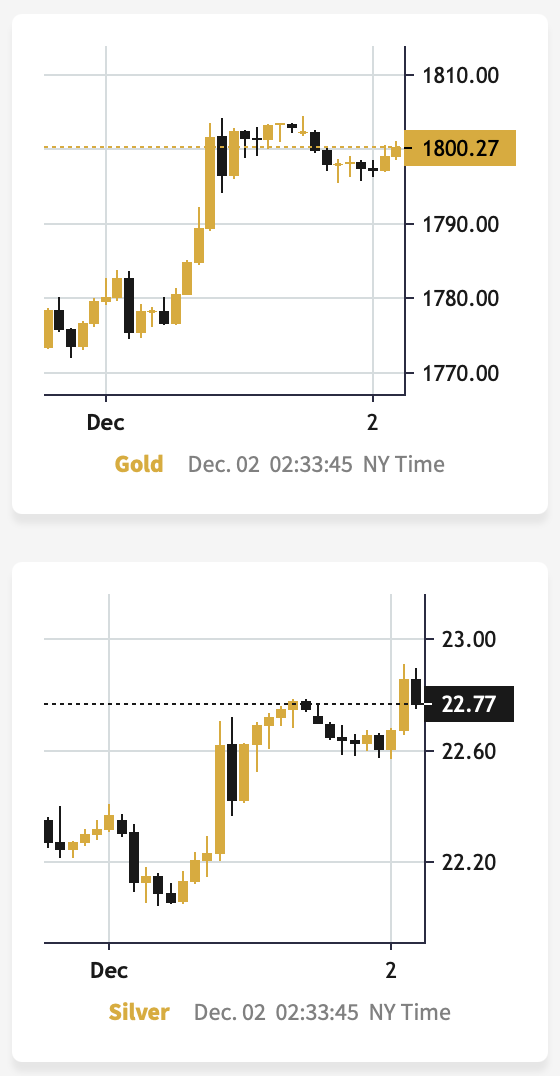
Silver moved higher to a much bigger extent than gold did in today’s pre-market trading, and while the size of both moves is not huge, it’s something that confirmed the previous indications, and it’s a bearish sign.
The reason is that the silver market is much smaller than the gold market is, and in addition to the above (and in relation to it), silver is much more popular with the investment public. The latter tends to buy close to the tops and sell close to the bottoms. Consequently, the particularly strong performance of the white metal indicates that the investment public is “buying like crazy,” and this, in turn, is a sign that a top is being formed.
The reaction (rally) to jobless claims yesterday is consistent with the preceding. Market participants are doing the opposite of what makes sense (so, it seems that it is the general public that is making the purchases). Weaker jobless claims mean the Fed has more leeway to raise interest rates, and higher real interest rates are one (the other is the USD Index) of the key fundamental drivers pointing to lower gold prices.
Thank you for reading our free analysis today. Please note that the above is just a small fraction of the full analyses that our subscribers enjoy on a regular basis. They include multiple premium details such as the interim targets for gold and mining stocks that could be reached in the next few weeks. We invite you to subscribe now and read today’s issue right away.
Sincerely,
Przemyslaw Radomski, CFA
Founder, Editor-in-chief


Gold Investment News
Delivered To Your Inbox
Free Of Charge
Bonus: A week of free access to Gold & Silver StockPickers.
Gold Alerts
More-
Status
New 2024 Lows in Miners, New Highs in The USD Index
January 17, 2024, 12:19 PM -
Status
Soaring USD is SO Unsurprising – And SO Full of Implications
January 16, 2024, 8:40 AM -
Status
Rare Opportunity in Rare Earth Minerals?
January 15, 2024, 2:06 PM

