
tools spotlight

-
If the Correction is Over, It Can Mean One Thing for the Gold Price
November 28, 2022, 9:24 AMWill the combination of gold’s, the USDX’s, and the S&P 500's recent behavior resume the downtrend in the gold market?
Magical 38.2%
In today’s analysis, I’ll cover other parts of the current puzzle: gold, the USD Index, and the stock market. In particular, the situation appears very interesting in the latter, so I’ll start with it.
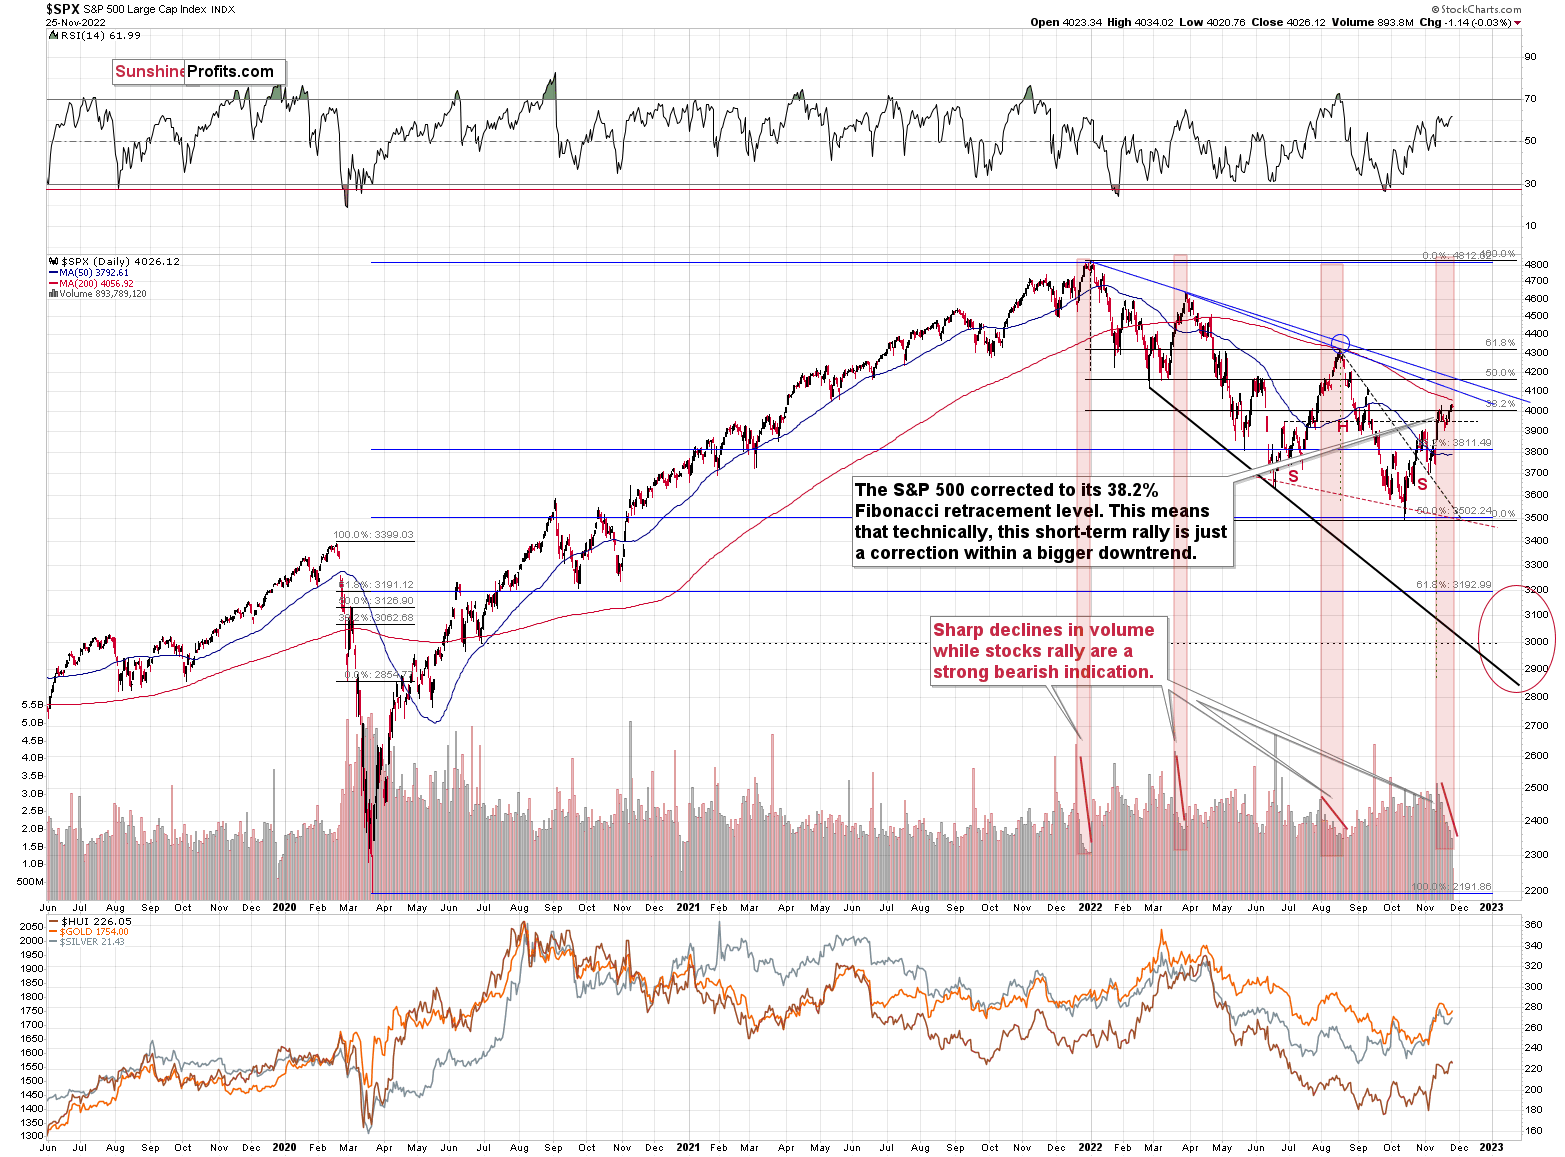
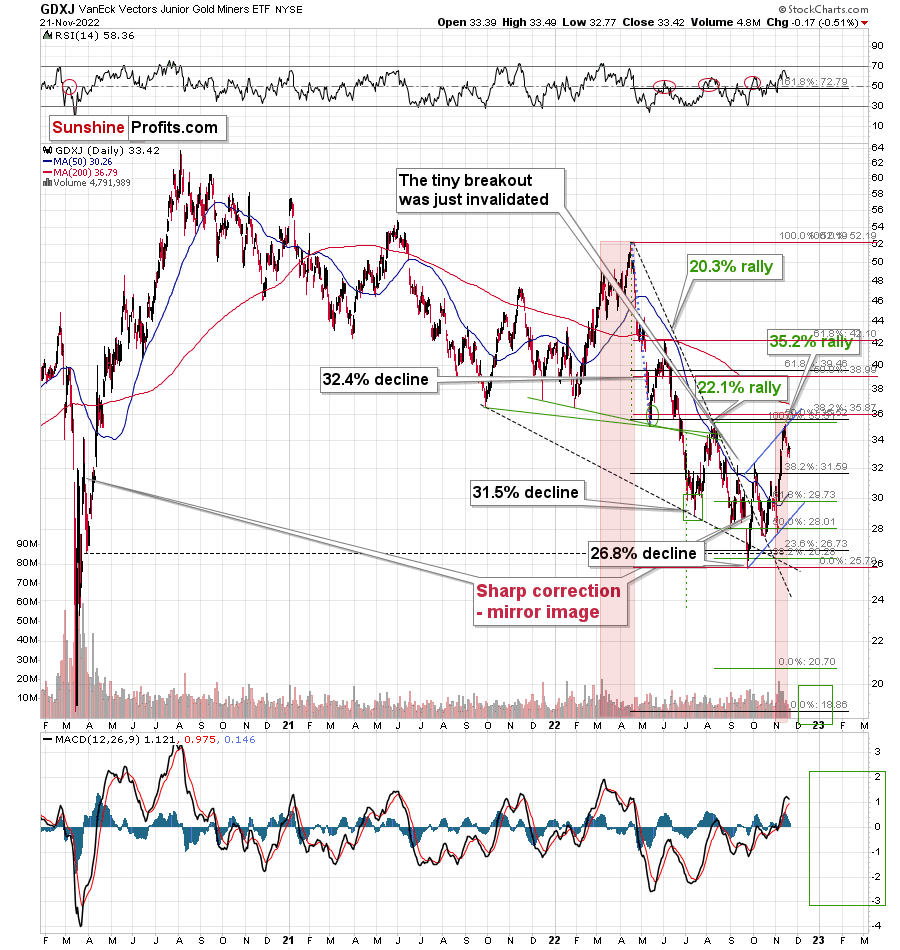
We just saw a small attempt to break above the 38.2% Fibonacci retracement, and I doubt that this breakout will be confirmed. The “why” behind it is currently the most interesting analogy that we see on this market.
Please take a look at the areas marked with red rectangles. In all those cases, the S&P 500 index rallied on big volume at first, and then the volume declined over the course of a few weeks. And as that happened, the price approached its top.
All three previous important tops that we saw this year were accompanied by this indication.
We also see it right now.
Even more interestingly, the volume levels that have just been seen are similar to the ones that accompanied previous tops.
Consequently, it seems that the end of the rally is near. This is likely to have very bearish implications for junior mining stocks.
Let’s check what’s up with gold.
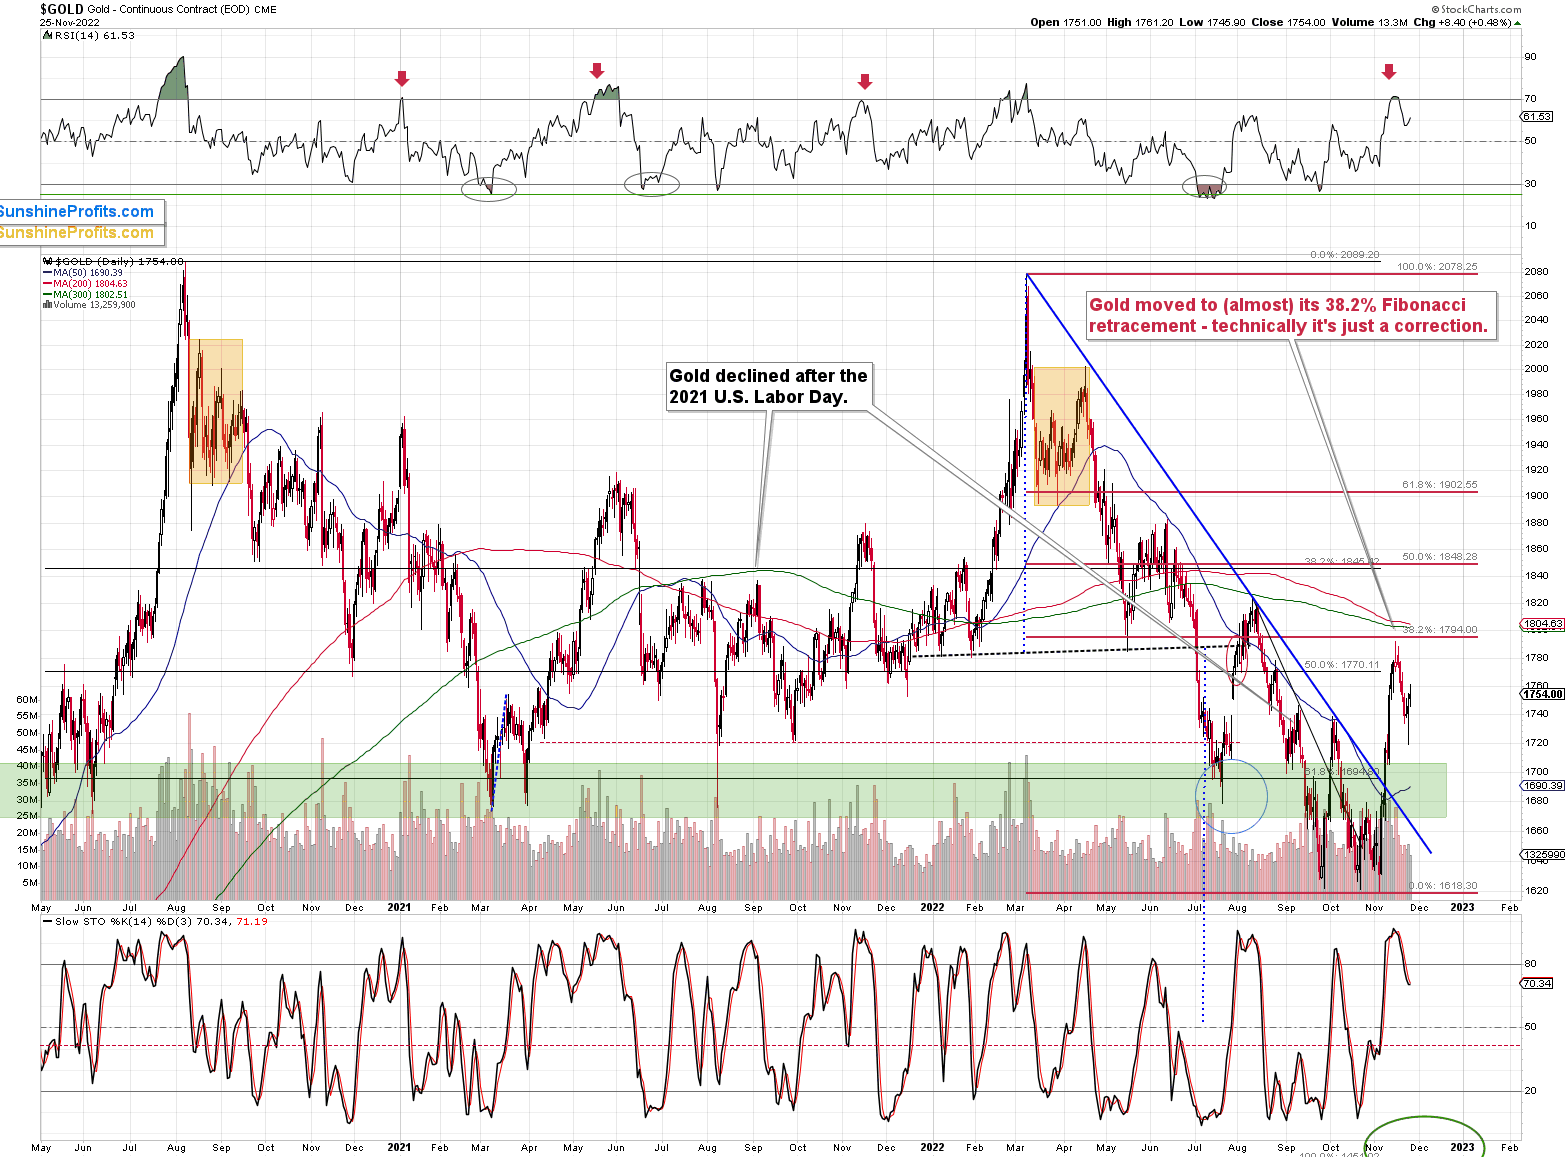
The yellow metal corrected 38.2% of its previous medium-term decline, and it declined once again. The moves that are smaller than 38.2% of the preceding move are generally viewed as “weak corrections,” indicating a market where the previous trend is very strong.
What’s Next?
As the correction appears to be over, the medium-term downtrend is now likely to resume. The RSI indicator clearly supports this outcome, as it just moved back below 70. When we previously saw similar signals, gold price usually plunged.
There’s one more thing that makes me predict that the gold price top is already in.
It’s gold’s link with the USD Index.
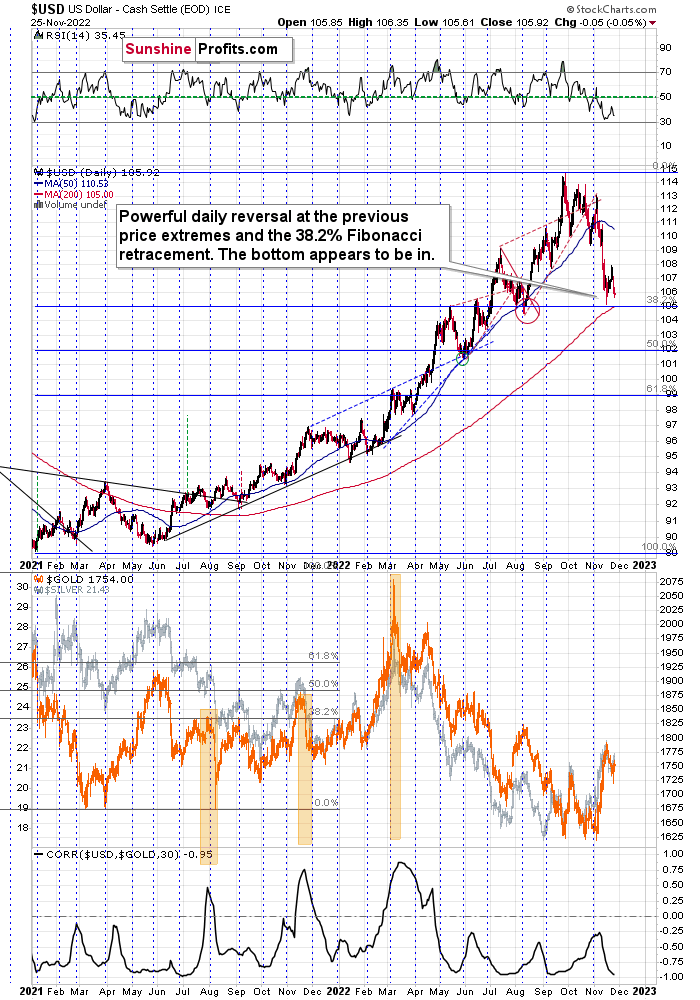
As you can see above, the USD Index just moved very close to its recent bottom. However, at the same time, gold and silver prices didn’t move back to their previous highs.
This kind of weak reaction to a factor that “should” move the market, indicates that the market really wants to move in the opposite direction.
In the current case, this indicates that gold wants to move lower.
Combining the above with the extremely negative correlation between gold and the USD Index (currently the 30-trading-day linear correlation coefficient is at -0.95, while -1 is the most negative that it could go), this indicates that when the USD Index rallies, gold would be likely to truly plunge – magnifying the U.S. dollar’s moves, but in the opposite direction.
All in all, the technical outlook for the precious metals sector appears to be very bearish for the coming weeks.
Thank you for reading our free analysis today. Please note that the above is just a small fraction of the full analyses that our subscribers enjoy on a regular basis. They include multiple premium details such as the interim targets for gold and mining stocks that could be reached in the next few weeks. We invite you to subscribe now and read today’s issue right away.
Sincerely,
Przemyslaw Radomski, CFA
Founder, Editor-in-chief -
Could Bitcoin’s Movements Indicate the Fall of Junior Gold Stocks?
November 23, 2022, 9:13 AMWhile comparing gold and bitcoin gives some idea of the patterns in the market, can the slide of junior miners be predicted by the same method?
Those of you who have been following my analyses for a while may be expecting me to write that it is based on the stock market's rally and thus only temporary, as miners will follow gold sooner rather than later. That’s their ultimate source of revenue (current or expected). While that’s true, right now there is another huge factor that’s likely contributing to the situation.
It's most likely the unfolding crypto-drama.
Remember when I previously commented on the link between juniors and cryptocurrencies? What I wrote back then was particularly important with regard to the less known (obscure?) ones with a shady background. In fact, some even call them “shitcoins.”
I wrote that for many individual investors, cryptocurrencies became the “new precious metals market.”
Alternative payment system? Just like gold, right?
There’s a flagship asset (gold, Bitcoin).
There’s a less expensive but obviously more useful asset (silver, Ethereum).
There are a number of little-known assets that are risky but have the potential to provide massive returns (high-quality mining stocks, low-quality mining stocks, especially low-quality junior mining stocks, altcoins, "shitcoins").While gold was not doing much, the wild rallies in cryptos got much more attention. That was finally exciting!
So, individual investors flocked from the precious metals market to cryptos. Not all investors, of course, but many.
While cryptos were on the rise and the overall sentiment was positive, investors dropped their PM holdings to buy cryptos as they forecasted that the latter would continue to rally “to the moon.” And while it didn’t matter that much for gold, as the yellow metal has powerful buyers and sellers that are not interested in cryptos, it mattered a lot to the junior mining stock sector as the buying power waned.
Fast-forward to the current situation, every other day we hear or read about yet another crypto scandal, while prices of cryptocurrencies are declining sharply.
This means that the above-mentioned effect could have been reversed. The investors who moved out of the junior mining stock sector in order to get into cryptos (in particular altcoins) could now be aiming to get out of that market (people tend to sell on declines, in fact, that’s why declines happen in the first place) and get back to what they “had liked” before – junior miners.
This specific phenomenon can be seen from a broader point of view when one compares the prices of gold and bitcoin.
As I wrote, the link is likely stronger in the case of altcoins and juniors, but gold and bitcoin have price data that’s more comparable, so that’s what I’m going to analyze.
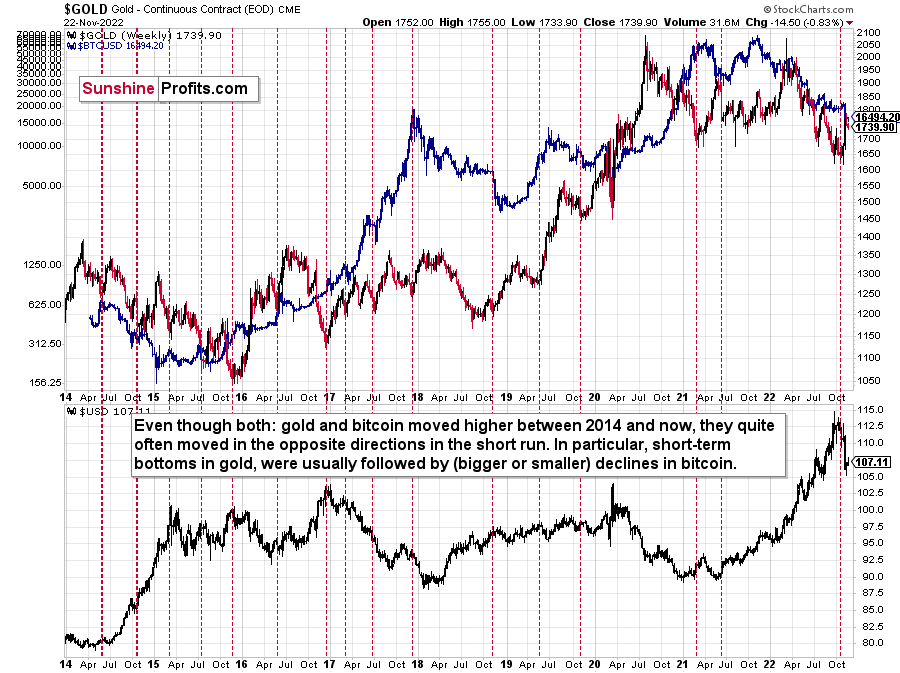
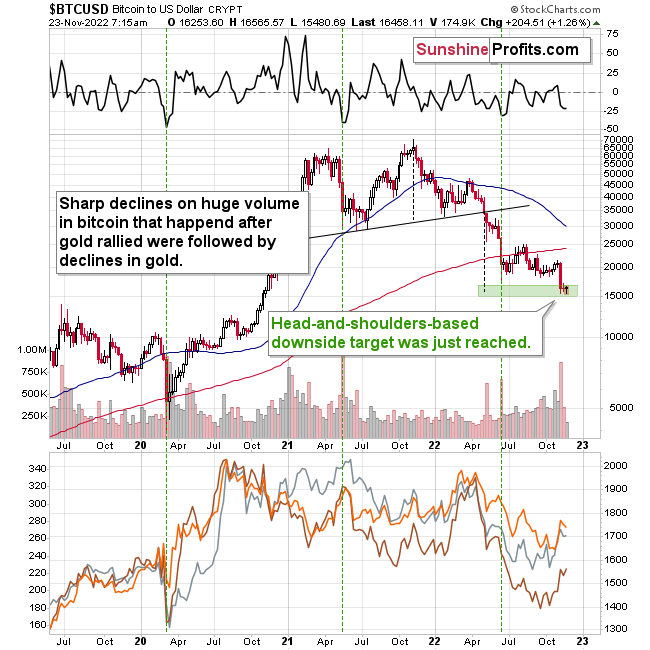
Even though both gold and bitcoin moved higher between 2014 and now, they quite often moved in opposite directions in the short run. Short-term bottoms in gold, in particular, were usually followed by (larger or smaller) declines in bitcoin.
Interestingly, I originally featured the above chart many months ago, and please note that this tendency worked like a charm recently.
Gold formed a short-term bottom, rallied, and now Bitcoin slides. Why? Probably because people were fed up with Bitcoin’s inability to hold its ground, while gold soared. So they flocked to gold, silver, and - probably most intensely so - to junior mining stocks.
All right, so does this mean that as Bitcoin slides into the abyss, junior miners are now going to soar?
No.
No market moves up or down in a straight line, right? Well, neither does Bitcoin. How low is too low, then? That’s where technicals come in.
Remember when I wrote that Bitcoin was topping at about $50,000? Well, it did move a bit above that, but it didn’t trade there for long.
The flagship crypto fell like a stone in water, and it did so in tune with the technical principles. Bitcoin formed a bearish head and shoulders top pattern, and after breaking below the neck level earlier this year, it then corrected a bit, and then it plunged below $20,000.
All this is a textbook-example of how a head and shoulders pattern should work.
Now, the size of the decline based on this pattern is likely to be equal to the size of its head. I marked that with dashed lines.
Guess what – Bitcoin just moved to this target level (marked with green) recently. That is a strong indication that the bottom has been reached.The second indication comes from the huge volume that just accompanied the decline and the fact that the decline was quite sharp. The ROC (rate of change) indicator at the top of the above chart is close to -25 and when this happened and bitcoin was after a huge-volume decline, it then rallied.
What is even more interesting is that those were also the times when gold declined.
The sentiment itself is the final indicator that a short-term (!) bottom for bitcoin is in or near. Just go to any news website and look at what is being written about Bitcoin – it’s all scary and bearish. Or at least the majority of news/articles. That's what happens when prices fall to their lowest point. Remember what was written on those same pages when bitcoin was trading above $50,000? It was all sunshine and rainbows. All this time, I warned about the incoming slide. Very few listened then, just as very few want to hear about the upcoming slide in junior mining stocks.
Anyway, here’s how frequently people search for “crypto scam” on Google (chart courtesy of Google Trends).
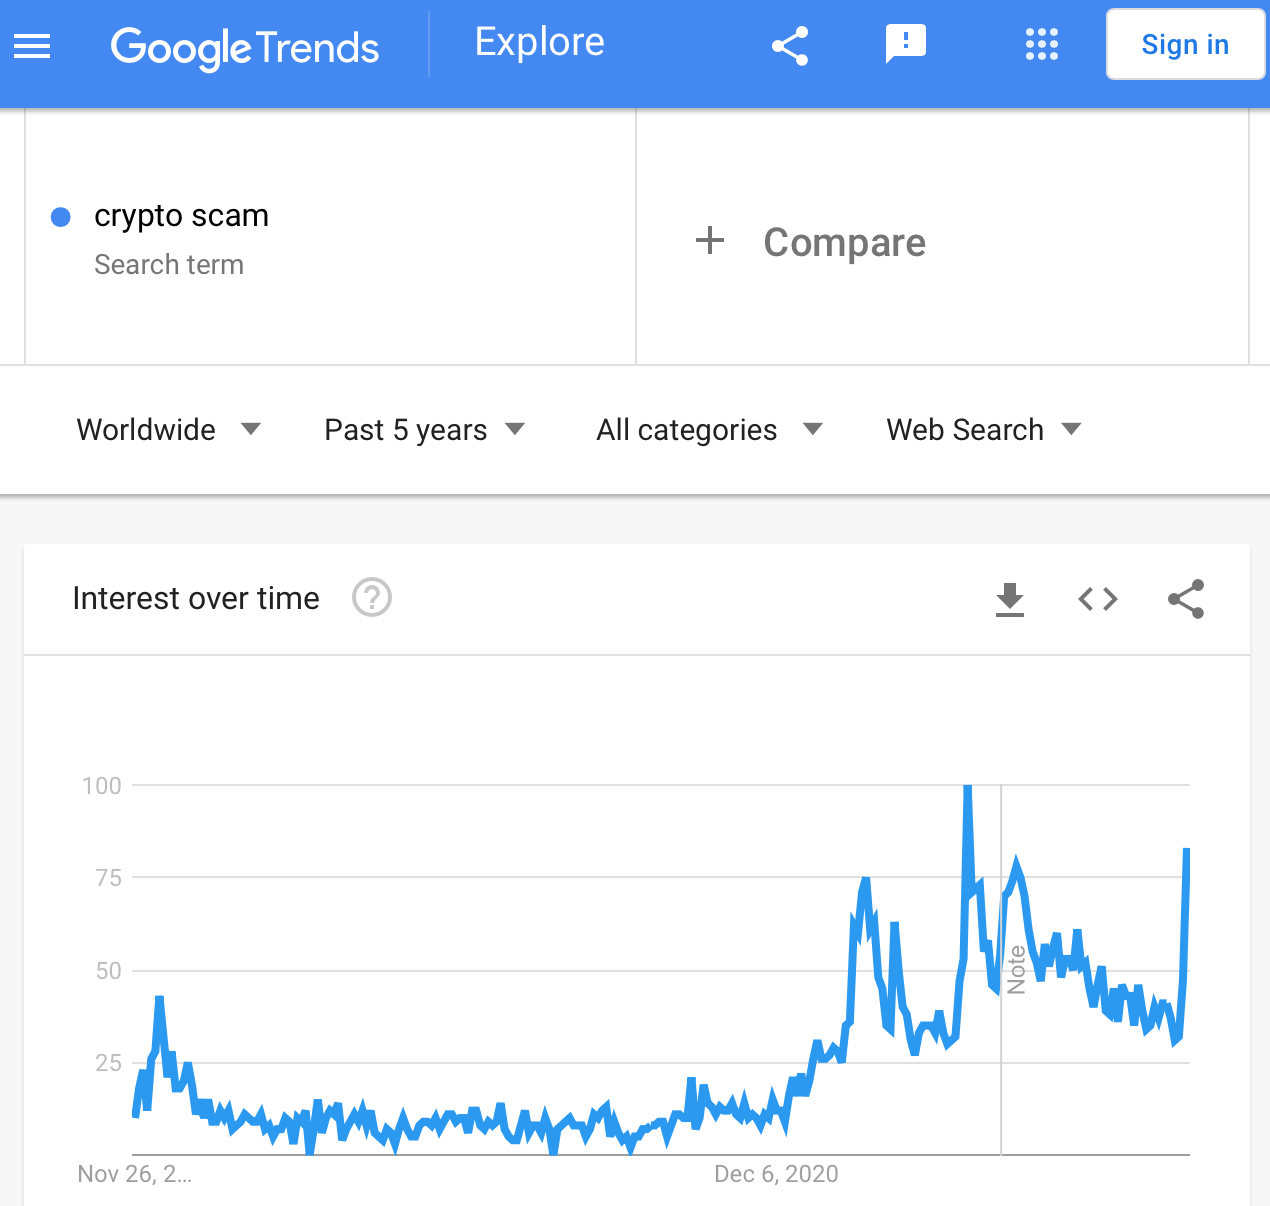
The other distinctive peaks in those searches were in May 2021 (a major top and major decline in Bitcoin), early November 2021 (a major top in Bitcoin), and the end of January 2022 (a major bottom in Bitcoin).
The interest was this high only when there were major turnarounds in Bitcoin. And since it’s crystal clear that the previous move in Bitcoin was to the downside, it can’t be a top. Therefore, it’s likely that there’s a major bottom in Bitcoin.
Not necessarily the final one, but a major one for some time. A bottom that’s big enough to trigger a sizable rally in Bitcoin… And a sizable decline in the precious metals sector!
It’s easy to follow the herd. “Miners good, Bitcoin bad” is the current word out there. It’s also easy to repeat this mantra. But what’s easy and what’s profitable are rarely the same thing, which is why many tend to lose money over time. I’m not saying that each and every price move can be predicted – it can’t. However, as time goes on, following logical analysis and paying attention not to follow the herd often pays huge dividends.
My responsibility is to keep you up to date on my market views, which I strive base on logical analyses free of bias. Whether it’s possible for a human to achieve this kind of objectivity is another question, but, as much as I can, I aim to deliver analysis that’s as objective as possible. Right now, the way I see it, Bitcoin appears to have formed a short-term bottom, and mining stocks have either formed a short-term top or are about to do so soon.
Of course, I can’t make any guarantees, but in my view, the next move lower in the precious metals sector – especially in the junior mining stocks – is likely to be something epic.
Thank you for reading our free analysis today. Please note that the above is just a small fraction of the full analyses that our subscribers enjoy on a regular basis. They include multiple premium details such as the interim targets for gold and mining stocks that could be reached in the next few weeks. We invite you to subscribe now and read today’s issue right away.
Sincerely,
Przemyslaw Radomski, CFA
Founder, Editor-in-chief -
If Gold Started Plunging, Is the Miners’ Fate Already Sealed?
November 22, 2022, 8:03 AMThe star pattern turned out to be an accurate prediction of gold's decline. If the dramatic downturn stage begun, what will happen to the GDXJ?
In yesterday’s analysis, I emphasized that gold’s shooting star reversal was a very bearish indication for gold. Indeed, gold declined. What’s next?
Quoting my yesterday’s analysis:
Last week was full of events, but the most important one clarified after Friday’s closing bell – gold formed a reversal “shooting star” candlestick.
The implications are just what you think they are. After a sharp run-up, the rally has run its course, and the yellow metal is now about to slide again.
Let’s take a closer look.

The corrective upswing was quite sizable and sharp. It was bigger than what we saw in July and August 2022, and this time, gold needed just two weeks to rally, instead of four.
Back in mid-2022, it then took gold three weeks to decline to more or less where the corrective rally started. So, yes, gold fell a bit faster than it had climbed.
History rhymes, so this time, the decline could be sharper than the rally as well. And since the rally took just two weeks… It looks like the next week or two might be very interesting for gold investors/traders. And bearish.
Actually, the next ~1.5 weeks because this week’s trading will be limited due to Thanksgiving.
You might be wondering why I forecast that the gold price would be about to “slide” instead of just moving lower in a more or less regular manner.
The analogy to what gold did in 2013 is one of the major reasons.
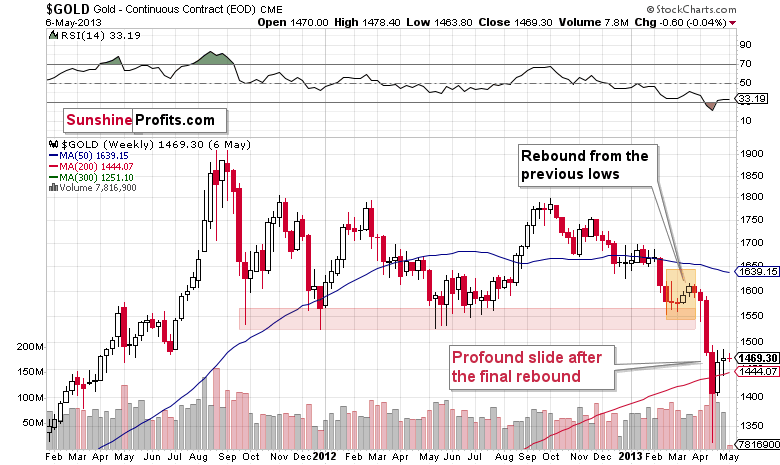
The first thing that you can notice on the above chart is that it looks just like the previous one, even though they are almost a decade apart. And that’s true.
How is that even possible, given different economic and geopolitical realities? It’s possible because the key drivers behind decisions to buy and sell remain the same: fear and greed. Those don’t change, people tend to react similarly to similar price/volume patterns.
Of course, each situation is specific, which is why history doesn’t repeat itself to the letter, but it does tend to rhyme.
When you compare the situations marked with orange on both charts, you’ll realize that we’re most likely in a situation where gold is just before a major slide.
Consequently, last week’s “shooting star” candlestick is not “just” a reversal pattern. It’s a reversal pattern that likely marks the beginning of a new stage of the bigger self-similar pattern. A stage that is characterized by a dramatic downswing.
Gold declined by almost $15 yesterday, so it seems that the above-mentioned decline is already underway.
Mining stocks haven’t declined profoundly yet, but that’s probably due to the fact that stock market prices haven't declined so far either.
As gold declines more, miners are likely to follow it lower pretty much regardless of what the stock market does, but still, it seems very likely to me that the latter will slide anyway. And yes, stock prices’ decline would be likely to result in much lower mining stock values.
In other words:
- If gold declines significantly but stocks don’t, miners are likely to decline significantly anyway.
- If gold and stocks decline significantly, miners are likely to decline in an extreme manner.
In my view, the latter is the most likely outcome for the following weeks/months.
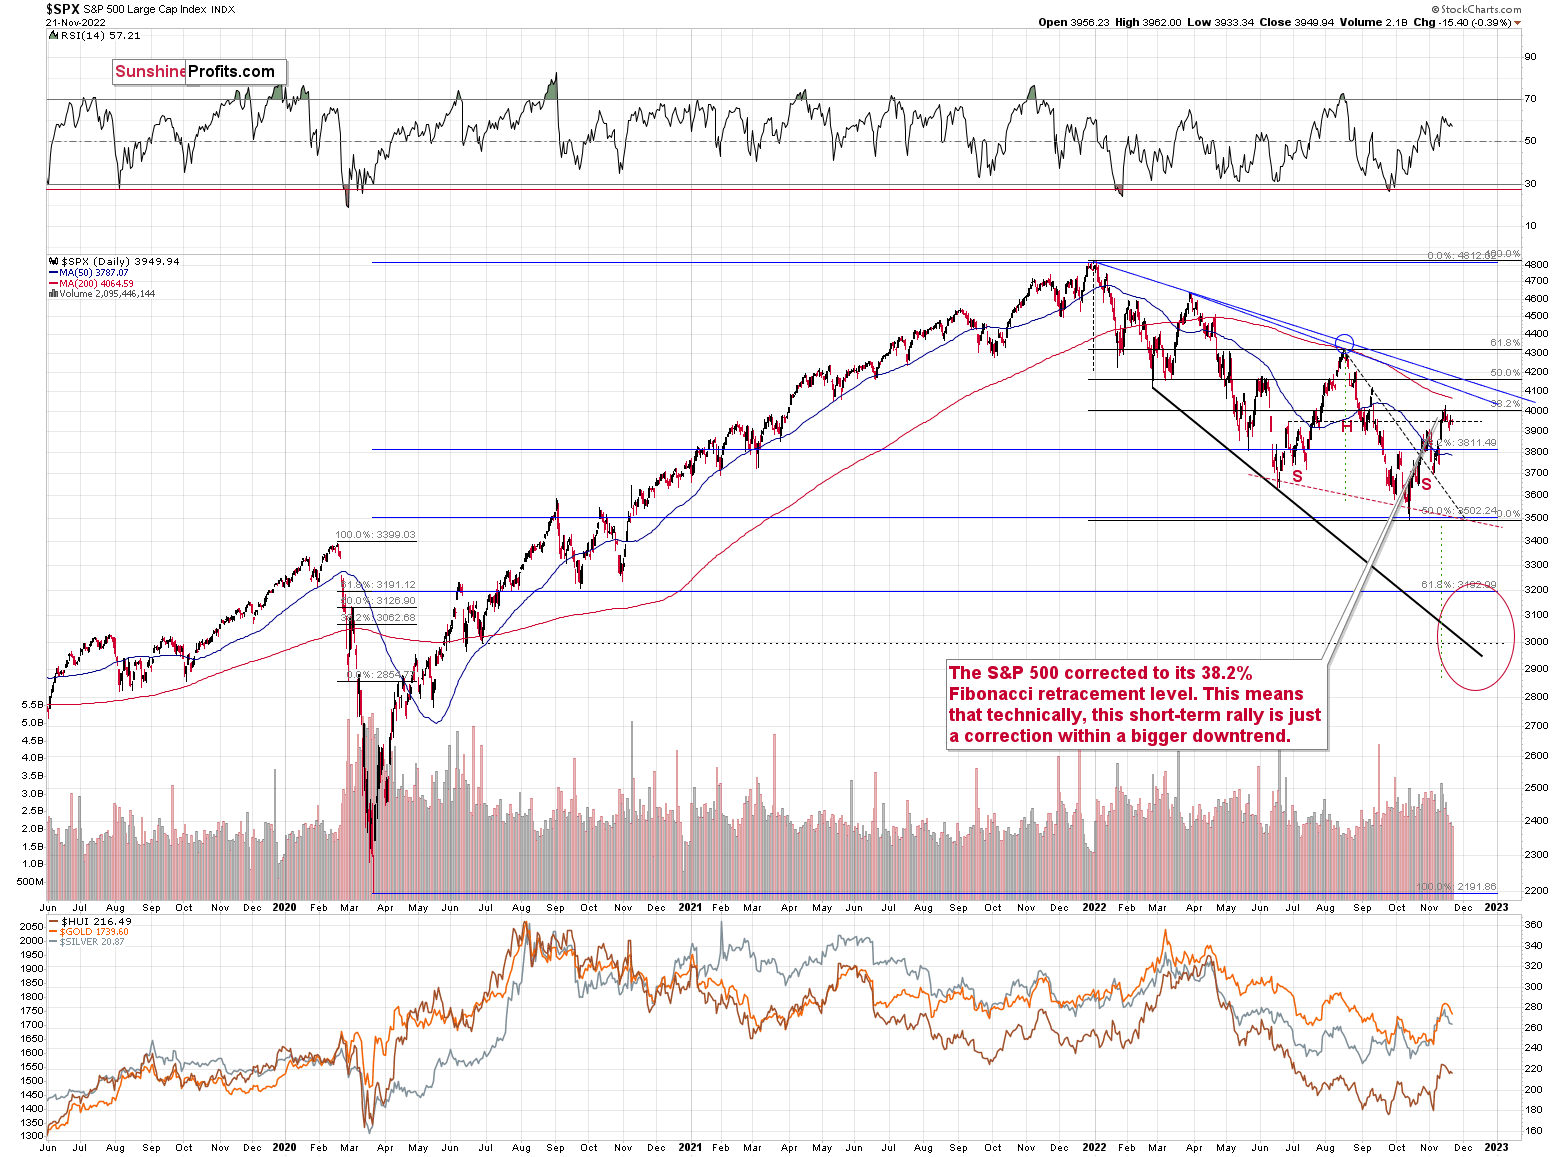
I previously wrote that the S&P 500 Index failed to break above the 4,000 level and its 38.2% Fibonacci retracement level. At the moment of writing these words, the S&P 500 futures are trading at about 3,950. This resistance remains intact. Stocks have been unable to move above those levels, which means that the bearish implications of their failed attempt remain in place.
The current medium-term trend remains down, and the above paragraph indicates that it’s about to resume.
As I wrote earlier, this is likely to have profoundly bearish implications for mining stocks. It’s also the case with regard to silver prices, but let’s keep in mind that silver tends to catch up with gold and mining stocks in the final part of a given move. Consequently, miners could decline profoundly first, and silver could decline profoundly a bit later.
Thank you for reading our free analysis today. Please note that the above is just a small fraction of the full analyses that our subscribers enjoy on a regular basis. They include multiple premium details such as the interim targets for gold and mining stocks that could be reached in the next few weeks. We invite you to subscribe now and read today’s issue right away.
Sincerely,
Przemyslaw Radomski, CFA
Founder, Editor-in-chief -
Gold Price Formed a Bearish Star, and It’s Not Even Christmas Yet
November 21, 2022, 5:18 AMLast week was full of events, but the most important one clarified after Friday’s closing bell – gold formed a reversal “shooting star” candlestick.
The implications are just as you think they are. After a sharp run-up, the rally has run its course, and the yellow metal is now about to slide again.
Let’s take a closer look.
Gold Analysis
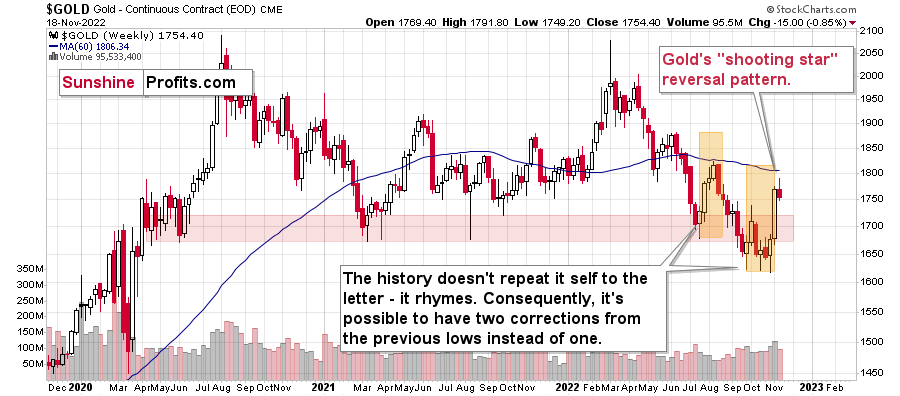
The corrective upswing was quite sizable and sharp. It was bigger than what we saw in July and August 2022, and this time, gold needed just two weeks to rally, instead of four.
Back in mid-2022, it then took gold three weeks to decline to more or less where the corrective rally started. So, yes, gold fell a bit faster than it had climbed.
History rhymes, so this time, the decline could be sharper than the rally as well. And since the rally took just two weeks… It looks like the next week or two might be very interesting for gold investors/traders. And bearish.
Actually, the next ~1.5 weeks because this week’s trading will be limited due to Thanksgiving.
You might be wondering, why I forecasted that the gold price would be about to “slide”, instead of just moving lower in a more or less regular manner.
The analogy to what gold did in 2013 is one of the major reasons.
The first thing that you can notice on the above chart is that it looks just like the previous one, even though they are almost a decade apart. And that’s true.
How is that even possible, given different economic and geopolitical realities? It’s possible because the key drivers behind decisions to buy and sell remain the same: fear and greed. Those don’t change, people tend to react similarly to similar price/volume patterns.
Of course, each situation is specific, which is why history doesn’t repeat itself to the letter, but it does tend to rhyme.
When you compare the situations that I marked with orange on both charts, you’ll realize that we’re currently likely in a situation where gold is just before its major slide.
Consequently, last week’s “shooting star” candlestick is not “just” a reversal pattern. It’s a reversal pattern that likely marks the beginning of a new stage of the bigger self-similar pattern. A stage that is characterized by a dramatic downswing.
There were many other confirmations of the bearish case, but the above-mentioned link (and the one to 2008) are the most important ones, in my view. One of the remaining indications came from the silver market.
Silver Analysis
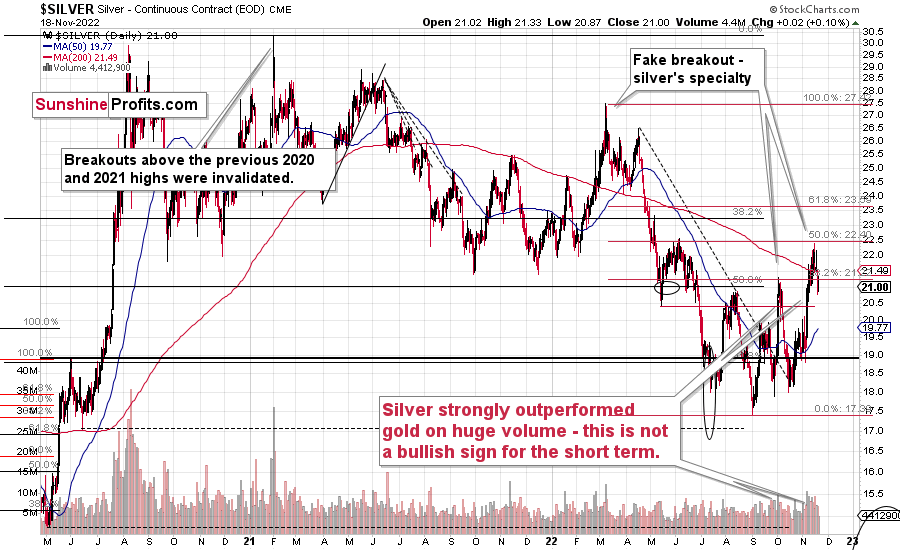
The white metal moved a lot during this recent upswing, and while most markets (stock prices, the USD Index, mining stocks) corrected ~38.2% of the preceding moves (that’s one of the classic Fibonacci retracements), silver corrected about 50% of the preceding decline.
This might appear bullish, but it’s not. Silver’s short-term outperformance of gold has proven to be a bearish indication over and over again. Consequently, forecasting higher silver prices based on the fact that it has just rallied significantly (and that it outperformed gold) is usually a bad idea.
Have We Reached the Top?
Before summarizing, I would like to recall two recent situations (one more recent than the other). Earlier this month, I received quite a few questions about the increase in the official sector’s purchases of gold – whether it was bullish. I replied that it was not bullish because the governments and monetary authorities tend to be the worst investors. They tend to buy close to the top, and they tend to sell close to the bottom.
I used the Brown Bottom as an example - the huge sale of gold reverses over 20 years ago that marked to bottom of gold prices and launched a multi-year bull market).
Interestingly, we recently saw a confirmation of this tendency – from a different market, but still. Namely, the President of El Salvador decided to make Bitcoin the country’s legal tender. That happened just a few months before Bitcoin formed its all-time high – from which it fell by over 70%.
Now, while I don’t think that gold made an all-time high recently, taking the two together makes it even more likely that gold is not about to rally in the medium term, but decline. The long-term outlook for gold remains very bullish – in my view, we just need to wait for it a bit longer (in terms of months).
Thank you for reading our free analysis today. Please note that the above is just a small fraction of the full analyses that our subscribers enjoy on a regular basis. They include multiple premium details such as the interim targets for gold and mining stocks that could be reached in the next few weeks. We invite you to subscribe now and read today’s issue right away.
Sincerely,
Przemyslaw Radomski, CFA
Founder, Editor-in-chief


Gold Investment News
Delivered To Your Inbox
Free Of Charge
Bonus: A week of free access to Gold & Silver StockPickers.
Gold Alerts
More-
Status
New 2024 Lows in Miners, New Highs in The USD Index
January 17, 2024, 12:19 PM -
Status
Soaring USD is SO Unsurprising – And SO Full of Implications
January 16, 2024, 8:40 AM -
Status
Rare Opportunity in Rare Earth Minerals?
January 15, 2024, 2:06 PM

