

Briefly: in our opinion, full (300% of the regular position size) speculative short positions in junior mining stocks are justified from the risk/reward point of view at the moment of publishing this Alert.
Almost everything I wrote and said yesterday also is still relevant today.
In Tuesday’s analysis, I wrote the following about the USD Index:
For example, the USD Index could decline to its strong support level at the 38.2% Fibonacci retracement and the August 2022 low as well as the May 2022 high. Such a move would likely imply the RSI at about 30, which would be a crystal-clear signal for many traders that the bottom is in.
To clarify, if that happened, the USD Index would be as oversold from a short-term point of view as it was at its 2021 bottom – when it was trading at about 90.
Despite the intraday attempt to move lower, the support held.
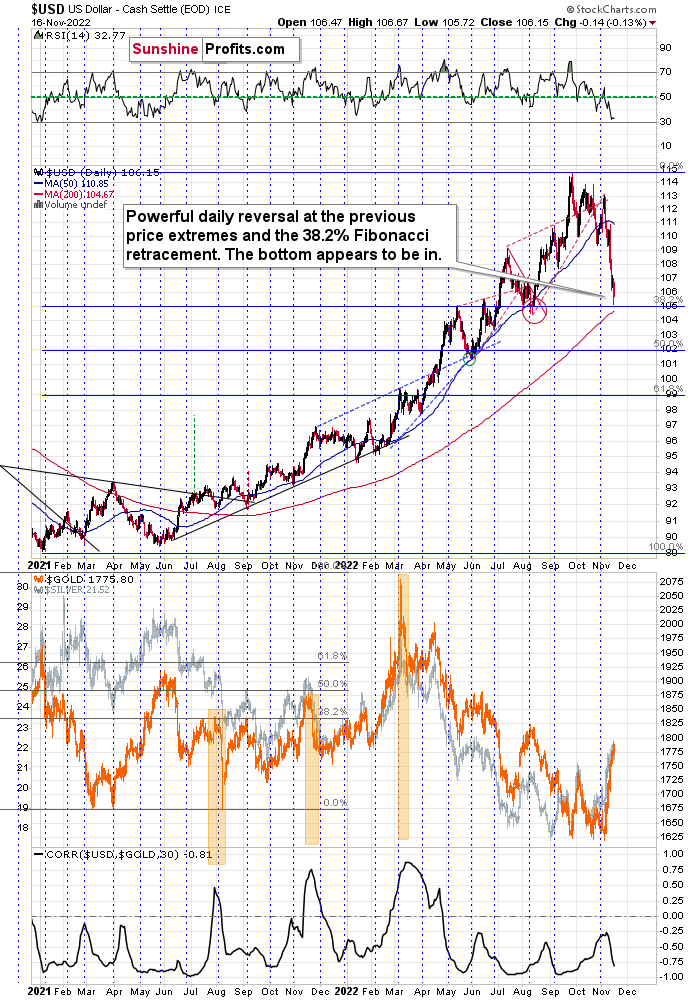
Consequently, what I wrote below the USDX chart yesterday remains up-to-date:
The USDX moved very close to the above-mentioned support levels, and it moved back up before the end of the day. The only reason that the RSI didn’t move to 30 is because the USDX declined only on an intraday basis. This means that from the RSI’s point of view, the situation is only “very bullish,” not extremely so. However, given the reversal nature of yesterday’s session, the outlook just became even more bullish, and it seems to me that the bottom is in.
This means that the top in the precious metals market is also likely in or at hand, especially given the S&P 500’s inability to break through its own 38.2% Fibonacci retracement.
Despite the USD Index closing a bit lower than on Tuesday, the GDXJ closed the day over 1% lower.
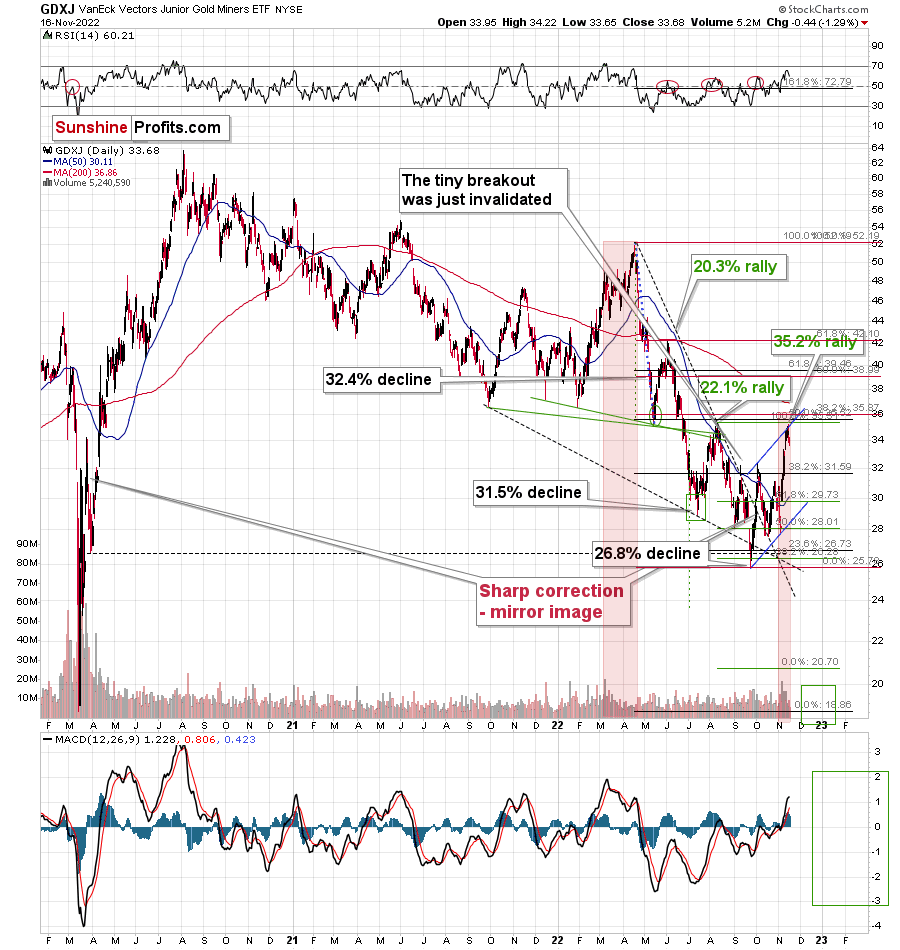
As I said and wrote earlier, the precious metals market appears to have topped.
Interestingly, it appears that the classic Elliott-wave pattern has just been completed and that a new massive wave down is about to take occur.
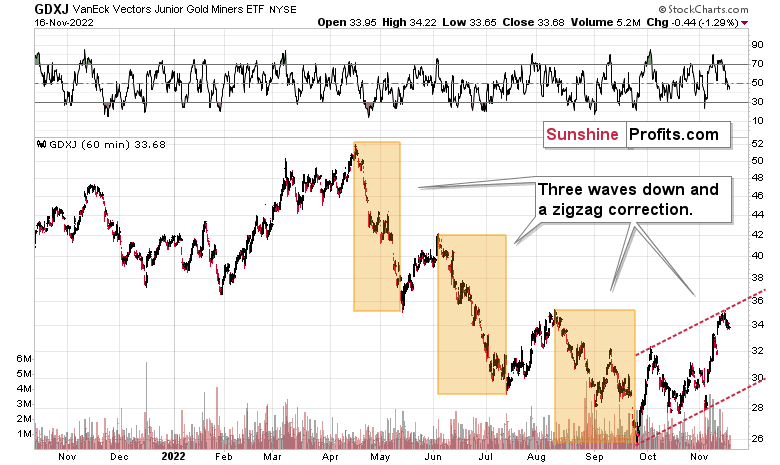
The classic EWT pattern is three waves down (I marked those with an orange rectangle) and then a correction consisting of two smaller waves.
That’s exactly what we have seen in recent months. The September–now pattern appears to be the above-mentioned correction. It didn’t only consist of two smaller waves higher – they were actually almost identical in terms of size and sharpness. This created a classic ABC correction (flag) pattern.
Now, since this pattern is complete, another huge 3-stage move lower can – and is likely – to unfold. This is very bearish for junior mining stocks (as well as for gold, silver, and probably other commodities and stocks), and the fact that juniors are already showing weakness relative to gold (the latter was almost flat yesterday, while miners declined) serves as a bearish confirmation. As always, I can’t guarantee anything, but in my view, the profits that can be reaped on this upcoming slide can be enormous.
Having said that, let’s take a look at the market from a more fundamental point of view.
Slowly but Surely
With the GDXJ ETF suffering another daily drawdown and the S&P 500 also ending the Nov. 16 session lower, bullish sentiment is clashing with deteriorating fundamentals. Moreover, with misguided pivot optimism languishing, investors are slowly realizing that the U.S. federal funds rate (FFR) is likely far from its medium-term peak. To explain, I wrote on Aug. 1:
While the consensus assumes the Fed is near the end of its rate hike cycle, the Consumer Price Index (CPI) is on the fast track to 2% and a 3% FFR will be enough to capsize inflation, market participants are living in fantasy land.
For example, I’ve warned on numerous occasions that demand is much stronger than the consensus realizes. With Americans’ checking account balances at unprecedented all-time highs and the Atlanta Fed’s wage growth tracker hitting an all-time high in June, the FFR needs to go meaningfully above 3%. To explain, I wrote on Jul. 25:
With more earnings calls showcasing how the situation continues to worsen, market participants don’t realize that the U.S. federal funds rate needs to hit ~4.5% or more for the Fed to materially reduce inflation. For context, the consensus expects a figure in the 2.5% to 3.5% range.
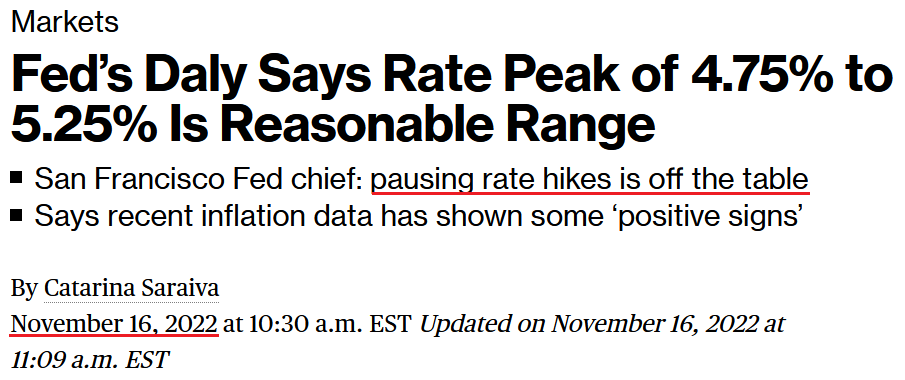
To that point, San Francisco Fed President Mary Daly said on Nov. 16:
“Pausing is off the table right now, it’s not even part of the discussion. Right now, the discussion is, rightly, in slowing the pace (…). The holding part is really important. It is a raise-to-hold [FFR] strategy.”
Thus, while I warned that the FFR would rise much more than investors expected, Daly agrees. In addition, with the crowd still underestimating inflation, don’t be surprised if our 2023 FFR estimate of 4.5% to 5.5% proves too low when it’s all said and done.
Please see below:
 Source: Bloomberg
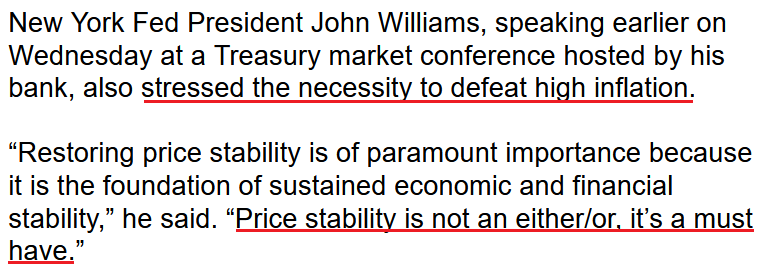
Likewise, even New York Fed President John Williams (a major dove) said on Nov. 16 that reducing inflation “is of paramount importance.”
Please see below:
 Source: Bloomberg
So, while the crowd continues to anticipate a phantom pivot, the reality is that growth, inflation, and employment are nowhere near levels that would support a dovish 180; and while investors often take small victories and extrapolate a trend, the Consumer Price Index (CPI) has only underperformed expectations in two of the last 12 months.
Furthermore, the Atlanta Fed’s Sticky CPIs remain at their 2022 highs. Therefore, investors’ unrealistic expectations should lead to material re-pricings of gold, silver, mining stocks, and the S&P 500 over the medium term.
The Splurge
While I warned throughout 2021 and 2022 that resilient demand would keep inflation uplifted, we once again find ourselves in a situation where the crowd is ready to claim victory. However, while some inflation progress has occurred, history shows the CPI doesn’t magically fall from 9% to 2%.
Moreover, with the recent data supporting the argument, the current optimism is doomed to fail. To explain, I wrote on Mar. 31:
There is a misnomer in the financial markets that inflation is a supply-side phenomenon. In a nutshell: COVID-19 restrictions, labor shortages, and manufacturing disruptions are the reasons for inflation’s reign. As such, when these issues are no longer present, inflation will normalize and the U.S. economy will enjoy a “soft landing.”
However, investors’ faith in the narrative will likely lead to plenty of pain over the medium term. For example, I’ve noted for some time that the U.S. economy remains in a healthy position; and with U.S. consumers flush with cash and a red hot labor market helping to bloat their wallets, their propensity to spend keeps economic data elevated.
Likewise, while most investors assumed that consumer spending and inflation would fall off a cliff when enhanced unemployment benefits ended in September, the reality is that neither will die easy.
To that point, the U.S. Census Bureau released its retail sales report on Nov. 16; and with the metric hitting a new all-time high and outperforming expectations, investors still underestimate Americans’ ability and willingness to spend.
Please see below:
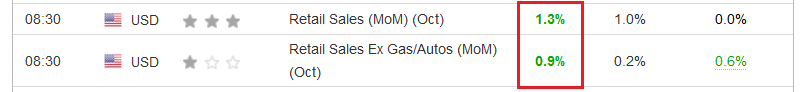 Source: Investing.com
Also, the resiliency of demand highlights why wage and output inflation should remain uplifted and force the FFR higher.
Please see below:
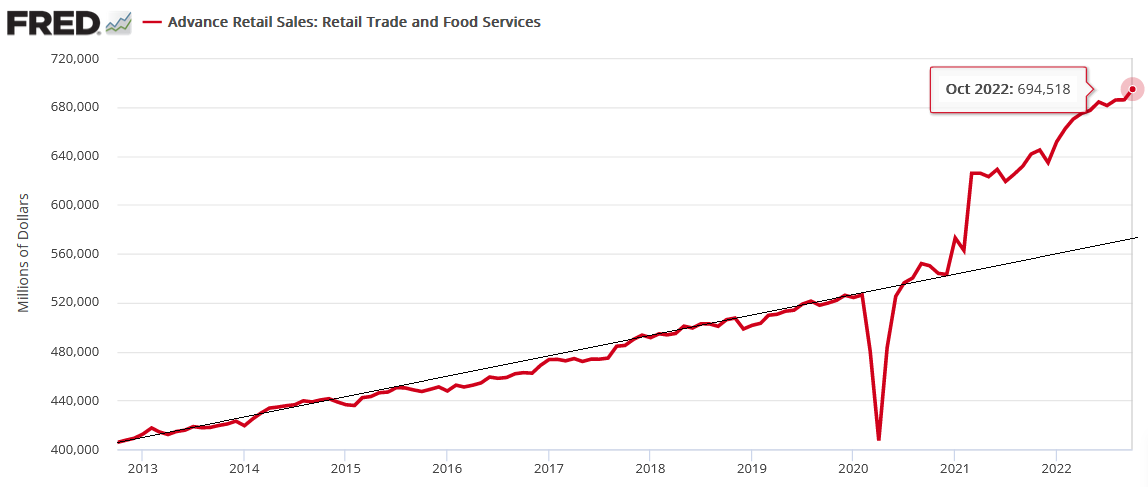
To explain, the red line above tracks the dollar value of U.S. retail sales. If you analyze the right side of the chart, you can see that the Fed’s 15 25 basis point rate hikes in 2022 have done little to slow down American consumers.
Furthermore, the black line above approximates retail sales’ 10-year trend. If you focus your attention on the post-pandemic decoupling, you can see that the red line continues to run away from the black line; and while ZeroHedge may proclaim that consumers are “tapped out,” the narrative couldn’t be further from the truth. As a result, the Fed has achieved very little in its bid to cool demand.
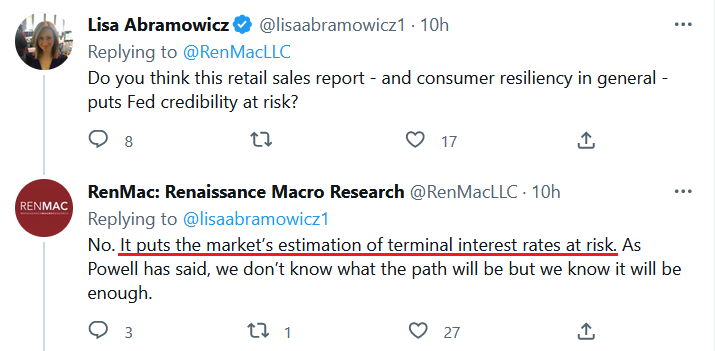
Speaking of which, even Renaissance Macro – which was late to the inflation party – sees the fundamental writing on the wall.
Please see below:
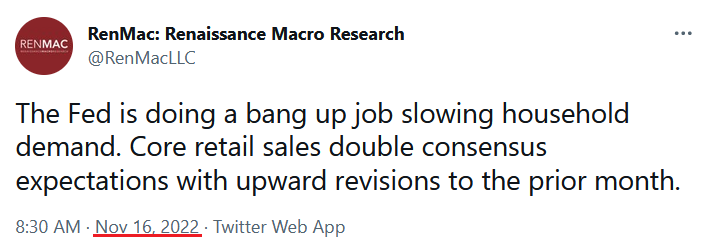
On top of that, when Bloomberg anchor Lisa Abramowicz replied to the tweet, RenMac’s response aligned with ours: the consensus underestimates the peak FFR and the amount of time it needs to remain restrictive.
Please see below:
As further evidence, Mastercard released its SpendingPulse U.S. retail sales report on Nov. 15. For context, it measures Americans’ spending “across all forms of payment,” not just credit cards. An excerpt read:
“October U.S. retail sales excluding automotive increased 9.5% year-over-year (YoY) and 23.6% compared to October 2019. E-commerce sales in October grew 12.7% YoY and 96.0% Yo3Y. Experiential sectors including Restaurants, Airlines and Lodging all saw double-digit growth compared to both 2021 and 2019.”
Please see below:
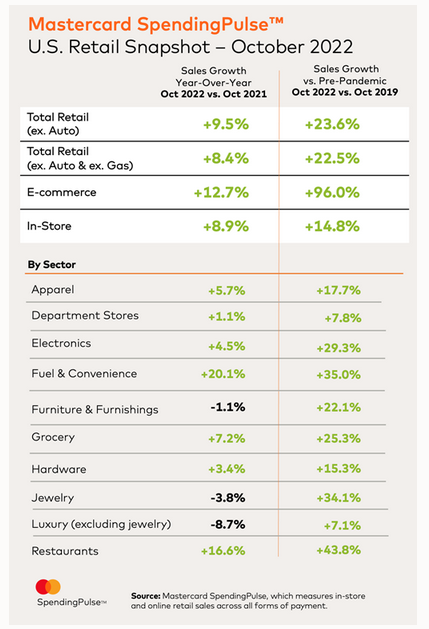
Furthermore, the report stated:
“With many big-box retailers, department stores and outlet malls closed again on Thanksgiving Day, consumers will be gearing up for the main event – a Black Friday shopping blitz…. U.S. retail sales excluding automotive is expected to grow +15% on Black Friday compared to last year.”
So, while narratives move markets in the short term, please remember that the fundamentals lead the Fed; and unless real GDP growth and the U.S. labor market crash over the next few months (which is highly unlikely), the revolving door of consumer demand supporting wage inflation will continue to spin. As such, the pivot crowd lacks objectivity, and their desire for a dovish 180 results in uninformed investment decisions.
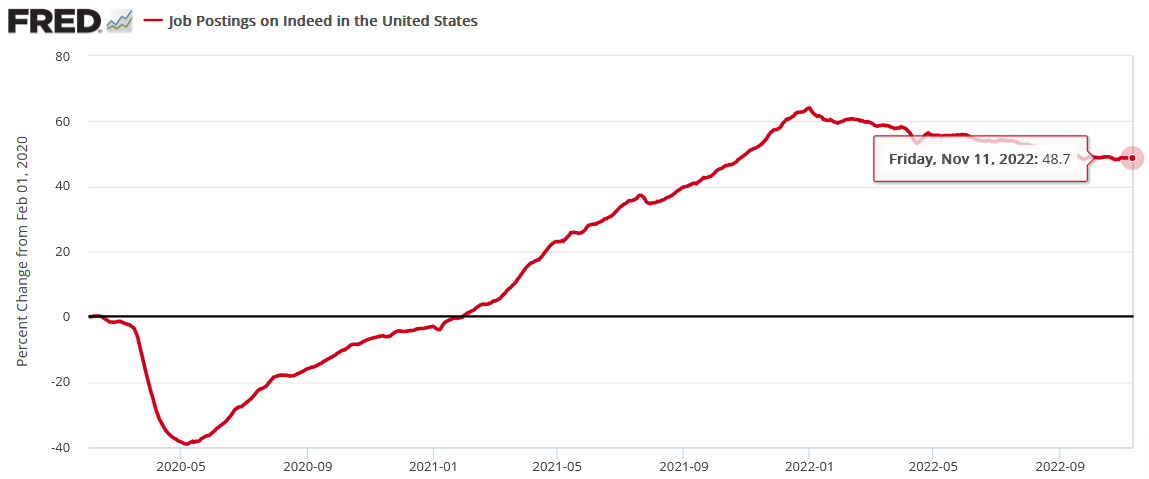
Finally, with consumer spending covered, I noted on Nov. 16 that the U.S. labor market remains on solid footing. I wrote:
Only a major recession that culminates with a collapse in the U.S. labor market should prompt the Fed to cut the FFR; and with Indeed revealing on Nov. 14 that U.S. job postings on its site are still 48.7% above its pre-pandemic baseline (for the week ending Nov. 11), we’re far from that level of demand destruction.
In addition, the New York Fed’s Empire State Manufacturing Survey was also constructive. I added:
“The index for number of employees climbed five points to 12.2, pointing to an increase in employment levels. The average workweek index edged up to 6.9, signaling a small increase in hours worked.”
Please see below:
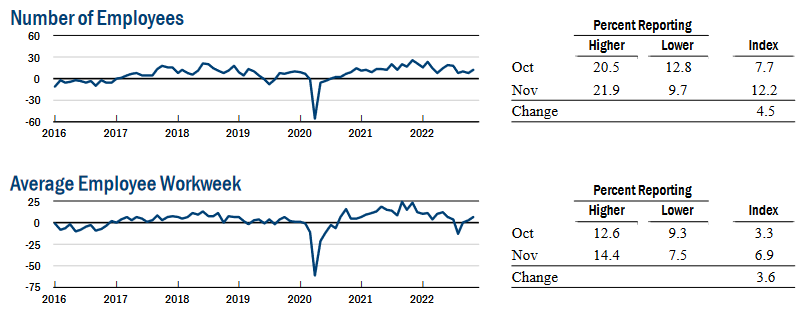 Source: New York Fed
Therefore, with real GDP growth the only unsolved variable, the latest update from the Atlanta Fed on Nov. 16 was also bullish for the FFR, real yields and the USD Index. An excerpt read:
“The GDPNow model estimate for real GDP growth (seasonally adjusted annual rate) in the fourth quarter of 2022 is 4.4 percent on November 16, up from 4.0 percent on November 9. After this morning’s retail sales release from the U.S. Census Bureau, the nowcast of fourth-quarter real personal consumption expenditures growth increased from 4.2 percent to 4.8 percent.”
Please see below:
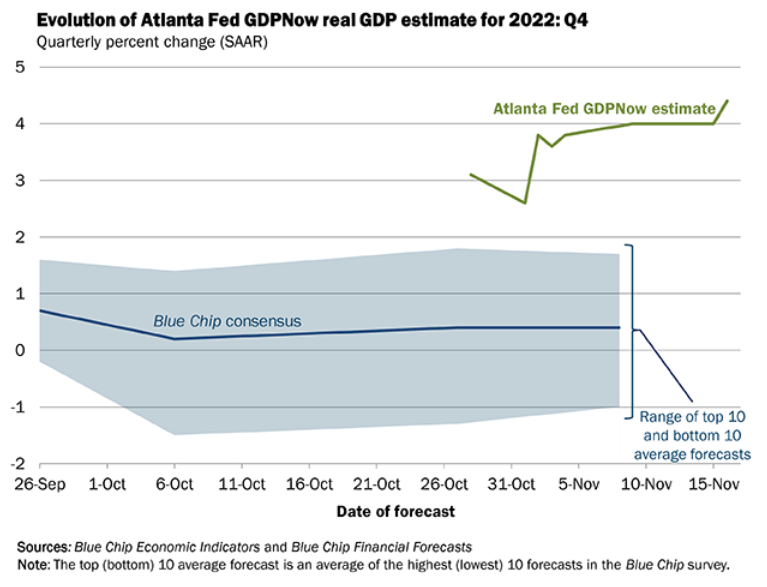
To explain, the green line above tracks the Atlanta Fed’s Q4 real GDP growth estimate, while the blue line above tracks the Blue Chip consensus estimate (investment banks). If you analyze the right side of the chart, you can see that the green line is moving in a hawkish, not dovish, direction.
As such, while the projection can change in the weeks ahead, the important point is that a confluence of recent data supports more hawkish policy, not less; and while the market narrative proclaims the opposite, 2022 has been filled with periods where misguided investors bought hope and sold reality. Thus, we’re likely witnessing another example right now.
The Bottom Line
While much has changed from a sentiment perspective, the fundamentals have barely budged: inflation is well above the Fed’s 2% target, consumers continue to spend, the U.S. labor market remains resilient, and the Atlanta Fed's real GDP growth expectation has increased. As a result, this is the opposite of what a pivot environment looks like, and the crowd should learn this lesson the hard way over the medium term.
In conclusion, the PMs were mixed on Nov. 16, as silver ended the day in the green. However, investors are misreading the fundamentals, and their expectations for rate cuts contrast with the realities confronting the U.S. economy. So, seasonality is the only thing the stock market bulls have going for them right now.
Overview of the Upcoming Part of the Decline
- It seems to me that the corrective upswing is over (or about to be over) and that the next big move lower is already underway (or that it’s about to start).
- If we see a situation where miners slide in a meaningful and volatile way while silver doesn’t (it just declines moderately), I plan to – once again – switch from short positions in miners to short positions in silver. At this time, it’s too early to say at what price levels this could take place and if we get this kind of opportunity at all – perhaps with gold prices close to $1,500 - $1,550.
- I plan to switch from the short positions in junior mining stocks or silver (whichever I’ll have at that moment) to long positions in junior mining stocks when gold / mining stocks move to their 2020 lows (approximately). While I’m probably not going to write about it at this stage yet, this is when some investors might consider getting back in with their long-term investing capital (or perhaps 1/3 or 1/2 thereof).
- I plan to return to short positions in junior mining stocks after a rebound – and the rebound could take gold from about $1,450 to about $1,550, and it could take the GDXJ from about $20 to about $24. In other words, I’m currently planning to go long when GDXJ is close to $20 (which might take place when gold is close to $1,450), and I’m planning to exit this long position and re-enter the short position once we see a corrective rally to $24 in the GDXJ (which might take place when gold is close to $1,550).
- I plan to exit all remaining short positions once gold shows substantial strength relative to the USD Index while the latter is still rallying. This may be the case with gold prices close to $1,400 and GDXJ close to $15 . This moment (when gold performs very strongly against the rallying USD and miners are strong relative to gold after its substantial decline) is likely to be the best entry point for long-term investments, in my view. This can also happen with gold close to $1,400, but at the moment it’s too early to say with certainty.
- The above is based on the information available today, and it might change in the following days/weeks.
You will find my general overview of the outlook for gold on the chart below:
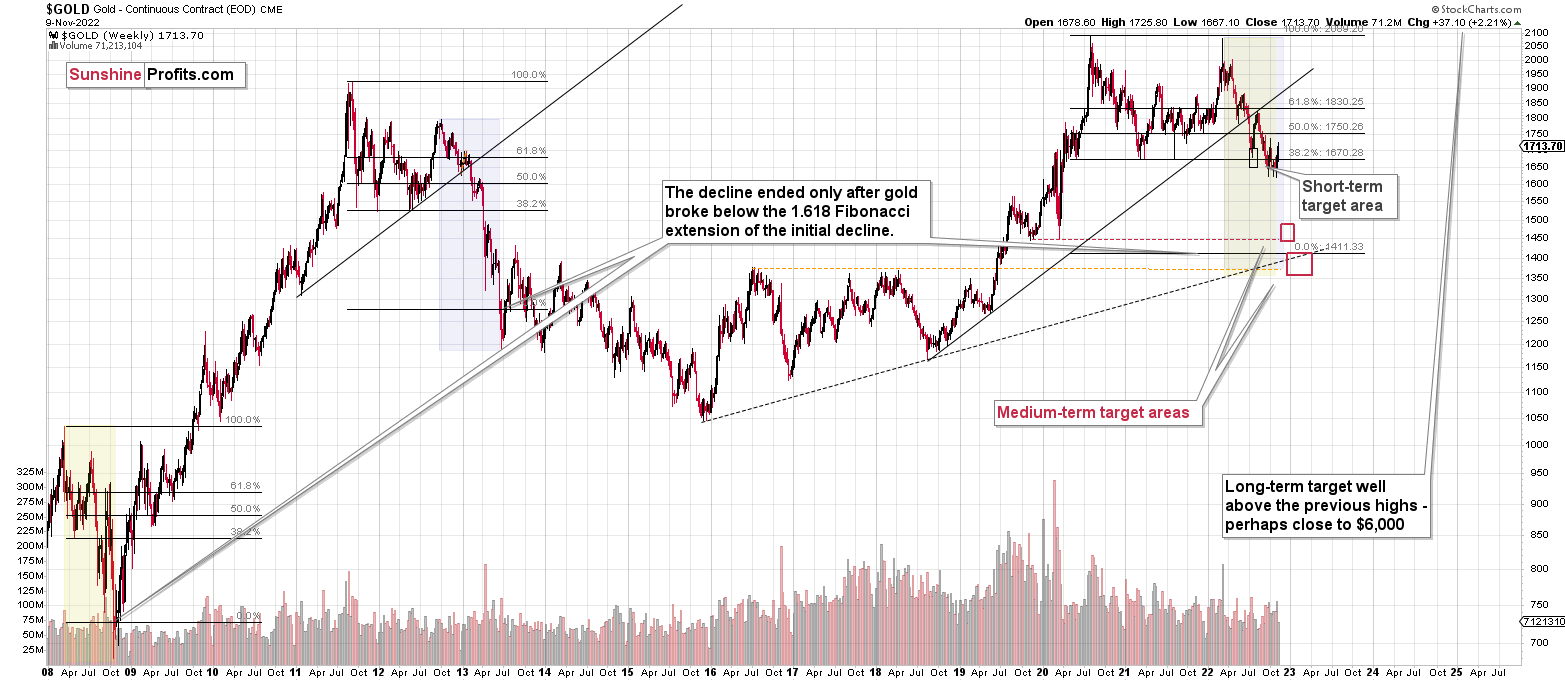
Please note that the above timing details are relatively broad and “for general overview only” – so that you know more or less what I think and how volatile I think the moves are likely to be – on an approximate basis. These time targets are not binding nor clear enough for me to think that they should be used for purchasing options, warrants, or similar instruments.
Letters to the Editor
[On a general note, I received multiple questions and comments recently, and I strived to reply to them within the analyses and videos that I’ve been posting. I’m replying to other, more specific ones below. If you think/feel that your question wasn’t answered within the last few days, please re-send it, and I’ll be happy to explain my points more.]
Q: PR
I wanted to thank you for the video incorporated into today’s Gold & Silver Trading Alert. These videos are very helpful. My question is more about clarification: is the markets already pricing in a downturn due to being too forward-looking? What data is going to substantially cause DXY-USD to rise? Gold has certainly seen a resistance to declining further, particularly with the desire of the currency markets to have a lower USD -DXY. I have read today’s Trading Alert, and it is clear, but I am looking at the continued risk, particularly if the economic numbers continue to come in with a continuing downward trend in inflation. Please comment or clarify how this might play out and over how much time.
A: I don’t think that the markets are already pricing a downturn due to being forward-looking. Just because I (we?) believe the market is about to fall does not mean that the majority of investors and traders agree.
Conversely, it seems that many (if not the vast majority) people out there are betting on the Fed’s dovish U-turn. Incorrectly so, because voters are most concerned with inflation, so that’s where the action is going to be, in my view.
It’s impossible to tell what data will cause the USD Index to move higher. Actually, no data is needed for that – the rally could continue on its own, due to technical reasons. The medium-term trend is clearly up, and we already saw a correction to the 38.2% Fibonacci retracement. This could be a good enough reason for many traders to buy heavily.
Practically whatever bullish data for the USD Index we get at this point could trigger a rally. Or it could be the case that we get bearish data for the USD Index, and it rallies anyway, because of the “sell the rumor, buy the fact” type of reaction.
That’s why focusing on technicals is more useful than trying to guess what kind of data is going to come up next, in my view.
Fundamentals dictate where the markets are headed in the long run. In the short run, they can serve as triggers (or inverse triggers due to the act-on-the-rumor-reverse-on-the-fact action), but they don’t have to. And in the long run, the interest rates can and likely will be raised more in the U.S. than in the EU and Japan due to their internal problems with debt. In particular, bonds of various countries in the EU could become “problematic” if the rates continue to rise. Remember the sovereign debt crisis that hit Greece in 2009? While the U.S. doesn’t really face the risk of states breaking apart (it’s not impossible, but it is unlikely), the EU already lost the UK. And those in charge of the EU would really not want that to happen. Sovereign debt crises could be a major problem in this case. Consequently, they will do a lot to avoid them.
Consequently, the rates are more likely to climb more in the U.S., and therefore the uptrend in the USD Index is likely to continue.
Q: Hello PR, could you elaborate on the US bond problem? Many sellers and few buyers will be tired of waiting for interest rates to fall in order to sell or print more money. How will either Fed action affect your outlook? Thank you so much for looking at this.
A: To answer this question, consider the Fed’s motivation. I mean the real motivation (in my opinion, that is). What would the Fed do if it wanted to avoid blame and the trouble resulting from it? What could it do to avoid punishment now and in the future? (Or minimize it.)
Voters care about inflation. A lot.
Consequently, the Fed “should” fight it if it wants to “deliver” and avoid being blamed.
As a result, interest rates are expected to rise and bond prices to fall. That’s bearish for the precious metals sector in the medium term.
If the Fed lowered interest rates, the prices of bonds would go up, and so would the prices of PMs. I don’t view this as likely, though.
Q: Hi PR,
I hope you are doing great. I am shorting silver, copper, and platinum and am getting a bit nervous about the recent rise in prices and timing. I just can’t see how any of these metals can move substantially lower given the recent move higher in prices. If they do, can you possibly look at the middle of next year? You mentioned early 2023, but it just doesn’t feel right to plummet that much in such a short period of time. For cooper to get to 2-2.4 to bottom out, it would have to be epic from the current 3.70 level. Plating from 1020 to 500-600 and silver from 21.5 to 12-15 just seems too extreme. Thank you. I really value your opinion, study, and evaluation. Thanks.
A: It’s usually the case that what happened recently seems more “believable” than what we saw in the distant past. It’s one of the tricks that our minds play on us, and it has a name – “recency bias.”
Another of those tricks is “availability bias” – what you can recall easily seems to have happened more often and appears more “believable.” One can usually recall more easily what was most emotional. So, if someone made a series of profitable calls and you lost money on one trade, and the last trade was more emotional, you might forget about the profitable trades and only remember the losing one only. Or remember only half of the profitable ones.
Why am I mentioning this? Because “mind tricks” like that affect what we view as “possible” and likely.
That’s exactly why I’m taking so much time to analyze the situations on the charts to make sure that they are indeed analogous before stating that, in my view, something is likely to be repeated based on the patterns being similar.
Let’s see the biggest analogies for gold stocks.
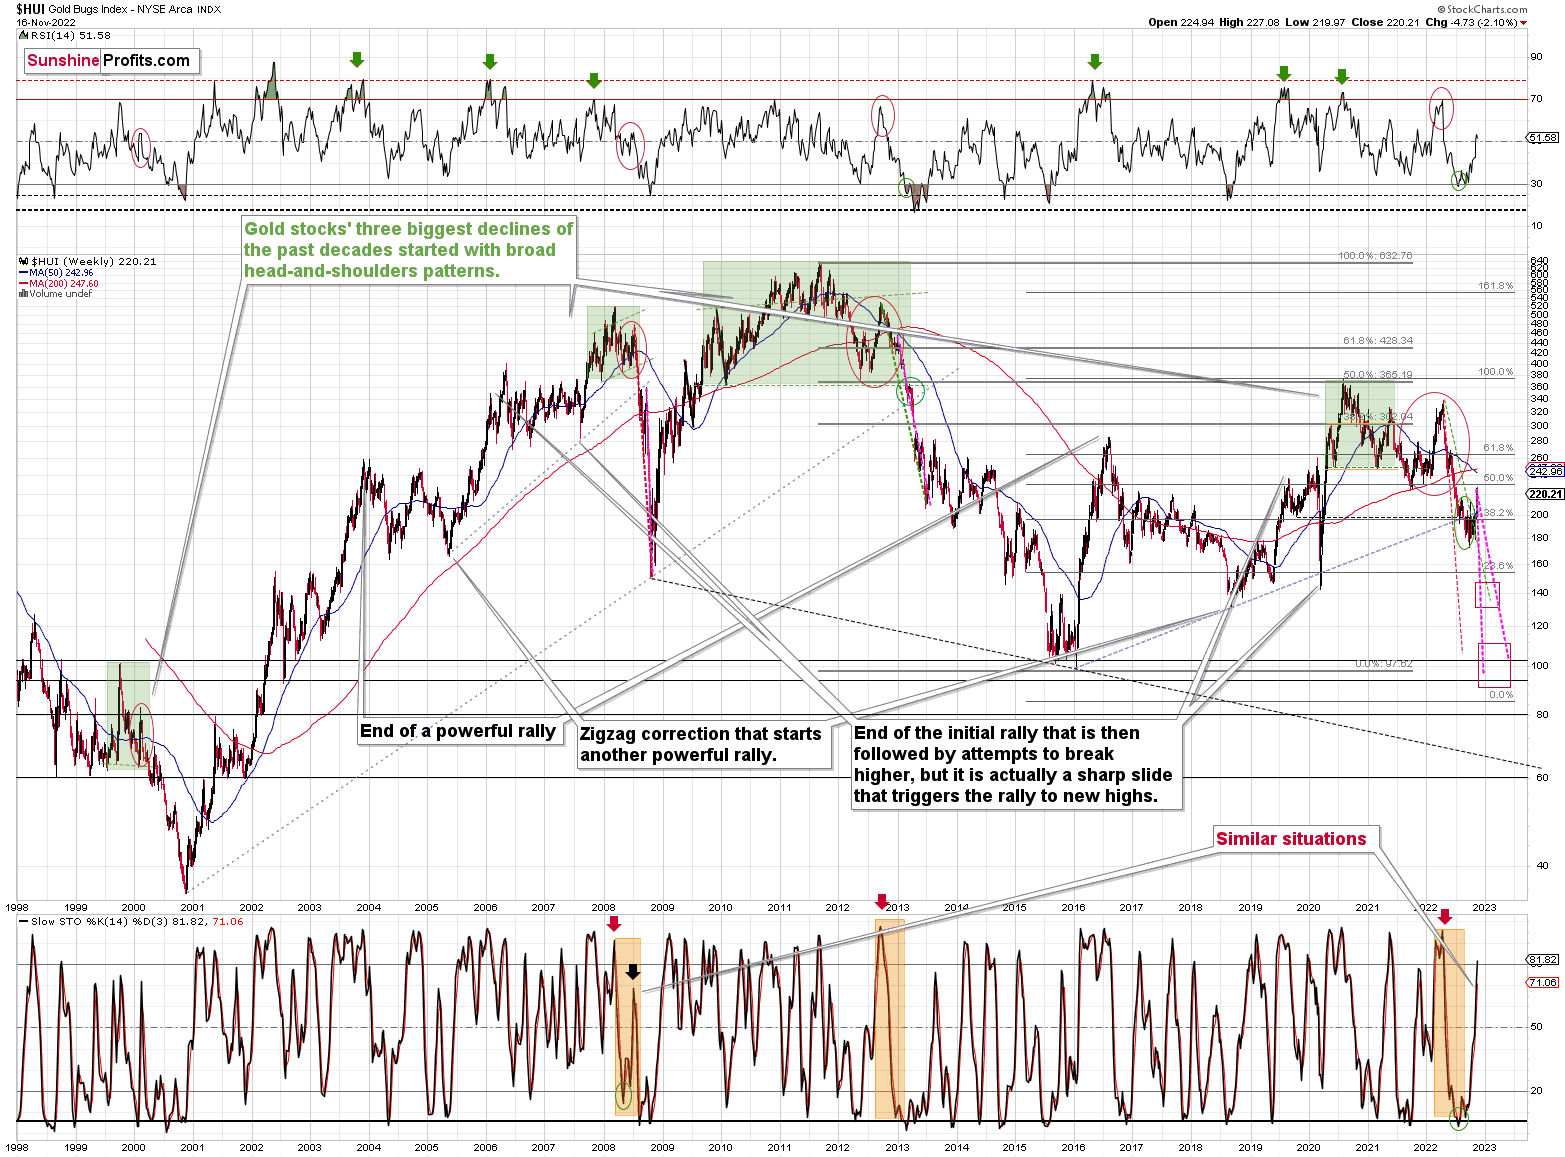
I marked the sharpest – and final – parts of the medium-term declines in the HUI Index (proxy for gold stocks) in 2008 and 2013 and copied them to the current situation.
There are quite a fiew other markings on the above chart, but the ones that I just mentioned are marked with the magenta color.
The analogy to 2008 points to the end of this year as being the likely moment for the final bottom.
The analogy to 2013 points to the middle of 2023 as being the likely moment for the final bottom.
The current situation is somewhat similar to both. However, it seems that what started as a primarily 2013-like move lower is becoming a 2008-like move lower. That’s based i.a. on the volatility of the recent upswing.
So, on average, early 2023 seems like a quite likely target for the final bottom.
Then again, please note that the two analogies fit right into my previous target area for the final bottom, so this target area simply remains intact.
Actually, based on both of the above, it seems that a move to 2020 lows close to the end of this year, and then a correction, followed by a move even lower in 2023 appear to be quite likely outcomes at this time.
That's all there is to it in terms of timing. As far as price targets are concerned, yes, they appear quite extreme from the short-term point of view, but didn’t $18 silver seem unrealistic in March? Yet we saw a decline in this area just 4 months later.
Based on historical analogies (I mean based on charts, not on how I recall them, etc.), it does seem that those targets are really likely. Of course, I can’t promise any kind of performance, but that’s exactly how I see it.
Summary
Summing up, while the precious metals sector moved higher last week, it seems that it’s just a part of a bigger – bearish – analogy to what we saw in 2008. I realize that volatile upswings generate a lot of emotions, but taking a calm, broad look at the markets shows that nothing really changed.
In fact, I would like to take this opportunity to congratulate you on your patience with this trade (and I’m grateful for your understanding that not every corrective upswing can be “caught” in trading terms). Many investors and traders panic, and get out of the market exactly at the wrong time, but your patience and self-discipline mean that you’re poised to make the most of what the market brings us this and next year.
Moving back to the market, it appears to be yet another time when the markets are incorrectly expecting the Fed to make a dovish U-turn, and based on this, the part of the 2008 decline where we saw the biggest corrective upswing materialized.
In my opinion, the current trading position is going to become profitable in the following weeks, and quite possibly in the following days. And while I can’t promise any kind of performance, I fully expect it to become very profitable before it’s over and to prolong our 2022 winning streak.
After the final sell-off (that takes gold to about $1,350-$1,500), I expect the precious metals to rally significantly. The final part of the decline might take as little as 1-5 weeks, so it's important to stay alert to any changes.
As always, we'll keep you – our subscribers – informed.
To summarize:
Trading capital (supplementary part of the portfolio; our opinion): Full speculative short positions (300% of the full position) in junior mining stocks are justified from the risk to reward point of view with the following binding exit profit-take price levels:
Mining stocks (price levels for the GDXJ ETF): binding profit-take exit price: $20.32; stop-loss: none (the volatility is too big to justify a stop-loss order in case of this particular trade)
Alternatively, if one seeks leverage, we’re providing the binding profit-take levels for the JDST (2x leveraged). The binding profit-take level for the JDST: $27.87; stop-loss for the JDST: none (the volatility is too big to justify a SL order in case of this particular trade).
For-your-information targets (our opinion; we continue to think that mining stocks are the preferred way of taking advantage of the upcoming price move, but if for whatever reason one wants / has to use silver or gold for this trade, we are providing the details anyway.):
Silver futures downside profit-take exit price: $12.32
SLV profit-take exit price: $11.32
ZSL profit-take exit price: $74.87
Gold futures downside profit-take exit price: $1,504
HGD.TO – alternative (Canadian) 2x inverse leveraged gold stocks ETF – the upside profit-take exit price: $18.47
HZD.TO – alternative (Canadian) 2x inverse leveraged silver ETF – the upside profit-take exit price: $46.87
Long-term capital (core part of the portfolio; our opinion): No positions (in other words: cash)
Insurance capital (core part of the portfolio; our opinion): Full position
Whether you’ve already subscribed or not, we encourage you to find out how to make the most of our alerts and read our replies to the most common alert-and-gold-trading-related-questions.
Please note that we describe the situation for the day that the alert is posted in the trading section. In other words, if we are writing about a speculative position, it means that it is up-to-date on the day it was posted. We are also featuring the initial target prices to decide whether keeping a position on a given day is in tune with your approach (some moves are too small for medium-term traders, and some might appear too big for day-traders).
Additionally, you might want to read why our stop-loss orders are usually relatively far from the current price.
Please note that a full position doesn't mean using all of the capital for a given trade. You will find details on our thoughts on gold portfolio structuring in the Key Insights section on our website.
As a reminder - "initial target price" means exactly that - an "initial" one. It's not a price level at which we suggest closing positions. If this becomes the case (as it did in the previous trade), we will refer to these levels as levels of exit orders (exactly as we've done previously). Stop-loss levels, however, are naturally not "initial", but something that, in our opinion, might be entered as an order.
Since it is impossible to synchronize target prices and stop-loss levels for all the ETFs and ETNs with the main markets that we provide these levels for (gold, silver and mining stocks - the GDX ETF), the stop-loss levels and target prices for other ETNs and ETF (among other: UGL, GLL, AGQ, ZSL, NUGT, DUST, JNUG, JDST) are provided as supplementary, and not as "final". This means that if a stop-loss or a target level is reached for any of the "additional instruments" (GLL for instance), but not for the "main instrument" (gold in this case), we will view positions in both gold and GLL as still open and the stop-loss for GLL would have to be moved lower. On the other hand, if gold moves to a stop-loss level but GLL doesn't, then we will view both positions (in gold and GLL) as closed. In other words, since it's not possible to be 100% certain that each related instrument moves to a given level when the underlying instrument does, we can't provide levels that would be binding. The levels that we do provide are our best estimate of the levels that will correspond to the levels in the underlying assets, but it will be the underlying assets that one will need to focus on regarding the signs pointing to closing a given position or keeping it open. We might adjust the levels in the "additional instruments" without adjusting the levels in the "main instruments", which will simply mean that we have improved our estimation of these levels, not that we changed our outlook on the markets. We are already working on a tool that would update these levels daily for the most popular ETFs, ETNs and individual mining stocks.
Our preferred ways to invest in and to trade gold along with the reasoning can be found in the how to buy gold section. Furthermore, our preferred ETFs and ETNs can be found in our Gold & Silver ETF Ranking.
As a reminder, Gold & Silver Trading Alerts are posted before or on each trading day (we usually post them before the opening bell, but we don't promise doing that each day). If there's anything urgent, we will send you an additional small alert before posting the main one.
Thank you.
Przemyslaw K. Radomski, CFA
Founder, Editor-in-chief

