
tools spotlight

-
Should Gold Miners Hide From the Approaching Dollar Wave?
April 6, 2022, 6:19 AMOn the technical front, we saw that the junior mining stocks – once again – moved higher in the first part of the session. Unlike Monday’s session, yesterday’s one was followed by a move well below the opening price. Ultimately, junior miners ended the day more than 3% lower.
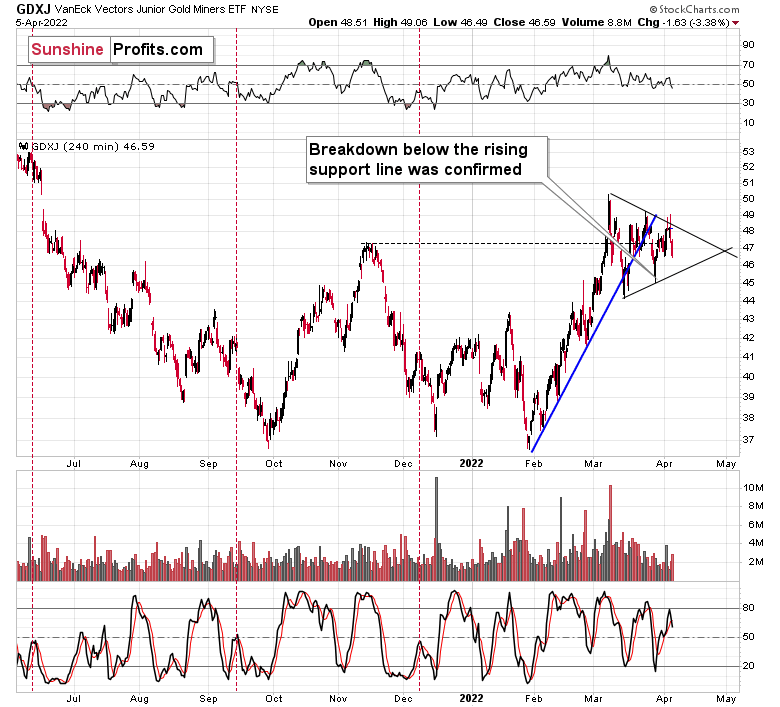
In yesterday’s analysis, I wrote that junior miners were likely to decline, and they did.
However, why did junior miners rally initially? Perhaps for technical reasons. They were moving higher in their immediate-term trend, and thus, it might have been necessary for them to reach a resistance level before they could return to their downtrend. That’s likely the same reason why they rallied early in the day on Monday, but it seems that Monday’s session wasn’t convincing enough and the bulls wanted to give the breakout another shot. It failed too.
Junior miners just found the resistance in the form of the declining line based on the previous March highs. After a tiny attempt to break above this line, the GDXJ declined and the breakout was invalidated, suggesting that the rally is over.
Now, the above-mentioned resistance line appears to be the upper border of the triangle pattern, which might concern you because triangles are usually a “continuation pattern”. In other words, the move that preceded the triangle is usually the type of move that follows it. The preceding move higher was up, so the following move could be to the upside as well.
However, for this to happen, junior miners would first need to confirm the breakout above the line, and we saw the opposite taking place yesterday – the breakout above the line was invalidated. Twice.
If – instead – we see a decline below the lower border of the triangle, the pattern would likely be followed by a decline. Please note that I wrote “usually” and now “always” with regard to the bullish implications of triangles.
If we look beyond the above chart, the bearish case is more justified than the bullish one.
I don’t mean just the extremely bearish situation in gold’s long-term chart, where it’s clear that gold is repeating its 2011-2013 performance, with the recent top being analogous to what we saw in 2012.

If it wasn’t for the Ukraine-war-tension-based rally, gold would have likely topped close to its current levels, which would be a perfect analogy to where it topped in 2012 – close to its preceding medium-term highs.
The fact that the RSI indicator moved lower recently after being close to 70 indicates that the top is already behind us.
If history is about to rhyme (and that’s very probable in my view), gold is likely to decline in a back-and-forth manner before it truly slides without looking back. Basically, that’s what we’ve been seeing recently. The recent consolidation is not a bullish development, but something in perfect tune with the extremely bearish pattern from 2012.
I don’t mean “just” the above, because we see similar analogies in silver and gold stocks (the HUI Index), and we get other indications (of more short-term nature) from the USD Index and the general stock market.
Before we get to them, let’s check gold’s short-term chart.
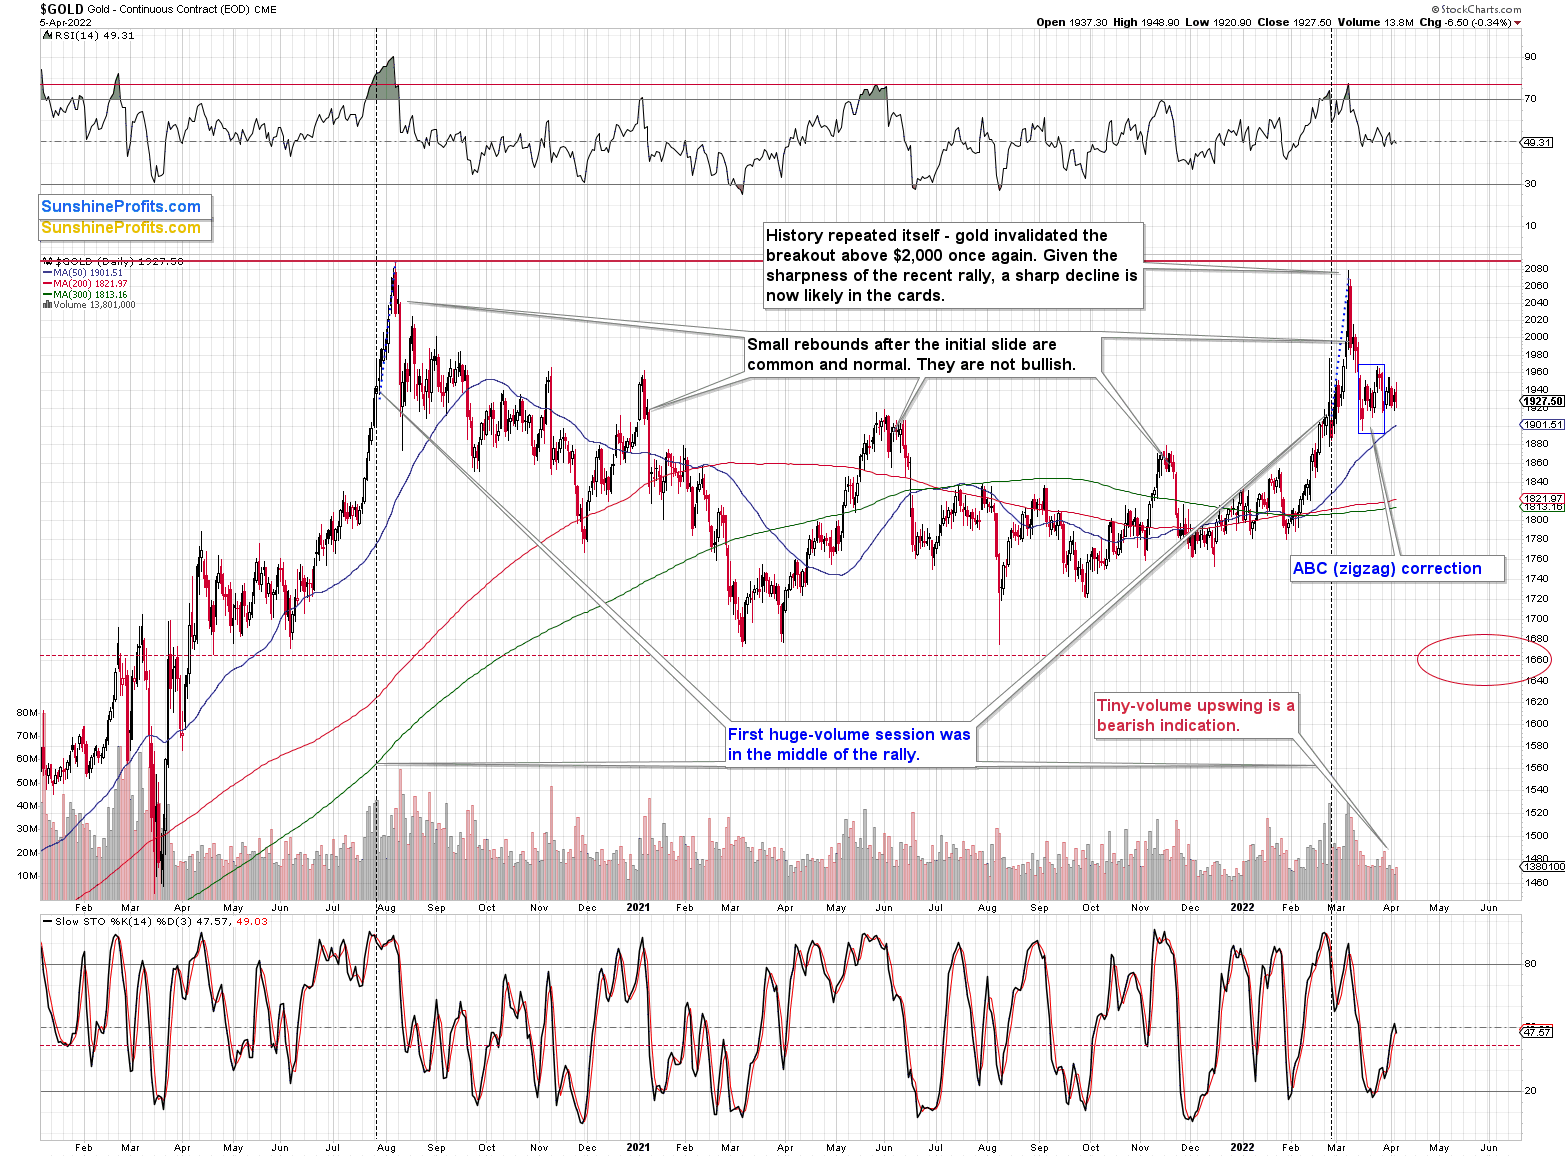
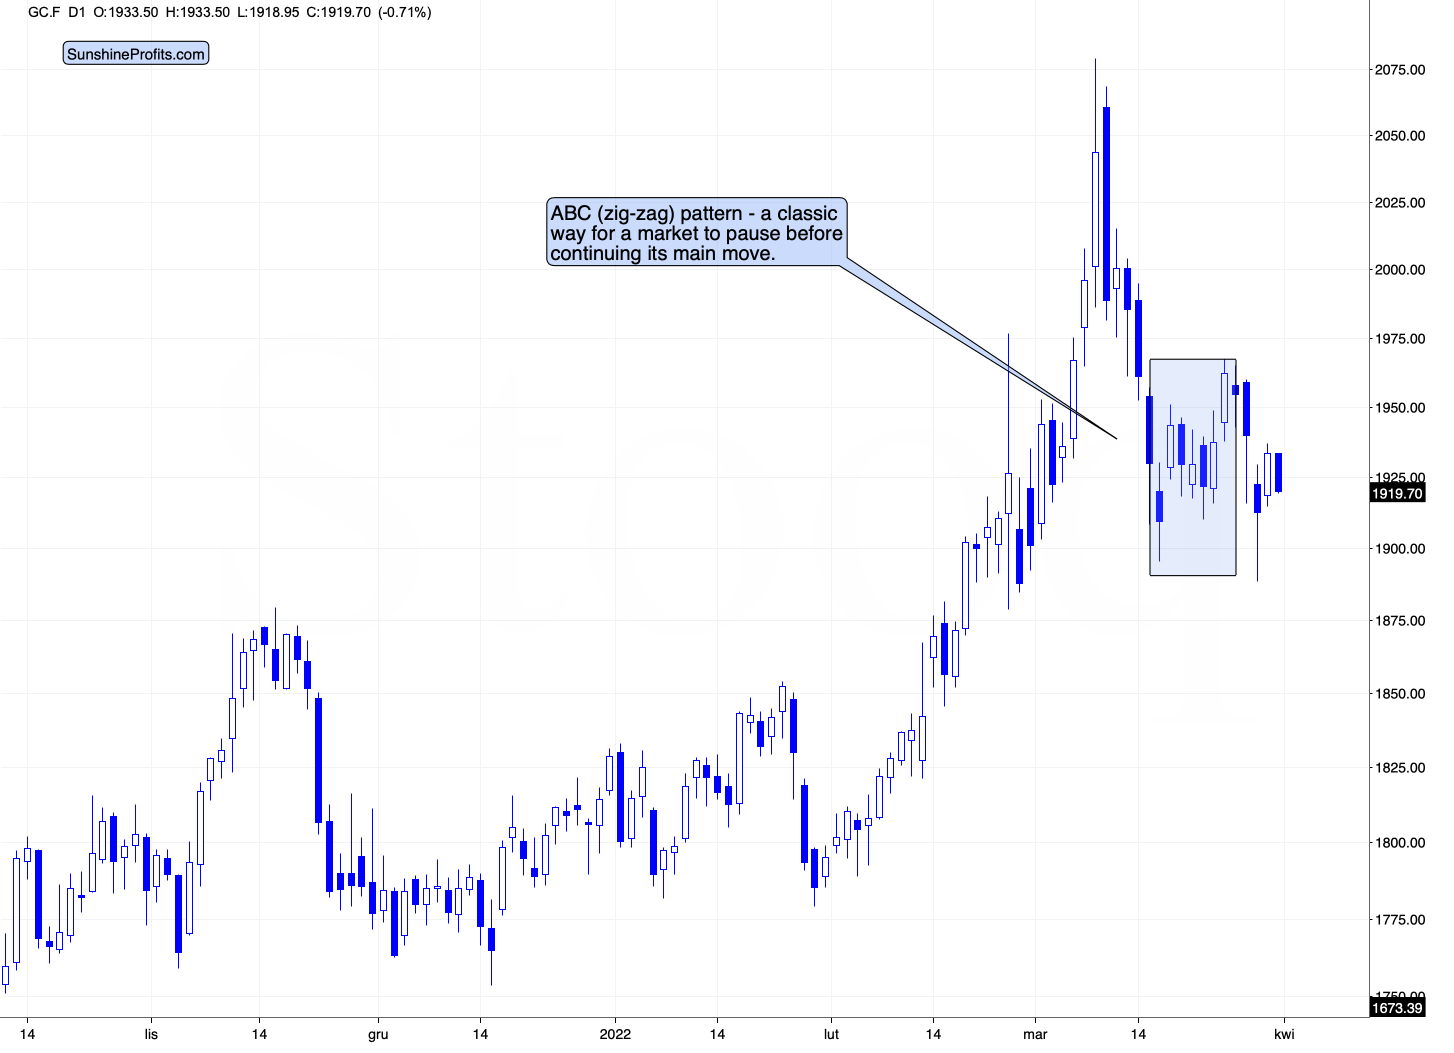
In short, it’s consolidating, which is in perfect tune with what we saw after the previous (unsuccessful) attempt to break above $2,000 – in 2020. Back then, the volatility was bigger, but the pre-top rally itself was also much higher. Overall, it seems that both situations are analogous.
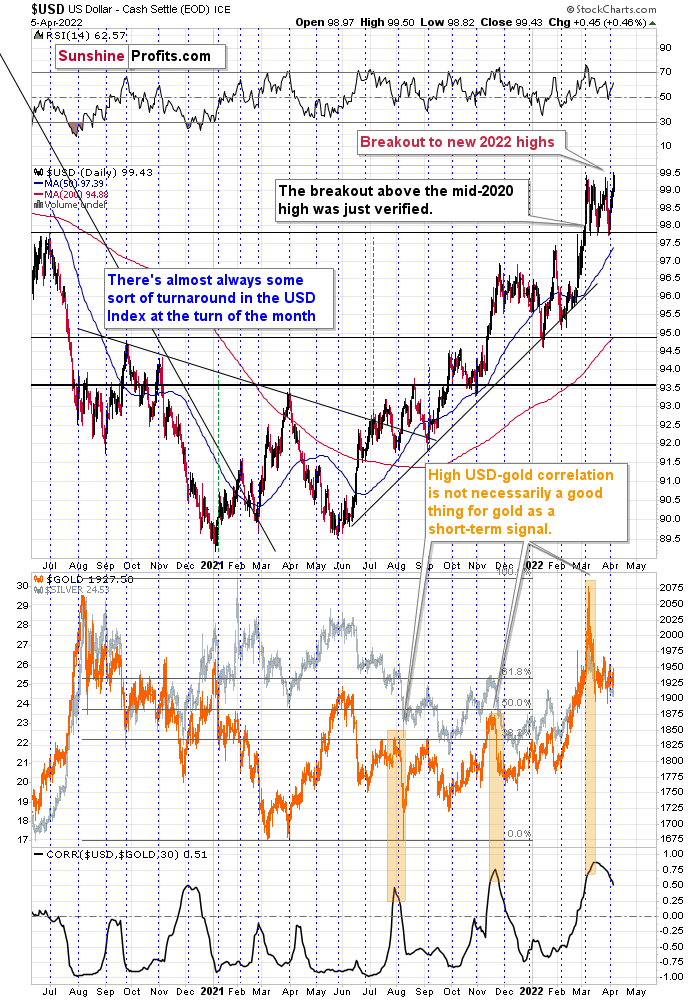
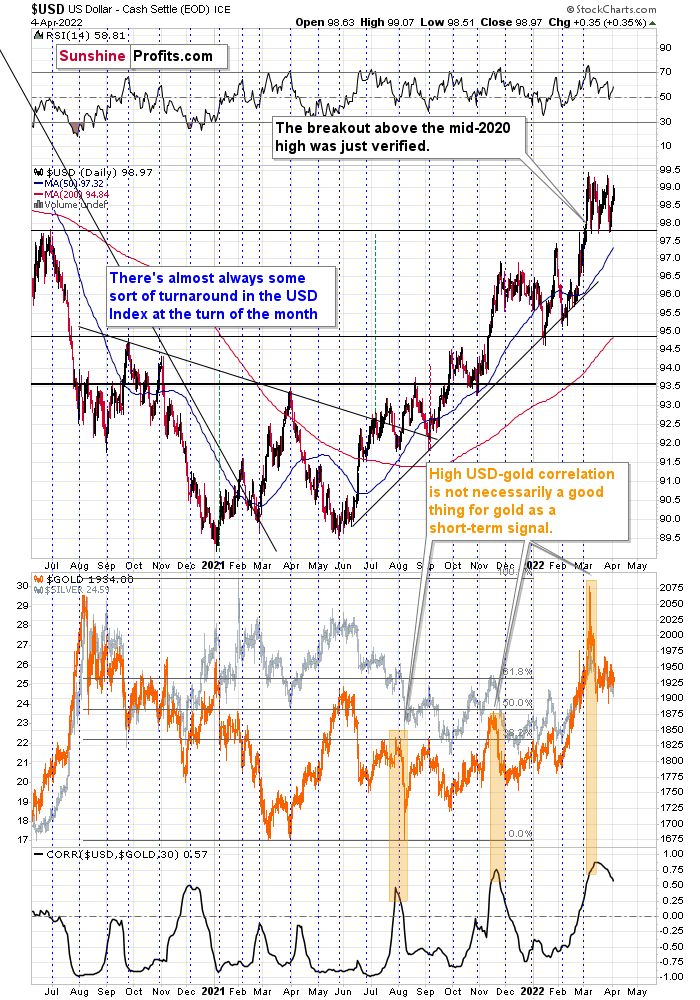
With the USD Index breaking to new highs, it seems that gold is ready to fall lower once again. Speaking of the U.S. currency, let’s take a look at its chart.
In my previous analyses, I commented on the USD Index in the following way:
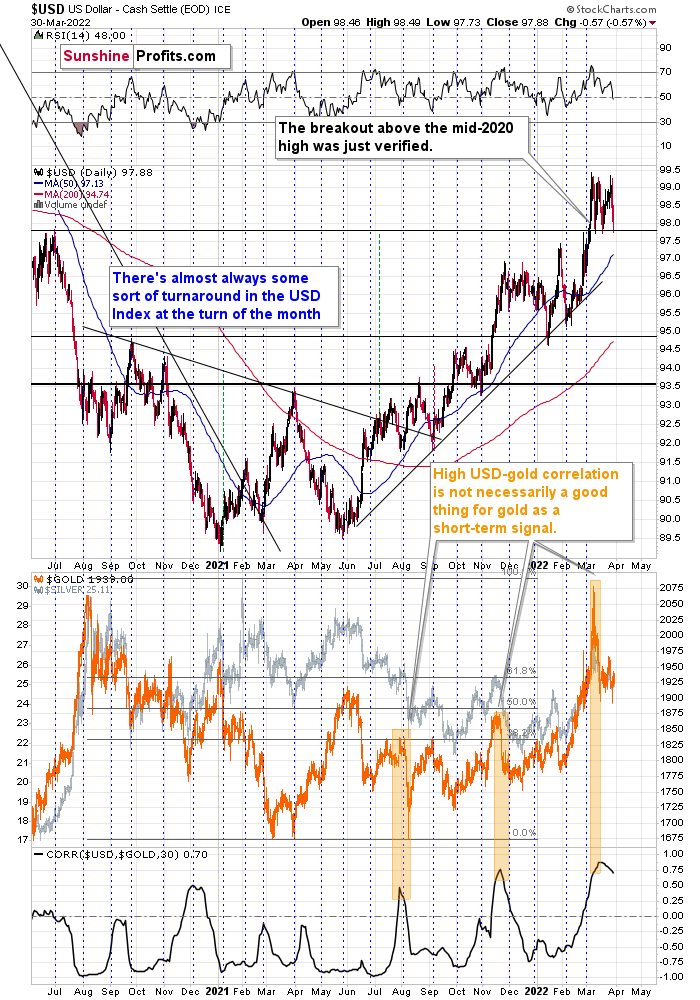
If we focus on the USD Index alone, we’ll see that yesterday’s decline was absolutely inconsequential with regard to changing the outlook for the USDX. It simply continues to consolidate after a breakout above the mid-2020 highs. Breakout + consolidation = increasing chances of rallies’ continuation. A big wave up in the USD Index is likely just around the corner, and the precious metal sector is likely to decline when it materializes.
As the war-based premiums in gold and the USD appear to be waning, a high-interest-rate-driven rally in the USD is likely to trigger declines in gold. The correlation between these two assets has started to decline. When that happened during the last two cases (marked with orange), gold plummeted profoundly shortly thereafter.
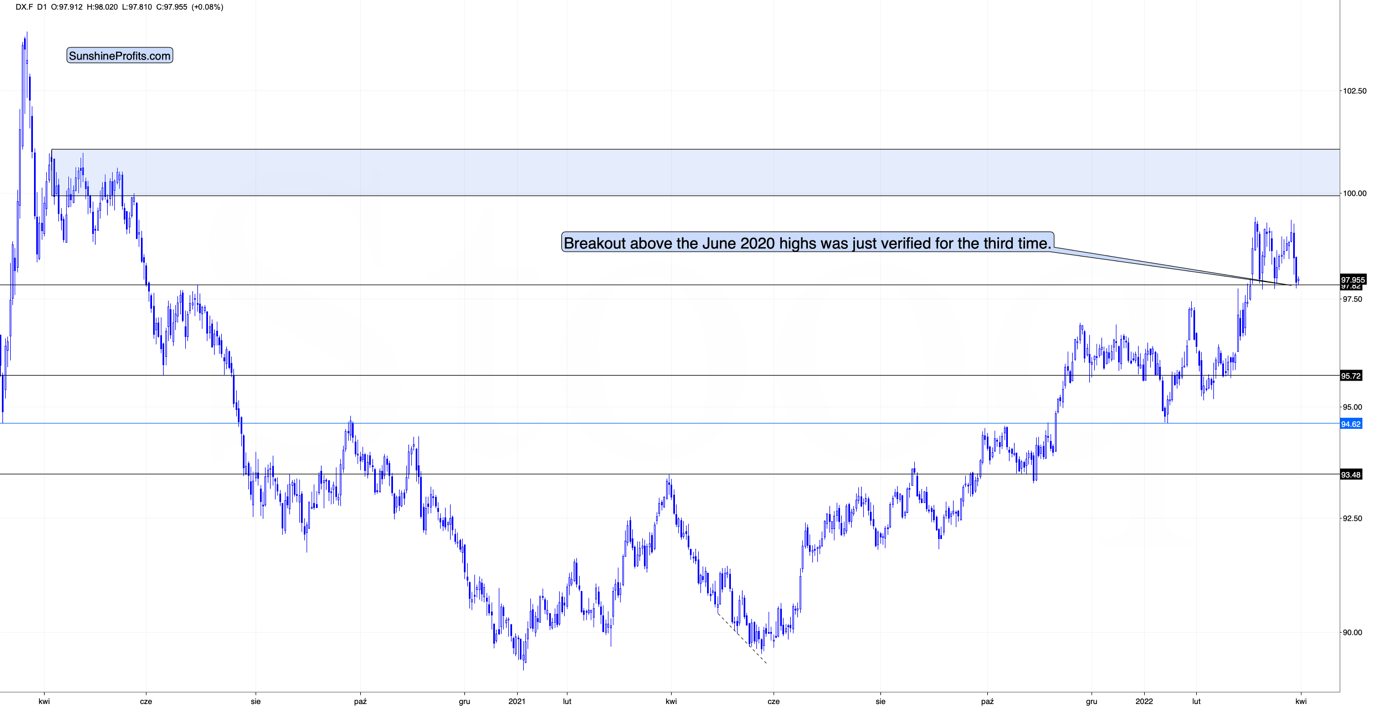
The USD Index rallied recently, once again clearly verifying the breakout above its mid-2020 high. This means that the USD Index is now likely ready to rally once again. Naturally, this has bearish implications for the precious metals sector.
Indeed – the USD Index has rallied, and it just moved to its new 2022 highs. What’s not visible on the above chart is that the rally continued in today’s pre-market movement. At the moment of writing these words, the USD Index futures are trading at about 99.7. Once the USD Index moves above 100, it will likely get media’s attention, which means that many more people will realize what’s going on.
What’s going on is that the USDX has been on the rise since early 2021 – when everyone (well, not you, if you’ve been following my analyses at that time) thought that the USD Index was about to collapse.
This renewed bullish sentiment is likely to keep precious metals prices in check and perhaps trigger another big wave down.
Meanwhile, the technical picture of the S&P 500 index continues to suggest that the final top and the initial corrective upswing are over.

The general stock market closed the previous week below its February highs, which means that the small breakout above them was invalidated.
It also closed yesterday’s session lower, indicating that another short-term rally is about to take place.
This is a very bearish indication for the following weeks. Many more investors are likely to become aware of the new interest-rate-hike-driven medium-term bear market once the S&P 500 breaks to its new 2022 lows. That’s when the decline is supposed to accelerate, quite likely also in silver and mining stocks that are usually most vulnerable to stock market moves.
All in all, technicals favor a decline in the precious metals sector sooner rather than later.
Thank you for reading our free analysis today. Please note that the above is just a small fraction of the full analyses that our subscribers enjoy on a regular basis. They include multiple premium details such as the interim targets for gold and mining stocks that could be reached in the next few weeks. We invite you to subscribe now and read today’s issue right away.
Sincerely,
Przemyslaw Radomski, CFA
Founder, Editor-in-chief -
Gold Begins to Wobble. Is It a Sign of a Greater Fall?
April 5, 2022, 9:32 AMGold is still running on the war-fumes, but its last moves bring to mind only bearish associations. Worse yet, a rising dollar appeared on the horizon.
On the technical front, we saw that the junior mining stocks moved higher in the first part of the session, but then declined and ended the day practically unchanged.
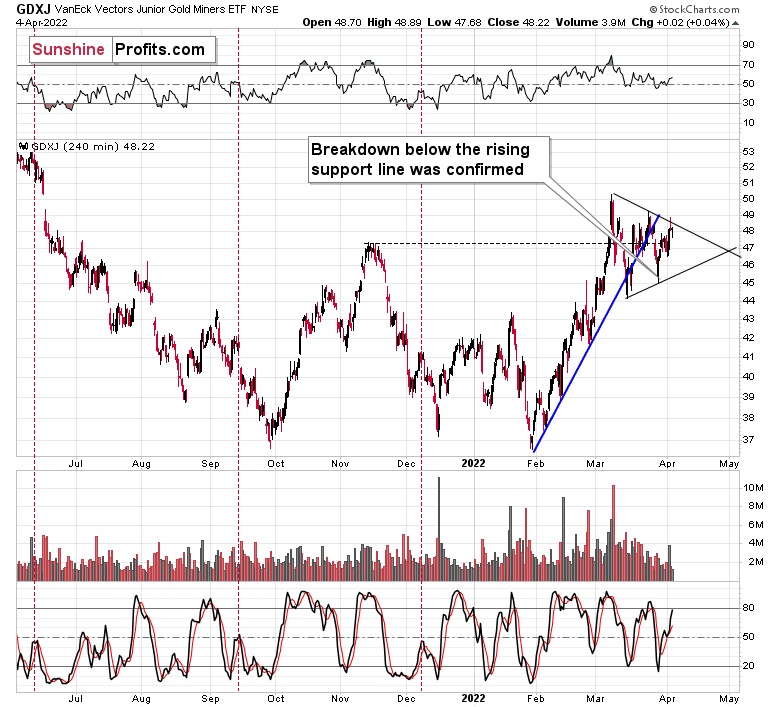
Why did junior miners rally initially? Perhaps for technical reasons. They were moving higher in their immediate-term trend, and thus, it might have been necessary for them to reach a resistance level before they could return to their downtrend.
Junior miners just found the resistance in the form of the declining line based on the previous March highs. After a tiny attempt to break above this line, the GDXJ declined and the breakout was invalidated, suggesting that the rally is over.
Now, the above-mentioned resistance line appears to be the upper border of the triangle pattern, which might concern you because triangles are usually a “continuation pattern”. In other words, the move that preceded the triangle is usually the type of move that follows it. The preceding move higher was up, so the following move could be to the upside as well.
However, for this to happen, junior miners would first need to confirm the breakout above the line, and we saw the opposite taking place yesterday – the breakout above the line was invalidated.
If – instead – we see a decline below the lower border of the triangle, the pattern would likely be followed by a decline. Please note that I wrote “usually” and now “always” with regard to the bullish implications of triangles.
If we look beyond the above chart, the bearish case is more justified than the bullish one.
I don’t mean just the extremely bearish situation in gold’s long-term chart, where it’s clear that gold is repeating its 2011-2013 performance, with the recent top being analogous to what we saw in 2012.
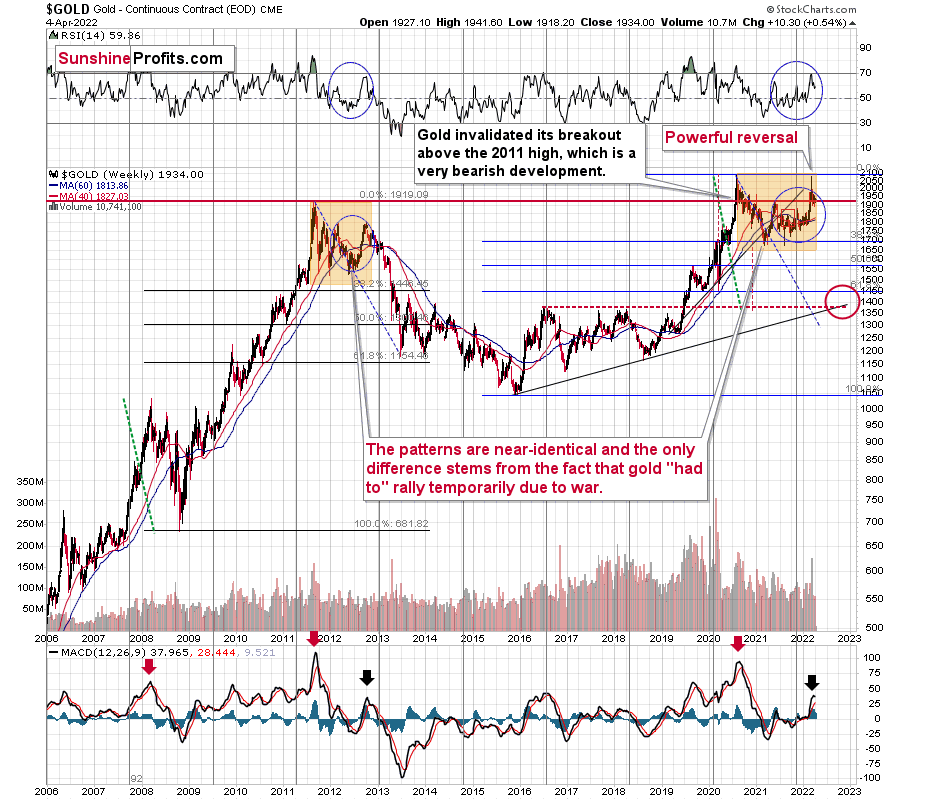
If it wasn’t for the Ukraine-war-tension-based rally, gold would have likely topped close to its current levels, which would be a perfect analogy to where it topped in 2012 – close to its preceding medium-term highs.
The fact that the RSI indicator moved lower recently after being close to 70 indicates that the top is already behind us.
If history is about to rhyme (and that’s very probable in my view), gold is likely to decline in a back-and-forth manner before it truly slides without looking back. Basically, that’s what we’ve been seeing recently. The recent consolidation is not a bullish development, but something in perfect tune with the extremely bearish pattern from 2012.
I don’t mean “just” the above, because we see similar analogies in silver and gold stocks (the HUI Index), and we get other indications (of more short-term nature) from the USD Index and the general stock market.
The technical picture of the S&P 500 index suggests that the final top and the initial corrective upswing are over.
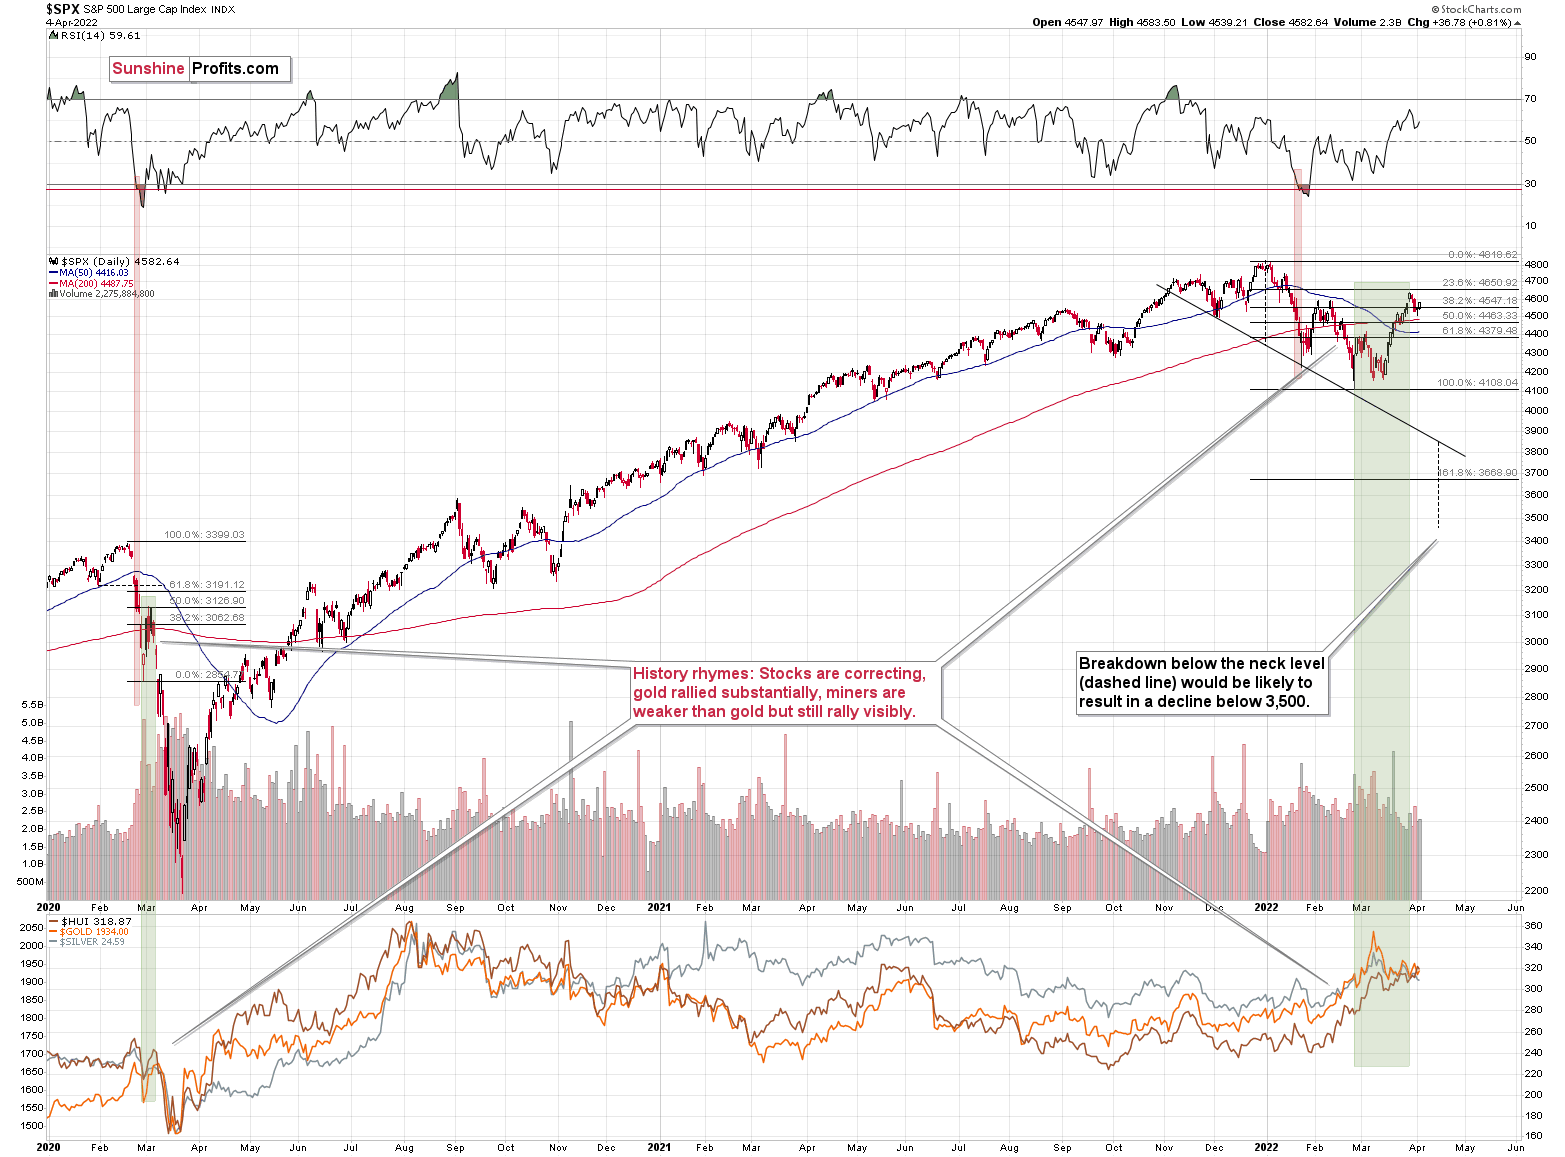
The general stock market closed the week below its February highs, which means that the small breakout above them was invalidated. This is a very bearish indication for the following weeks. Many more investors are likely to become aware of the new interest-rate-hike-driven medium-term bear market once the S&P 500 breaks to new 2022 lows. That’s when the decline is likely to accelerate, quite likely also in silver and mining stocks that are usually most vulnerable to stock market moves.
Moreover, let’s keep in mind that the USD Index is likely to soar once again soon, triggering declines in the precious metals market.
In my previous analyses, I commented on the USD Index in the following way:
If we focus on the USD Index alone, we’ll see that yesterday’s decline was absolutely inconsequential with regard to changing the outlook for the USDX. It simply continues to consolidate after a breakout above the mid-2020 highs. Breakout + consolidation = increasing chances of rallies’ continuation. A big wave up in the USD Index is likely just around the corner, and the precious metal sector is likely to decline when it materializes.
As the war-based premiums in gold and the USD appear to be waning, a high-interest-rate-driven rally in the USD is likely to trigger declines in gold. The correlation between these two assets has started to decline. When that happened during the last two cases (marked with orange), gold plummeted profoundly shortly thereafter.
The USD Index rallied recently, once again clearly verifying the breakout above its mid-2020 high. This means that the USD Index is now likely ready to rally once again. Naturally, this has bearish implications for the precious metals sector.
All in all, technicals favor a decline in the precious metals sector sooner rather than later.
Thank you for reading our free analysis today. Please note that the above is just a small fraction of the full analyses that our subscribers enjoy on a regular basis. They include multiple premium details such as the interim targets for gold and mining stocks that could be reached in the next few weeks. We invite you to subscribe now and read today’s issue right away.
Sincerely,
Przemyslaw Radomski, CFA
Founder, Editor-in-chief -
Is Gold About to Be Trampled by Snowballing Inflation?
April 4, 2022, 9:46 AMWhile the PMs and the general stock market assume that rising interest rates won’t cause any significant bouts of volatility, history suggests otherwise. With good data likely to elicit bad outcomes for both parties, the hotter the U.S. economy gets, the more cold water the Fed has to pour on the financial markets.
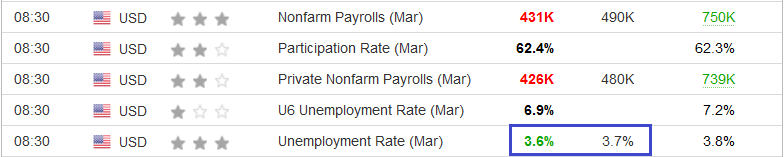
To that point, U.S. nonfarm payrolls came in at 431,000 versus 490,000 expected on Apr. 1. However, despite the slight miss, the U.S. unemployment rate fell to 3.6% and outperformed expectations.
Please see below:
 Source: Investing.com
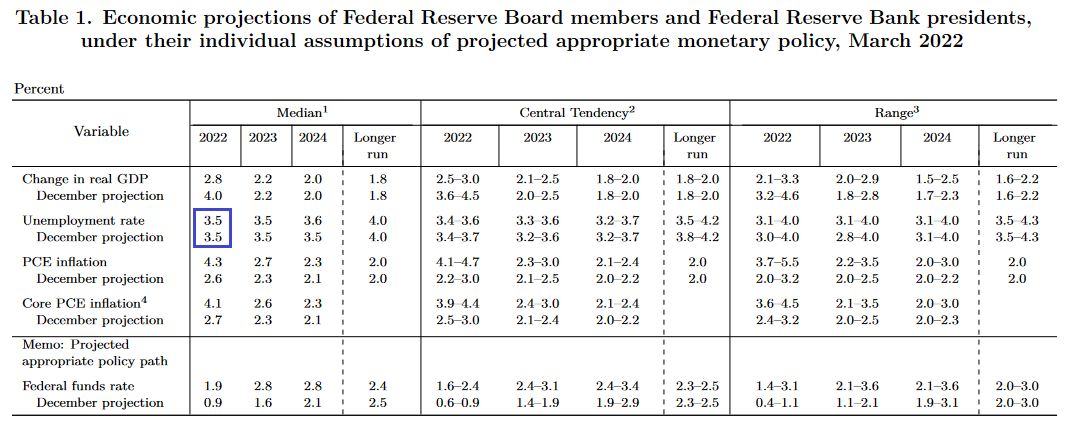
 Furthermore, the FOMC’s latest Summary of Economic Projections (SEP) shows that Fed officials expect the U.S. unemployment rate to reach 3.5% by the end of 2022. However, with the metric likely to outperform sooner than expected, a realization will add more fuel to the hawkish fire.
Please see below:
 Source: U.S. Fed
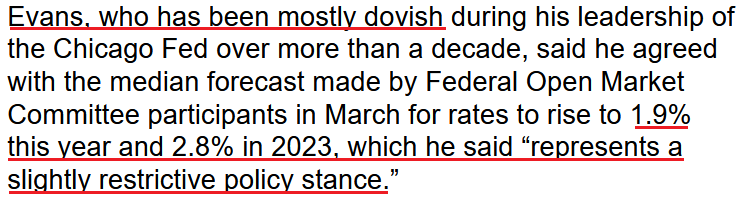
In addition, while the number of Fed officials calling for seven rate hikes or more in 2022 has reached double digits, Chicago Fed President Charles Evans joined the fray on Apr. 1. He said:
“If monetary policy did not respond to these broader inflation pressures, we would see the expectation of continued high inflation become embedded in economic decisions, and we would have even harder work to do to rein it in. So monetary policy must shift to removing accommodation in a timely fashion, which is what you’ve seen in the latest actions by and communications from the FOMC.”
Moreover, while Evans supports the median projection and expects seven rate hikes in 2022, his expectations of a 1.9% and 2.8% U.S. federal funds rate in 2022 and 2023 are profoundly hawkish.
Please see below:
 Source: Bloomberg
For context, please remember that Fed officials’ September projections showed roughly one rate hike in 2022. As a result, while investors remain sanguine for the time being, does it seem likely that the Fed will hike interest rates several times without any volatility? Moreover, if history is any indication, once the data starts to roll over, the narrative will shift from ‘all is well’ to ‘uh oh.’
In the meantime, though, the U.S. economy remains resilient, and with employment and inflation headlining the Fed’s dual mandate, there more they outperform, the more confidence the Fed will have to raise interest rates.
To that point, the Institute for Supply Management (ISM) released its U.S. Manufacturing PMI on Apr. 1. While the headline index decreased from 58.6 in February to 57.1 in March, Timothy R. Fiore, Chair of the ISM Manufacturing Business Survey Committee, said:
"The U.S. manufacturing sector remains in a demand-driven, supply chain-constrained environment. In March, progress was made to solve the labor shortage problems at all tiers of the supply chain, which will result in improved factory throughput and supplier deliveries. Panelists reported lower rates of quits and early retirements compared to previous months, as well as improving internal and supplier labor positions.”
As a result, the “ISM’s Employment Index registered 56.3 percent in March, 3.4 percentage points above the February reading of 52.9 percent.”
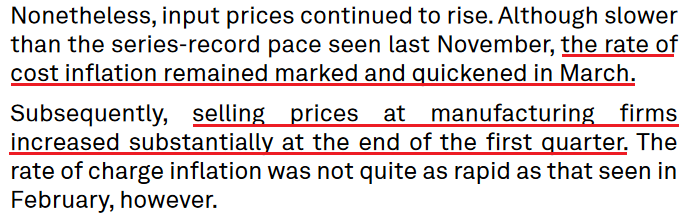
More importantly, though, inflation surged in March. The report revealed:
“The ISM Prices Index registered 87.1 percent, up 11.5 percentage points compared to the February reading of 75.6 percent, indicating raw materials prices increased for the 22nd consecutive month, at a notably faster rate in March. This is the biggest month-over-month increase since a 12.2-percentage point gain (to 77.6 percent) in December 2020.”
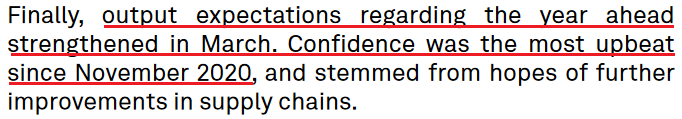
Thus, with the ISM’s data supporting the Fed’s hawkish disposition, inflation continues to run away from the central bank. As further evidence, S&P Global also released its U.S. Manufacturing PMI on Apr. 1. Here, the headline index increased from 57.3 in February to 58.8 in March. The report revealed:
“The pace of growth continued to gain momentum and was the quickest since last August. Crucial to the increase were reports of improved availability of raw materials and inputs as supply chain disruption eased slightly. Companies also noted that higher output was supported by stronger client demand and a rise in new orders. (…) Foreign client demand also strengthened, with new export orders rising at the joint-fastest pace for almost a year.”
In addition:
“Encouraged by stronger demand conditions, firms stepped up their hiring activity, with some also noting a greater ability to find suitable candidates.”
On top of that:
 Source: S&P Global
Likewise, if the Fed needed any more fuel to light the hawkish fire, business confidence improved in March and highlights how the inflationary spiral will continue until the Fed curbs demand.
Please see below:
 Source: S&P Global
Adding to the Fed's ills, Apartment List released its National Rent Report on Mar. 28. For context, Shelter accounts for more than 30% of the headline Consumer Price Index's (CPI) movement. As a result, lodging is an important variable when analyzing the path of inflation, and therefore, future Fed policy.
The report revealed:
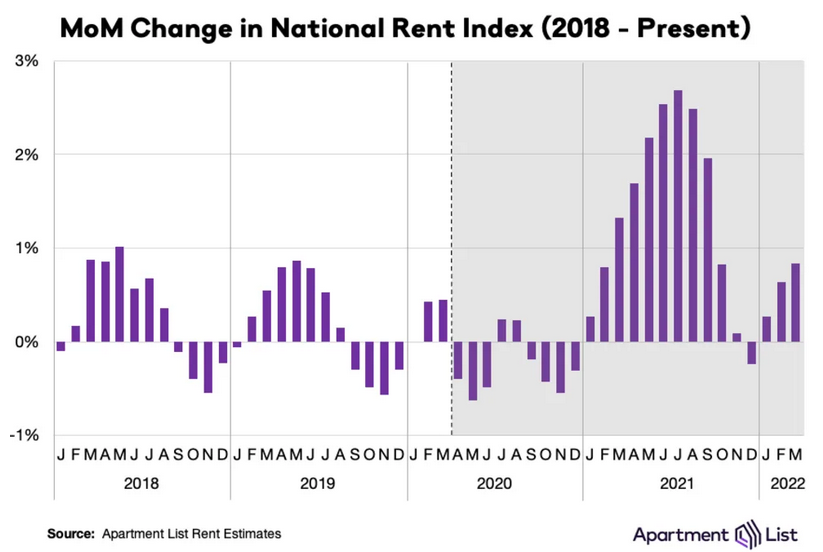
“Rent growth is continuing to pick up steam again, after a brief winter cooldown, with our national index up by 0.8 percent over the course of March.”
“This is a bit slower than the 1.3 percent increase that we saw last March, when the 2021 rent growth boom was just starting to pick up steam. It’s also well below the 2.3 percent average monthly rent growth that we saw from last April through September.
But even if growth has cooled down substantially from last summer’s peak, it is also pacing well ahead of the pre-pandemic norm for this time of year. In the first three months of 2022, rents nationally have increased by a total of 1.8 percent, which is twice as fast as the growth that we saw over the same period in 2018 (0.9 percent) and 2019 (0.8 percent).”
Please see below:
In addition, the report stated:
“In December 2021, rents fell in 61 of the nation’s 100 largest cities, the only month last year in which more than half of these cities saw a decline. This month, however, rents were up in 93 of the nation’s 100 largest cities.”
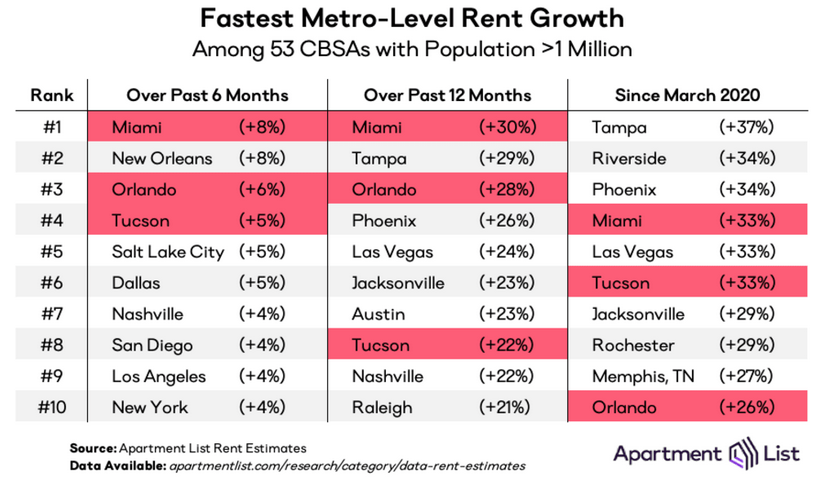
On top of that, when analyzing rent inflation across the fastest growing regions, the year-over-year (YoY) percentage changes (the second column below) are quite extreme.
Please see below:
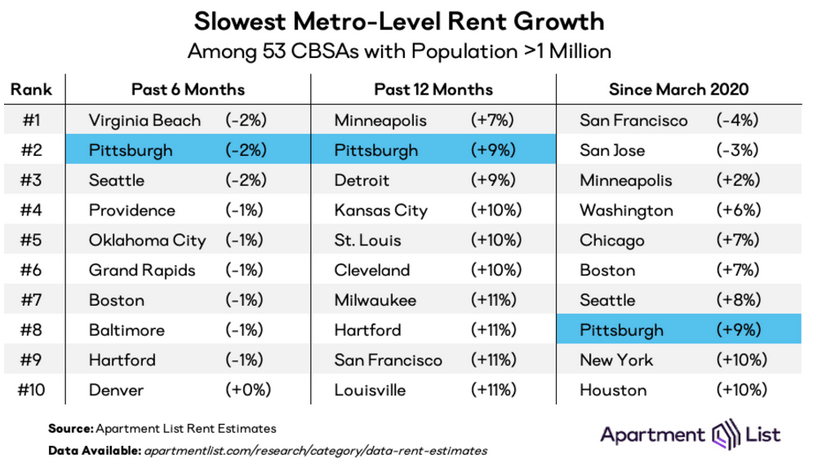
Furthermore, the Shelter CPI increased by 4.8% YoY on Mar. 10, while the owners’ equivalent rent metric increased by 4.3% YoY. However, Apartment List’s data shows that even the slowest growing regions (the second column below) have outpaced the U.S. government’s data over the last 12 months. As a result, with rents still rising MoM and government data still lagging, the Shelter CPI should have plenty of upside over the medium term.
Please see below:
Finally, I’ve highlighted how wage inflation has exploded in recent months, and with companies like Dave & Buster’s and Chewy citing labor cost increases of 20% and 17%, respectively, how can the Fed curb inflation with job openings near their all-time high and wage inflation still abundant?
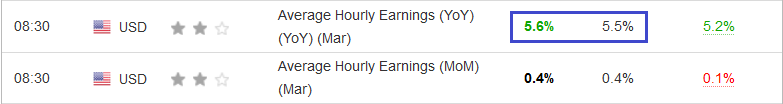
Well, it’s important to note that average hourly earnings increased by 5.6% YoY on Apr. 1. Moreover, the metric outperformed the 5.5% YoY estimate and surpassed the 5.2% YoY figure from February.
Please see below:
 Source: Investing.com
 Also noteworthy, Walgreens Boots Alliance released its second-quarter earnings on Mar. 31. President John Standley said:
 Source: Walgreens Boots Alliance/Seeking Alpha
As a result, if companies continue to increase their wages to attract employees, the inflationary spiral will never end. That’s precisely why environments like these are bullish for the U.S. federal funds rate.
Please see below:
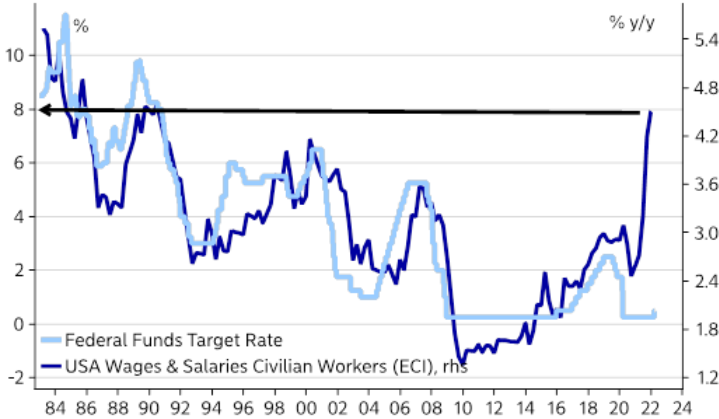 Source: Nordea
To explain, the dark blue line above tracks the YoY percentage change in the U.S. Employment Cost Index (ECI), while the light blue line above tracks the U.S. federal funds rate. As you can see, the pair have a tight historical relationship.
Moreover, with the gap on the right side of the chart unlike anything seen in the last ~40 years, the U.S. federal funds rate has plenty of room to run, and such a realization is profoundly bearish for silver and gold prices.
The bottom line? The hotter the data, the more hawkish the Fed. With inflation and employment continuing to sizzle, the Fed needs to cool the economy to avoid even bigger problems down the road. Moreover, with more than 10 Fed officials calling for at least seven rate hikes in 2022, it's naive to assume that bouts of panic won't erupt along the way. As such, history shows that liquidity drains are bearish for the PMs, and the likely pace of this one aligns with some of the most hawkish on record.
In conclusion, the PMs were mixed on Apr. 1, as momentum helped drive mining stocks higher. However, with their medium-term technicals and fundamentals continuing to decelerate, the next few months should elicit sharp reversals. Moreover, while investors act as if the end of QE and seven to 12 rate hikes are no big deal, the confidence game will likely unravel as the real drama unfolds.
Thank you for reading our free analysis today. Please note that the above is just a small fraction of the full analyses that our subscribers enjoy on a regular basis. They include multiple premium details such as the interim targets for gold and mining stocks that could be reached in the next few weeks. We invite you to subscribe now and read today’s issue right away.
Sincerely,
Przemyslaw Radomski, CFA
Founder, Editor-in-chief -
Let’s Talk Inflation - Is a “Soft Landing” Still Possible?
April 1, 2022, 7:36 AMWhile the general stock market tumbled on Mar. 31, the PMs still remain relatively elevated. However, this week brought about several developments that impair the PM's medium-term fundamental outlooks.
For example, inflation remains red-hot, as the latest corporate earnings calls show executives fretting about input and wage pressures. Moreover, when the only choices are raising prices or eroding their profit margins, it's a lose-lose situation for the financial markets.
On the one hand, absorbing the costs results in weak quarterly earnings, and investors often punish companies that underperform. On the other hand, raising prices further stokes inflation and increases the chance that the Fed's swift rate hike cycle will push the U.S. economy into recession. As a result, long-only investors face an extremely uncertain future, and the Fed's margin for error is extremely low.
Furthermore, the U.S. labor market remains on fire. With near all-time high JOLTS job openings hitting the wire this week, The Confidence Board's jobs are "plentiful" metric hitting an all-time high, and ADP's private payrolls also outperforming consensus expectations, the U.S. employment picture remains rosy. As a result, the Fed should light plenty of hawkish fireworks over the next few months.
Speaking of which, more Fed officials made the rounds this week. And with their hawkish rhetoric still steadfast, the S&P 500 and the PMs remain in fundamental denial.
For example, Philadelphia Fed President Patrick Harker said on Mar. 29 that "I am open to sending a strong signal with a 50 basis point increase at the next meeting." Moreover, while he added that "I have penciled in seven… 25 basis point increases for this year," and more or less will depend on the path of inflation, a neutral rate of ~2.5% implies roughly 10 rate hikes over the next several months.
Please see below:
 Source: Reuters
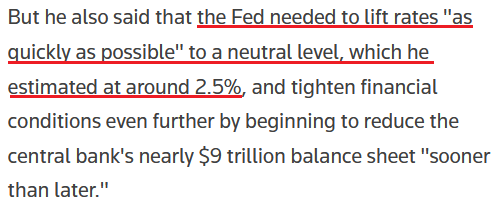
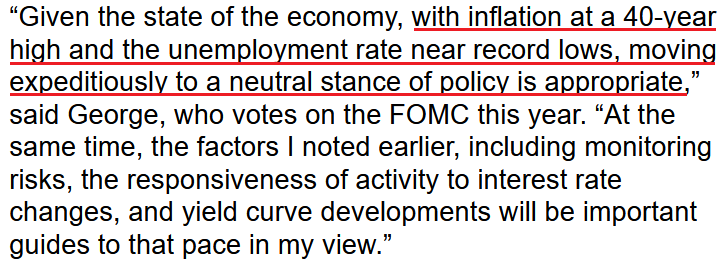
Likewise, Kansas City Fed President Esther George said on Mar. 30 that “The balance sheet will need to decline significantly,” as she cited the “distortive effects” the Fed’s nearly $9 trillion in holdings have on the financial markets. “The interaction of higher policy rates with a large balance sheet will need to be considered.”
Moreover, channeling her inner Jerome Powell, she also used the term “expeditiously” when describing the future path of interest rates.
Please see below:
 Source: Bloomberg
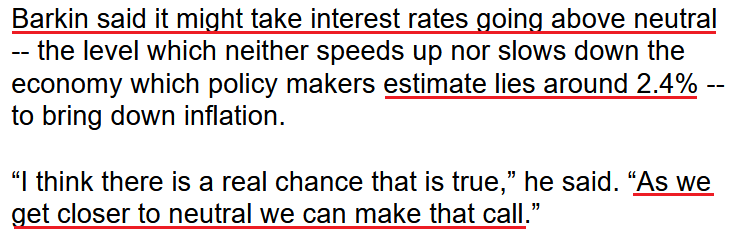
Making three of a kind, Richmond Fed President Thomas Barkin said on Mar. 30 that he’s “open to” a 50 basis point rate hike in May. Moreover, with his perception of neutral at 2.4% (roughly 10 rate hikes), he sounded quite committed to the path ahead.
Please see below:
 Source: Bloomberg
As a result, with Barkin’s assessment of “as we get closer to neutral we can make that call,” it’s important to remember that there is a considerable distance from 0.25% (one rate hike where we are now) to 2.4%. As such, while Fed officials make their points loud and clear, the fundamental ramifications of getting to neutral will likely have profound impacts on the S&P 500 and the PMs.
To that point, with Wall Street now aligned with our expectations for future Fed policy, investment banks have increased their rate hike estimates for the coming months.
Please see below:
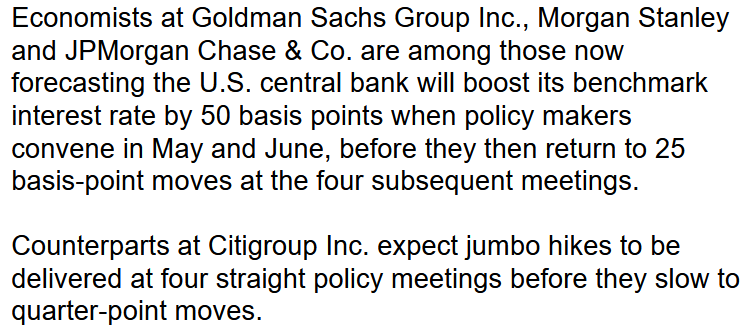 Source: Bloomberg
Moreover, while Bank of America has been in the hawkish camp for some time, Chief Global Economist Ethan Harris wrote that “The Fed has accepted that it’s behind the curve and will be emboldened by the resilience of the economy and the financial markets. The remaining question is whether it will be willing to impose serious pain on the economy to rein in inflation.”
Furthermore, while he added that the Fed could engineer a growth recession next year that brings inflation down to 2.6% and modestly pushes up unemployment, he cautioned, “that is at the optimistic end of outcomes. The main risks are to the downside.”
To that point, with U.S. Treasury yields already screaming at the Fed to tighten, inversions are popping up everywhere. And with the inflationary quagmire creating a lose-lose situation, the bond market highlights the anxiety that should be confronting the Fed.
Please see below:
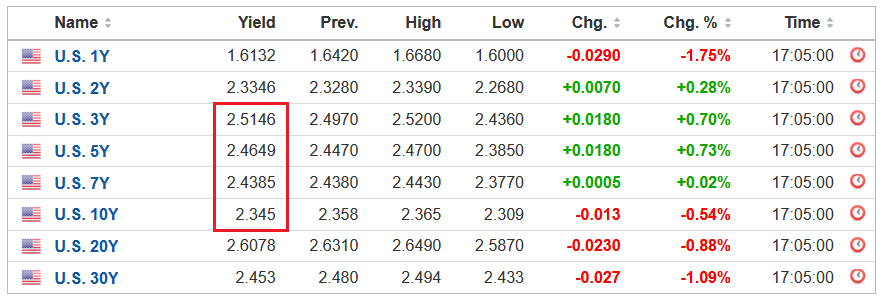 Source: Investing.com
To explain, the red box above highlights how the U.S. 3-Year, 5-Year and 7-Year Treasury yields ended the Mar. 31 session higher than the U.S. 10-Year Treasury yield. As a result, those curves have inverted, which is the opposite of what the Fed wants.
Conversely, an upward sloping yield curve results in longer-dated maturities having higher interest rates. And this occurs because longer maturities have more duration risk, and therefore, investors should be compensated with higher yields.
However, with the three-year at ~2.51% and the 10-year at ~2.35%, the short-end of the curve is pricing in rampant rate hikes, while the medium to long-end of the curve is pricing in a material slowdown in growth. As a result, long-end bond investors are correctly (likely) predicting that the Fed’s expeditious rate hike cycle will scar the U.S. economy. Thus, the lose-lose situation should have drastic implications for risk assets over the medium term.
For your reference, the 10-2 spread is also close to inverting as well, with the U.S. 2-Year Treasury yield ending the Mar. 31 session at ~2.33%. However, please note that the ramifications don’t imply lower interest rates. In fact, the U.S. 10-Year Treasury yield often climbs when the Fed hikes interest rates. However, short-term interest rates may increase at a faster pace. To explain, I wrote on Jan. 19:
If the U.S. 10-Year Treasury yield declines in 2022, it will defy nearly 40 years of historical precedent.
Please see below:
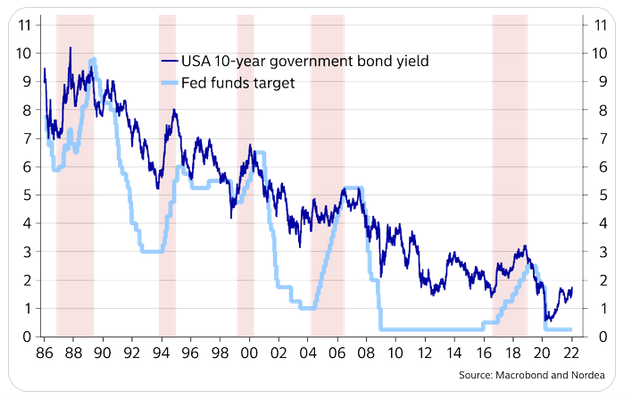
To explain, the dark blue line above tracks the U.S. 10-Year Treasury yield, while the light blue line above tracks the U.S. Federal Funds Rate. If you analyze the latter's ascents starting in 1987, 1993, 1999, 2004 and 2017, you can see that the U.S. 10-Year Treasury yield always rallies when the Fed increases the U.S. Federal Funds Rate.
Moreover, the U.S. 10-Year Treasury yield doesn't usually peak until after the Fed finishes its rate hike cycles. For example, if you focus your attention on the light blue line's highs, notice how the U.S. 10-Year Treasury yield keeps rising until the Fed stops hiking? And with a rate hike in March likely a done deal and Fed officials projecting anywhere from two to four rate hikes in 2022, is this time really different?
To that point, with the U.S. 2-Year Treasury yield rallying hard in 2022, history implies the Fed will play catch-up over the medium term.
Please see below:
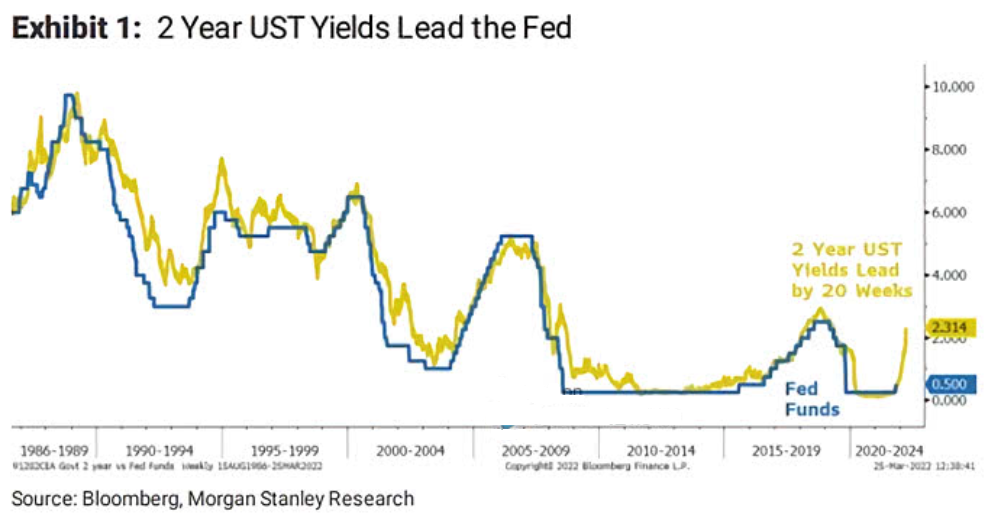
To explain, the gold line above tracks the U.S. 2-Year Treasury yield, while the blue line above tracks the U.S. federal funds rate. If you analyze the right side of the chart, you can see that the former has materially outperformed the latter.
However, Morgan Stanley found that the U.S. 2-Year Treasury yield often leads the U.S. federal funds rate by 20 weeks. As such, with the former already moving sharply higher, a dovish pivot by the Fed would also defy nearly 40 years of historical precedent.
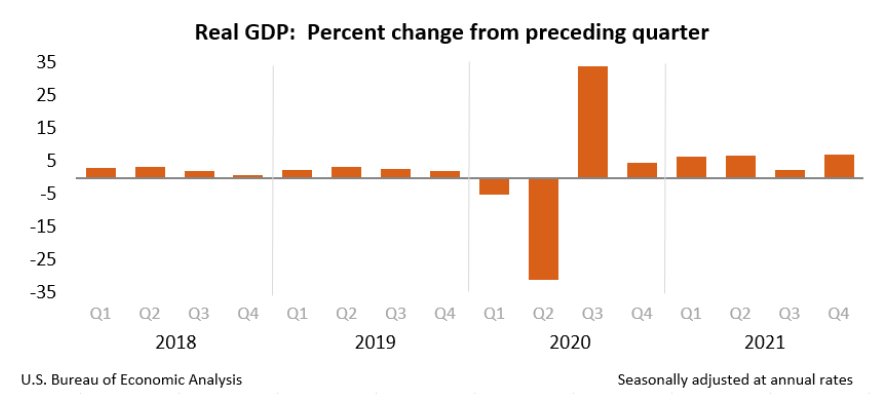
Likewise, with U.S. economic data still on solid ground, the Fed should remain on autopilot for the foreseeable future. For example, while it’s a lagging indicator, and therefore less relevant, the U.S. Bureau of Economic Analysis (BEA) revealed on Mar. 30 that U.S. real GDP “increased at an annual rate of 6.9 percent in the fourth quarter of 2021.” For context, U.S. real GDP was running at roughly 2% pre-COVID-19.
Please see below:
On top of that, the BEA revealed on Mar. 31 that the Personal Consumption Expenditures (PCE) Index (the Fed’s main inflation gauge) increased by a new 2022 high of 6.4% year-over-year (YoY). For context, the values at the top represent month-over-month (MoM) percentage changes, while the values at the bottom represent YoY percentage changes.
Please see below:
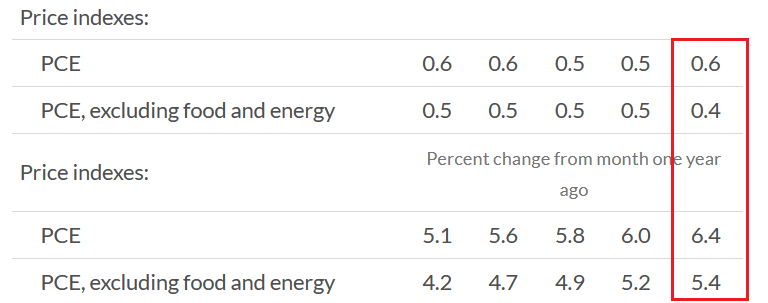 Source: BEA
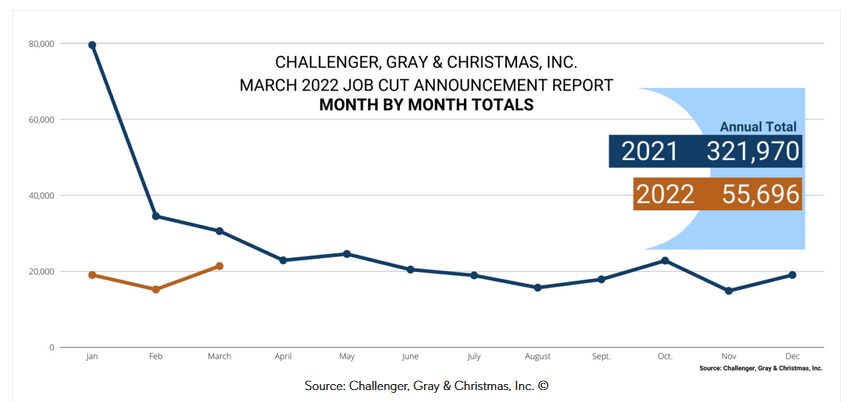
Finally, Challenger, Gray, and Christmas released their jobs cuts data on Mar. 31. In a nutshell: it tallies how many employees were fired in March. And while cuts increased by 40.3% MoM, they still declined by 30% YoY. As a result, the data does little to cool the red-hot U.S. labor market. For context, the report also stated:
“In the first quarter of 2022, employers announced 55,696 cuts, down 62% from the 144,686 cuts announced through the same period in 2021. It is the lowest quarterly total since the third quarter of 2021, when 52,560 cuts were recorded.”
Please see below:
The bottom line? While some investors think the Fed can engineer a “soft landing,” the data suggests otherwise. Moreover, with job openings, retail sales, and input and wage inflation tracking well ahead of their pre-pandemic trends, normalizing these metrics requires sharp declines. Thus, reducing annualized inflation from ~8% to 2% requires much more demand destruction than reducing it from 4% to 2%. As a result, investors underestimate the medium-term economic slowdown that will likely unfold during the Fed’s accelerated rate hike cycle.
What to Watch for Next Week
With another full slate of U.S. economic data releases next week, the most important are as follows:
- Apr. 4: The Confidence Board Employment Trends Index (ETI)
With the Fed still fixated on employment, the ETI is a leading indicator of the health of the U.S. labor market.
- Apr. 5: The Institute for Supply Management (ISM) and S&P Global services PMIs.
As a leading indicator of service sector activity, data from the ISM and S&P Global provides a window into the performance of the businesses hardest hit by the pandemic. Moreover, with the service sector poised to grab the inflation baton from manufacturing, it will be interesting to see how these companies respond to the pricing pressures.
All in all, economic data releases impact the PMs because they impact monetary policy. Moreover, if we continue to see higher employment and inflation, the Fed should keep its foot on the hawkish accelerator. And if that occurs, the outcome is profoundly bearish for the PMs.
Thank you for reading our free analysis today. Please note that the above is just a small fraction of the full analyses that our subscribers enjoy on a regular basis. They include multiple premium details such as the interim targets for gold and mining stocks that could be reached in the next few weeks. We invite you to subscribe now and read today’s issue right away.
Sincerely,
Przemyslaw Radomski, CFA
Founder, Editor-in-chief -
The USDX Rocket Is Ready to Take Off: Gold Doesn’t Fit Aboard
March 31, 2022, 8:22 AMGold and the USD act as if they are swinging on a seesaw. However, the apparent idyll cannot last forever – one of the assets will have to be grounded.
The back-and-forth movement in both gold and miners continues. However, as GDXJ keeps trading below its rising support line, the breakout below it becomes confirmed, and the movements that we saw at the same time in gold and the USD Index suggest that the former is ready to slide once the latter rallies. Let’s take a closer look, starting with the GDXJ.
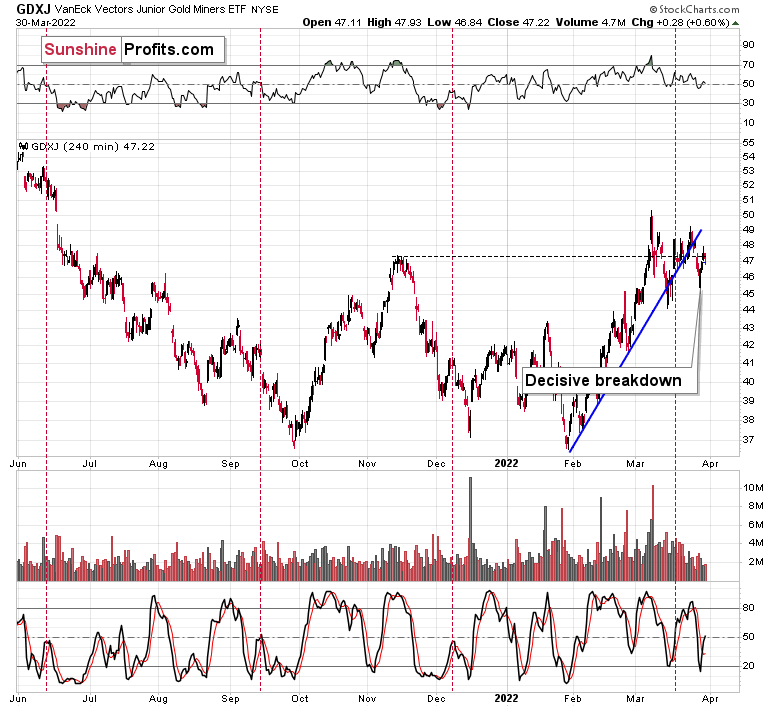
Yesterday’s move in the ETF was rather insignificant, and that’s precisely what makes it… significant.
What I mean is that insignificant moves after a breakdown are a perfect way for the market to take a breather before declining further. In other words, the previous breakdown makes yesterday’s irrelevant price action relevant and bearish.
Consequently, my yesterday’s comments on the above chart remain up-to-date:
Yesterday’s breakdown below the rising support line was not invalidated.
We saw a move higher on volume that was not strong, which suggests that yesterday’s session was not a true reversal. Low volume suggests that it was a correction, and the fact that junior miners have just broken below their rising support line means that it makes perfect sense for them to correct now.
Consequently, yesterday’s action wasn’t really bullish for junior miners when we take the context into account. Speaking of context, let’s not forget about yesterday’s action in the USD Index.
The USD Index declined significantly yesterday, which means that gold, silver, and mining stocks “should have” rallied. After all, based on the USD’s decline, their prices (quoted in USD terms) became lower for non-USD buyers. So, the fact that silver and gold were practically flat yesterday is actually bearish for them, because it means they underperformed. Gold miners moved higher, but given that the USD Index declined visibly and the general stock market rallied, it would be natural for miners to rally more than they did. Taking all this into account, miners were not really strong yesterday.
If we focus on the USD Index alone, we’ll see that yesterday’s decline was absolutely inconsequential with regard to changing the outlook for the USDX. It simply continues to consolidate after a breakout above the mid-2020 highs. Breakout + consolidation = increasing chances of rallies’ continuation. A big wave up in the USD Index is likely just around the corner, and the precious metal sector is likely to decline when it materializes.
As the war-based premiums in gold and the USD appear to be waning, a high-interest-rate-driven rally in the USD is likely to trigger declines in gold. The correlation between these two assets has started to decline. When that happened during the last two cases (marked with orange), gold plummeted profoundly shortly thereafter.
What happened after we posted the above?
The USD Index had declined, and gold had rallied (yesterday), and then (today) the USD Index moved back up by just a little while gold declined strongly.
Gold is once again in a situation where it magnifies the USD’s bearish indications while largely ignoring the USD’s bullish indications.
This is a perfectly bearish sign for the short term, because it means that if the USD Index moves back and forth, then gold will most likely continue its downtrend, declining when the USD is up, and pausing when it’s down.
However, the USD Index is not likely to continue to move back and forth for long – quite the opposite. The USD Index has just verified its breakout above the mid-2020 high for the third time (without moving below it; the strong support held!), which means that it’s now very likely that it will simply continue its uptrend.
Based on how gold is now reacting to USDX’s movement, the uptrend in the USD Index would be likely to trigger significant declines in gold. This would be likely to translate into lower silver and mining stock prices.
All in all, technicals favor a decline in the precious metals sector sooner rather than later.
Thank you for reading our free analysis today. Please note that the above is just a small fraction of the full analyses that our subscribers enjoy on a regular basis. They include multiple premium details such as the interim targets for gold and mining stocks that could be reached in the next few weeks. We invite you to subscribe now and read today’s issue right away.
Sincerely,
Przemyslaw Radomski, CFA
Founder, Editor-in-chief


Gold Investment News
Delivered To Your Inbox
Free Of Charge
Bonus: A week of free access to Gold & Silver StockPickers.
Gold Alerts
More-
Status
New 2024 Lows in Miners, New Highs in The USD Index
January 17, 2024, 12:19 PM -
Status
Soaring USD is SO Unsurprising – And SO Full of Implications
January 16, 2024, 8:40 AM -
Status
Rare Opportunity in Rare Earth Minerals?
January 15, 2024, 2:06 PM

