
tools spotlight

-
With the Russia-Ukraine War, Gold’s Safe-Haven Status Lasts
April 13, 2022, 9:26 AMWhile several asset classes have suffered immense stress in recent weeks, the PMs have remained relatively elevated. Moreover, concerns have arisen that since the Russian central bank pegged the ruble to gold, it helps uplift the yellow metal.
For context, the Russian central bank announced on Mar. 25 that it would pay 5,000 rubles ($52) per gram of gold. This allowed the USD/RUB to garner an exchange rate of ~96.15 (5,000/52). However, the important point is that the policy was aimed at supporting the ruble, not the PMs.
To explain, when Russia invaded Ukraine, NATO responded with seismic sanctions. As a result, the USD/RUB rallied to an all-time high of 121.21. However, the threats worked perfectly for Russia, as the USD/RUB is now at ~79.68 and lower than the 85.28 recorded pre-invasion. Furthermore, Russian President Vladimir Putin attempted the same feat when he said that all Russian gas exports would need to be paid for in rubles.
A Reuters article stated:
"Putin's order to charge 'unfriendly' countries in rubles for Russian gas boosted the Russian currency after it plunged to all-time lows when the West imposed sweeping sanctions on Moscow for its invasion of Ukraine. European gas prices also rocketed up."
However, with the ruble strengthening materially in recent weeks, the policy is no longer needed.
Please see below:
Likewise, it’s the same story for the PMs. After announcing the fixed peg on Mar. 25, the Kremlin scrapped that policy on Apr. 7, since the ruble is strong enough and doesn’t need any indirect support.
Please see below:
Furthermore, the Russian central bank cited a "significant change in market conditions" for reversing the policy. In a nutshell: since the ruble is stronger than it was before the invasion, the currency impact of sanctions is immaterial. Therefore, the central bank is happy to let the ruble float.
Please see below:
All in all, the moves made by the Russian central bank were designed to support the ruble. When a currency plunges, the FX-adjusted cost of imports skyrockets. As such, sanctions would cripple growth, inflation would rage, and the Russian economy would suffer stagflation on steroids. However, by stabilizing the currency, Russia solves half of the problem. Thus, while the recent developments may seem like they uplifted the PMs, they're largely immaterial from a medium-term perspective.
More importantly, the PMs' domestic fundamental outlooks continue to deteriorate. For example, the U.S. 10-Year real yield hit a new 2022 high of -0.12% on Apr. 11, and closed at -0.13% on Apr. 12. Moreover, while momentum keeps the yellow metal uplifted, history shows that the current gold price is unsustainable.
Please see below:
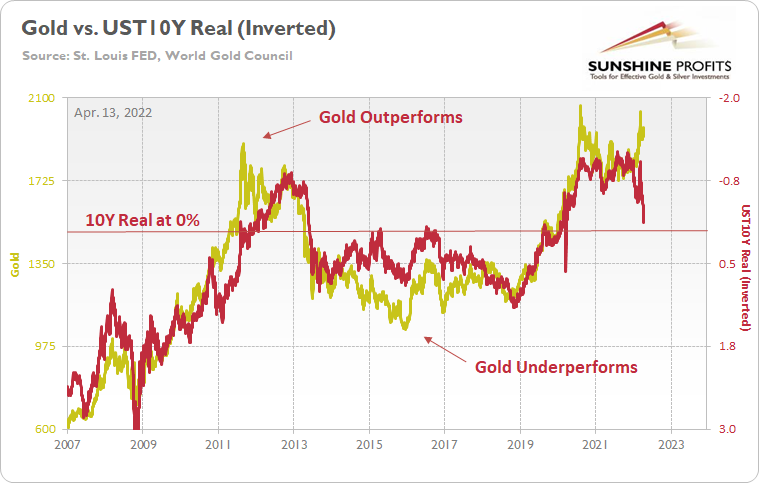
Still a Momentum Trade
To explain, the gold line above tracks the price tallied by the World Gold Council, while the red line above tracks the inverted U.S. 10-Year real yield. For context, inverted means that the latter's scale is flipped upside down and that a rising red line represents a falling U.S. 10-Year real yield, while a falling red line represents a rising U.S. 10-Year real yield.
Moreover, I wrote on Apr. 11 that gold and the U.S. 10-Year real yield have a daily correlation of -0.92 since 2007. Therefore, we must ignore 15+ years of historical data to assume that gold's best days lie ahead.
To that point, the famous quote from John Maynard Keynes is relevant here. He said that "markets can stay irrational longer than you can stay solvent." In a nutshell: the price action can make investors second-guess themselves, even when the data supports the opposite conclusion. Furthermore, if you analyze the arrows above, you can see that investors' optimism helped gold outperform the U.S. 10-Year real yield in 2011, while investors' pessimism helped gold underperform the U.S. 10-Year real yield in 2015.
As a result, sentiment rules the day in the short term, and the algorithms move in whichever direction the wind is blowing. Therefore, we find ourselves in that situation now. With the Russia-Ukraine conflict increasing gold's geopolitical appeal, safe-haven momentum remains ripe. In addition, another 2022 high in the headline Consumer Price Index (CPI) also increases gold's inflation-hedge appeal. For context, the metric increased by 8.5% year-over-year (YoY) on Apr. 12.
Please see below:
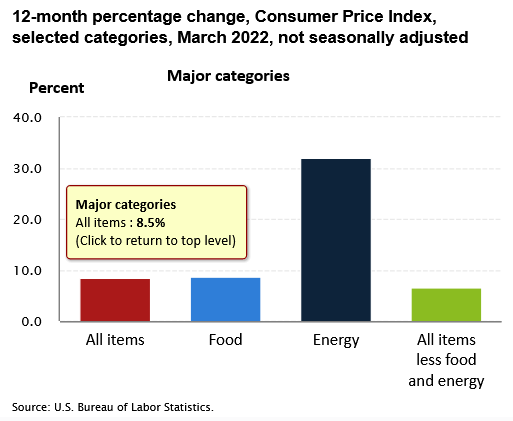
However, investors are short-sighted about the medium-term implications. While conventional wisdom implies that abnormally high inflation is bullish for the PMs, the reality is that pricing pressures awaken the Fed. Since positive real yields are essential to curb inflation, the Fed has to tighten financial conditions to achieve its goal.
To explain, I wrote on Apr. 5:
I warned throughout 2021 that a hawkish Fed and tighter financial conditions are bearish for the PMs. And while the fundamental expectation worked perfectly before the Russia-Ukraine crises erupted, the medium-term thesis is clearer now than it was then.
Please see below:
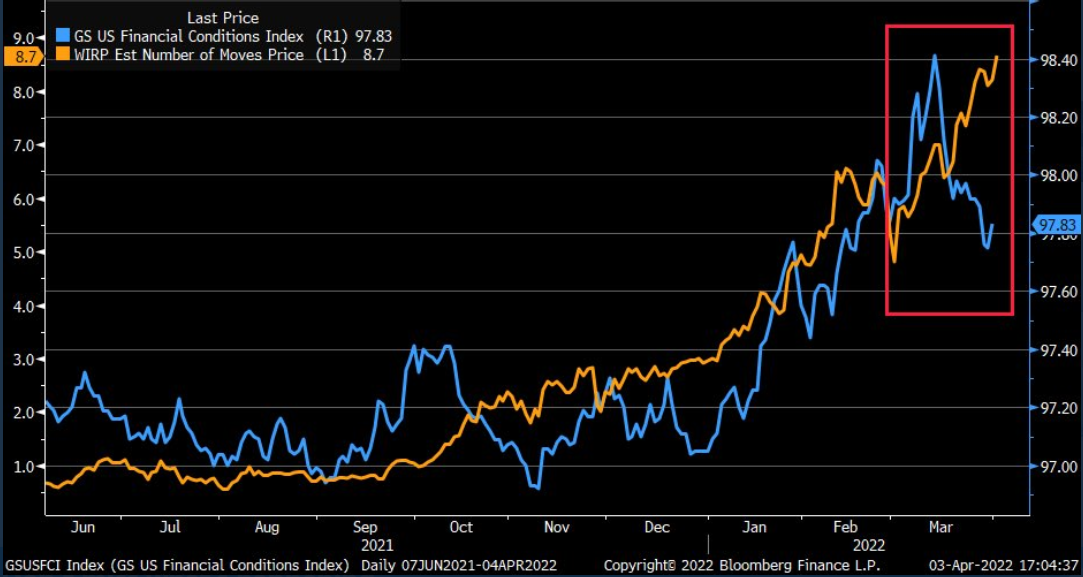
To explain, the orange line above tracks the number of rate hikes priced in by the futures market, while the blue line above tracks Goldman Sachs’ Financial Conditions Index (FCI). If you analyze the movement of the former, futures traders expect roughly nine rate hikes by the Fed in 2022.
However, if you focus your attention on the right side of the chart, you can see that the FCI has declined materially from its highs. Therefore, financial conditions are easier now than they were before the March FOMC meeting. However, the Fed needs to tighten financial conditions to calm inflation. But since market participants are not listening, Chairman Jerome Powell needs to amplify his hawkish rhetoric until the message hits home.
Think about it: if looser financial conditions are used to stimulate economic growth and inflation, how can the Fed calm the pressures without reversing the situation? Moreover, please remember that the current policy stance contributed to 8%+ annualized inflation. Thus, it’s unrealistic to materially reduce inflation from 8% to 2% without the Fed materially shifting the liquidity dynamics. Therefore, investors’ optimism will likely reverse sharply over the medium term.
To that point, while the implications of a higher FCI and higher real yields take time to play out, the Fed has upped the hawkish ante in recent days. In the process, both the bond and the stock market have changed their tones. Therefore, commodities like the PMs will likely be the last shoe to drop.
For additional context, I wrote on Feb. 2:
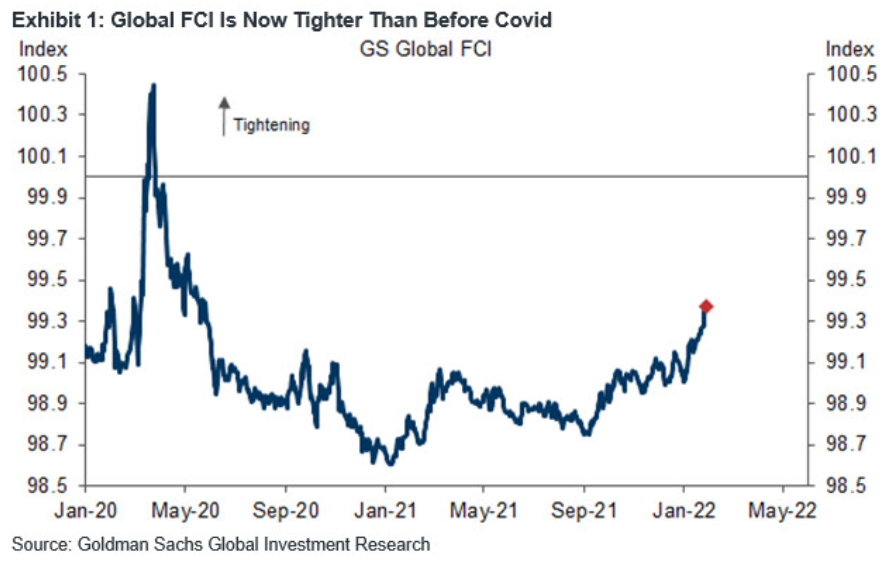
If you analyze the right side of the chart, you can see that the FCI has surpassed its pre-COVID-19 high (January 2020). Moreover, the FCI bottomed in January 2021 and has been seeking higher ground ever since. In the process, it's no coincidence that the PMs have suffered mightily since January 2021. Furthermore, with the Fed poised to raise interest rates at its March monetary policy meeting, the FCI should continue its ascent. As a result, the PMs' relief rallies should fall flat like in 2021.
Likewise, while the USD Index has come down from its recent high, it's no coincidence that the dollar basket bottomed with the FCI in January 2021 and hit a new high with the FCI in January 2022. Thus, while the recent consolidation may seem troubling, the medium-term fundamentals supporting the greenback remain robust.
Thus, while the USD Index has surpassed 100 and reflects the fundamental reality of a higher FCI and higher real yields, the PMs do not. However, the PMs are in la la land since the FCI is now at its highest level since the global financial crisis (GFC).
Please see below:
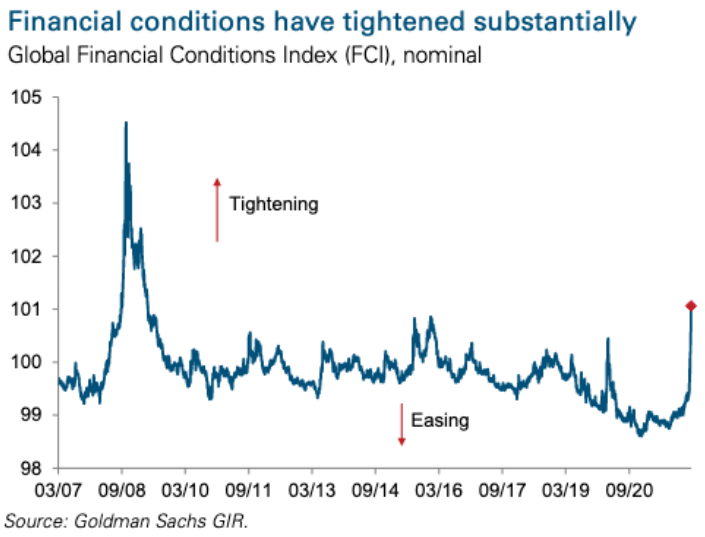
Also noteworthy, the FCI made quick work of the March 2020 high from the first chart above. Again, Fed officials know that higher real yields and tighter financial conditions are needed to curb inflation. That’s why they keep amplifying their hawkish message and warning investors of what lies ahead. However, with commodities refusing to accept this reality, they’ll likely be the hardest-hit once the Fed’s rate hike cycle truly unfolds.
Speaking of which, Fed Governor Lael Brainard said on Apr. 12: “Inflation is too high, and getting inflation down is going to be our most important task.”
She added: “I think there’s quite a bit of capacity for labor demand to moderate among businesses by actually reducing job openings without necessitating high levels of layoffs.” As a result, she’s telling you that Fed officials will make it their mission to slow down the U.S. economy.
With phrases like “capacity for labor demand to moderate” and “reducing job openings” code for what has to happen to calm wage inflation, the prospect of a dovish 180 is slim to none. As such, this is bullish for real yields and bearish for the PMs.
More importantly, notice her use of that all-important buzzword.
 Source: Reuters
And:
 Source: Reuters
Moreover, where do you think she got it?
 Source: Reuters
For context, Powell said that on Mar. 21. The bottom line? It’s remarkable how the PMs’ fundamentals can deteriorate so rapidly while sentiment remains so optimistic. However, while the Russia-Ukraine conflict keeps the momentum alive, it’s likely a long way down when the war premiums unravel.
Moreover, while real yields and financial conditions imply much lower prices for the PMs, they still have plenty of room to run over the medium term. As a result, while the permabulls may feel invincible, the fundamentals that drove the PMs’ performance over the last 15+ years couldn’t be more bearish.
In conclusion, the PMs rallied on Apr. 12, as momentum runs high across the commodity complex. However, investors either fail to foresee the medium-term consequences of the Fed’s rate hike cycle, or they simply don’t care. Either way, reality should re-emerge over the next few months, and once sentiment shifts, the PMs’ lack of fundamental foundations should result in profound drawdowns.
Thank you for reading our free analysis today. Please note that the above is just a small fraction of the full analyses that our subscribers enjoy on a regular basis. They include multiple premium details such as the interim targets for gold and mining stocks that could be reached in the next few weeks. We invite you to subscribe now and read today’s issue right away.
Sincerely,
Przemyslaw Radomski, CFA
Founder, Editor-in-chief -
Dark Clouds Over the Gold Market Form a Bearish Shape
April 12, 2022, 6:49 AMGold’s efforts misfired, silver probably faked another breakout, and gold miners aren’t doing very well either. Is there a repeat of events from a decade coming?
Yesterday’s session served as a great bearish sign, not just because of gold’s and silver’s reversals, but also because of miners’ underperformance.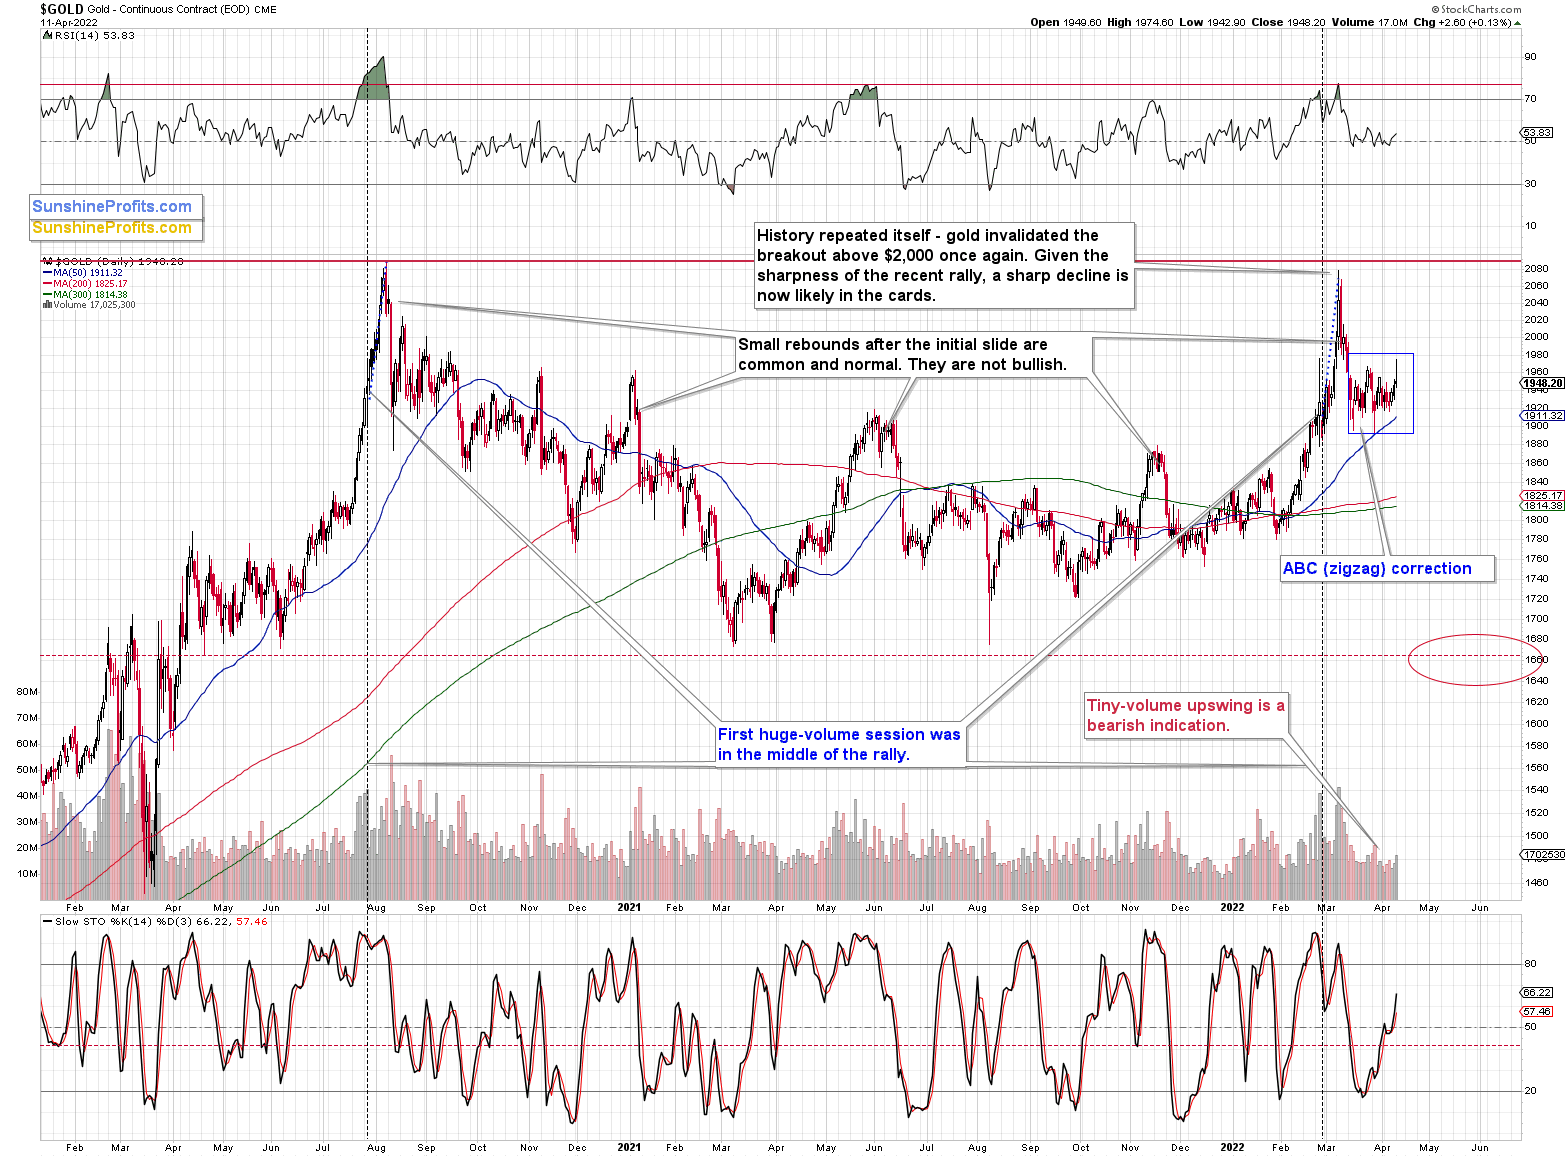
Let's take a look at gold.
During yesterday’s session, gold moved slightly above its previous local high, but then quickly invalidated this small breakout. Invalidations of breakouts in gold are a sell signal on their own, but the fact that we saw the same thing in silver makes the bearish nature of this development even more prominent.
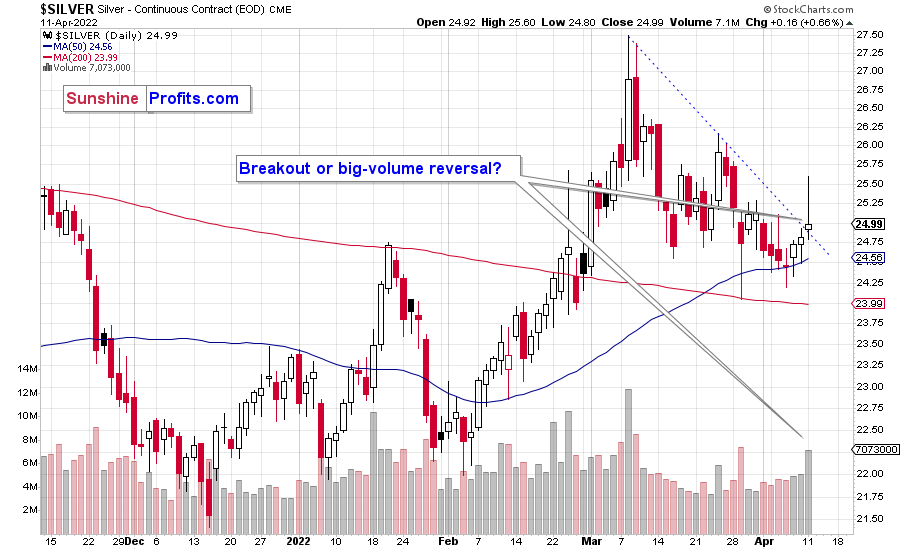
After having been relatively calm in April, silver soared above its declining resistance line… only to disappoint shortly thereafter. The white metal still closed the day slightly above the resistance line. However, given that the reversal took place on relatively high volume, the odds are that this breakout will be invalidated shortly.
In fact, it was only yesterday when I wrote that silver was known for its fake breakouts right before starting much bigger declines. It appears that we have witnessed this kind of performance once again.
While both precious metals ended the session higher, mining stocks ended it lower. This could be a sign that the top is in. Let’s take a look at junior miners’ short-term chart.
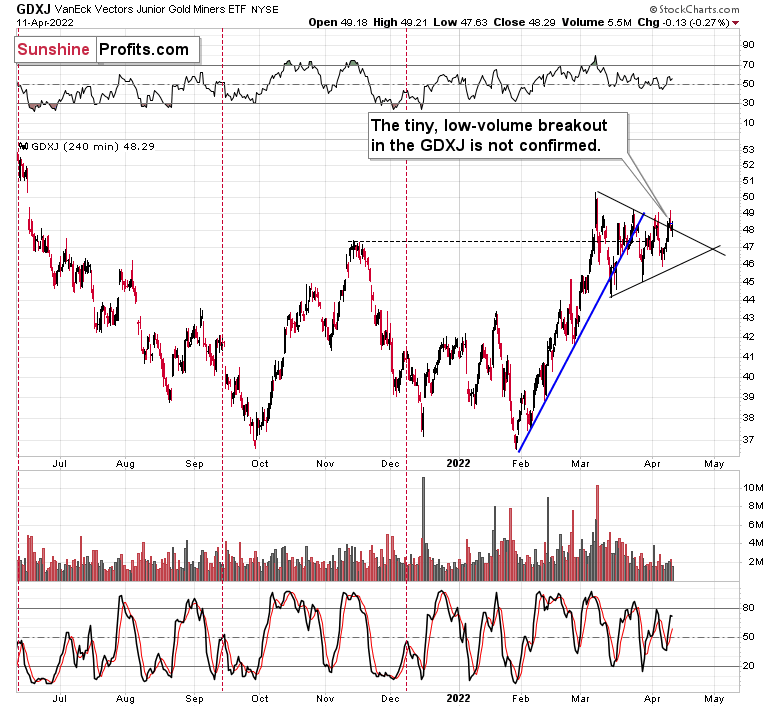
While the GDXJ ETF didn’t invalidate its tiny breakout above the triangle pattern in terms of the daily closing prices, it did move back below it on an intraday basis.
So, if gold’s and silver’s reversals are followed by lower prices, junior miners will likely invalidate the breakout and trigger more selling.
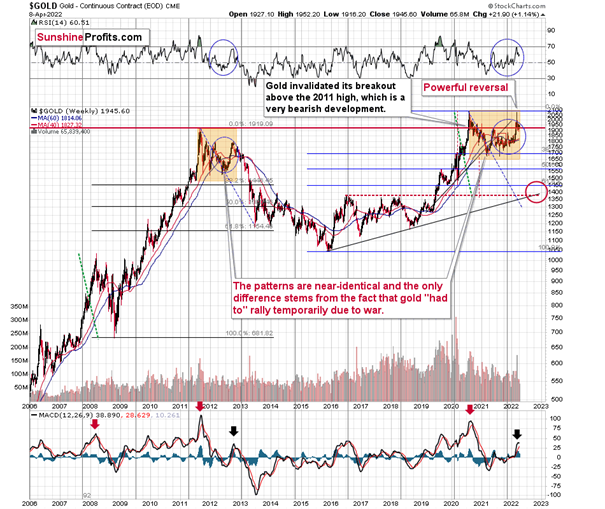
Let’s keep in mind that while gold and silver are repeating their 2012 performance, we can spot some analogies in GDXJ too.
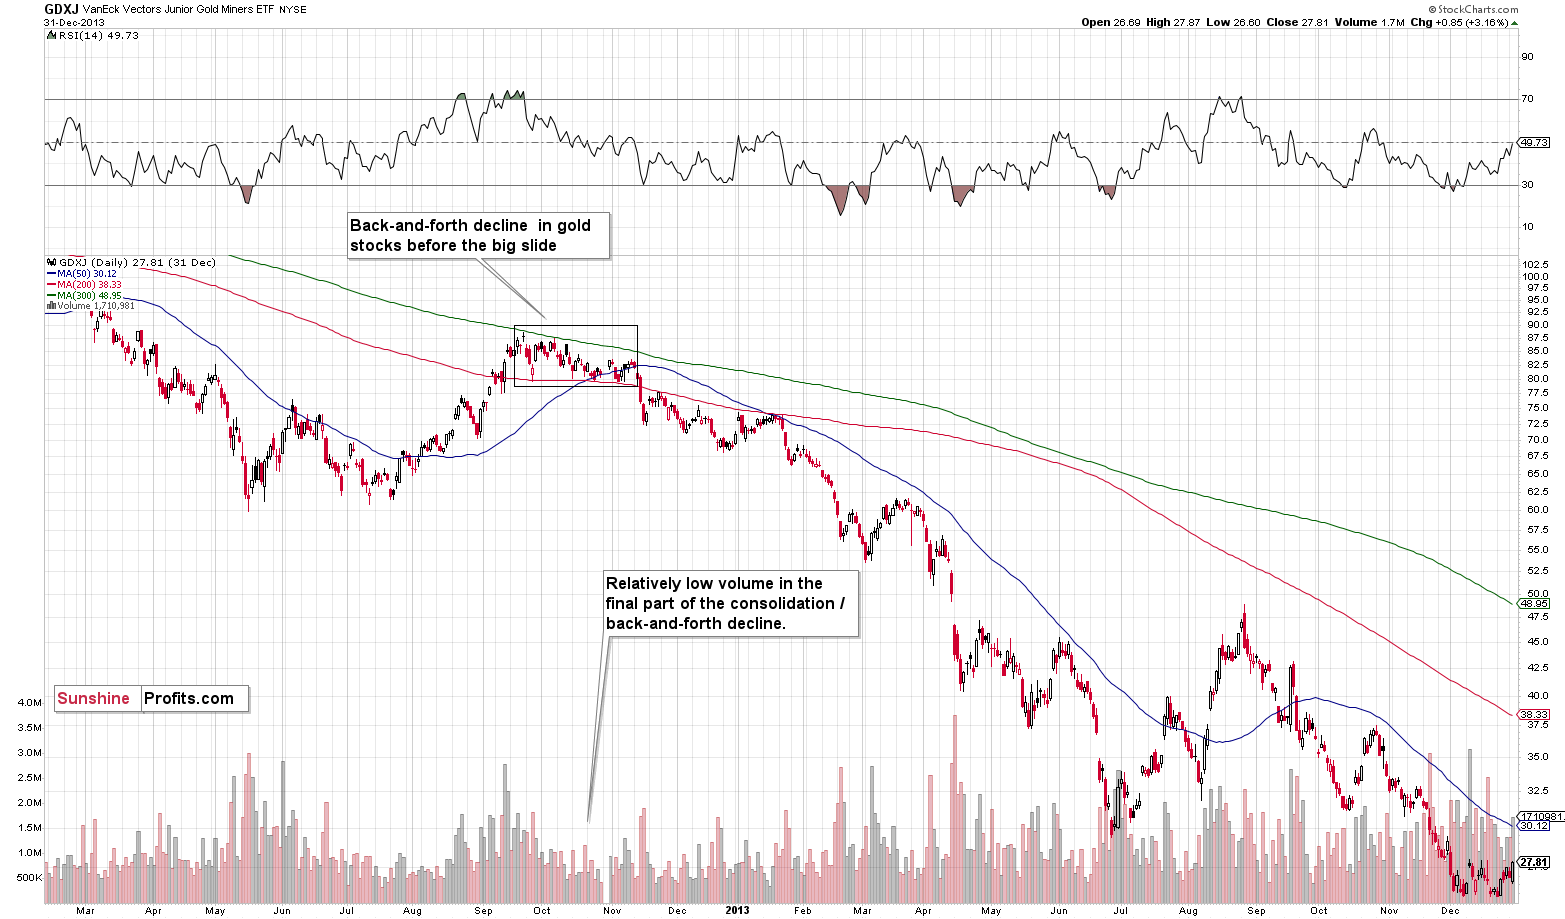
At first, in late-September 2012 and early-October 2012, junior miners consolidated, and then they declined, thus entering the back-and-forth decline mode. It happened on relatively low volume.
Right now, GDXJ is also after a consolidation that’s been taking place on relatively low volume and that followed a rather sizable short-term upswing.
What happened next in 2012?
Well, at the late-2012 top, the GDXJ closed at $87.83. Months later, it closed at $29.59, or roughly one third of its initial price. In other words, junior miners erased about two-thirds of their initial price. Yes, it was a great time for inversely trading instruments. The JDST wasn’t trading at that time yet, but DUST (which trades opposite to GDX) moved up by over 600%.
Even though the short-term outlook is somewhat unclear, the medium-term outlook for the precious metals sector remains very bearish, and the upside potential for the short positions in junior mining stocks remains enormous, in my opinion. In my view, patience is likely to be very well rewarded.
Thank you for reading our free analysis today. Please note that the above is just a small fraction of the full analyses that our subscribers enjoy on a regular basis. They include multiple premium details such as the interim targets for gold and mining stocks that could be reached in the next few weeks. We invite you to subscribe now and read today’s issue right away.
Sincerely,
Przemyslaw Radomski, CFA
Founder, Editor-in-chief -
Gold and Silver Waver - A Repeat of the 2012 Fall Coming?
April 11, 2022, 9:34 AMThe key things that I described in last week’s flagship analysis (posted on Thursday) remain up-to-date, but there are a few specific comments that I would like to make today about Friday’s session.
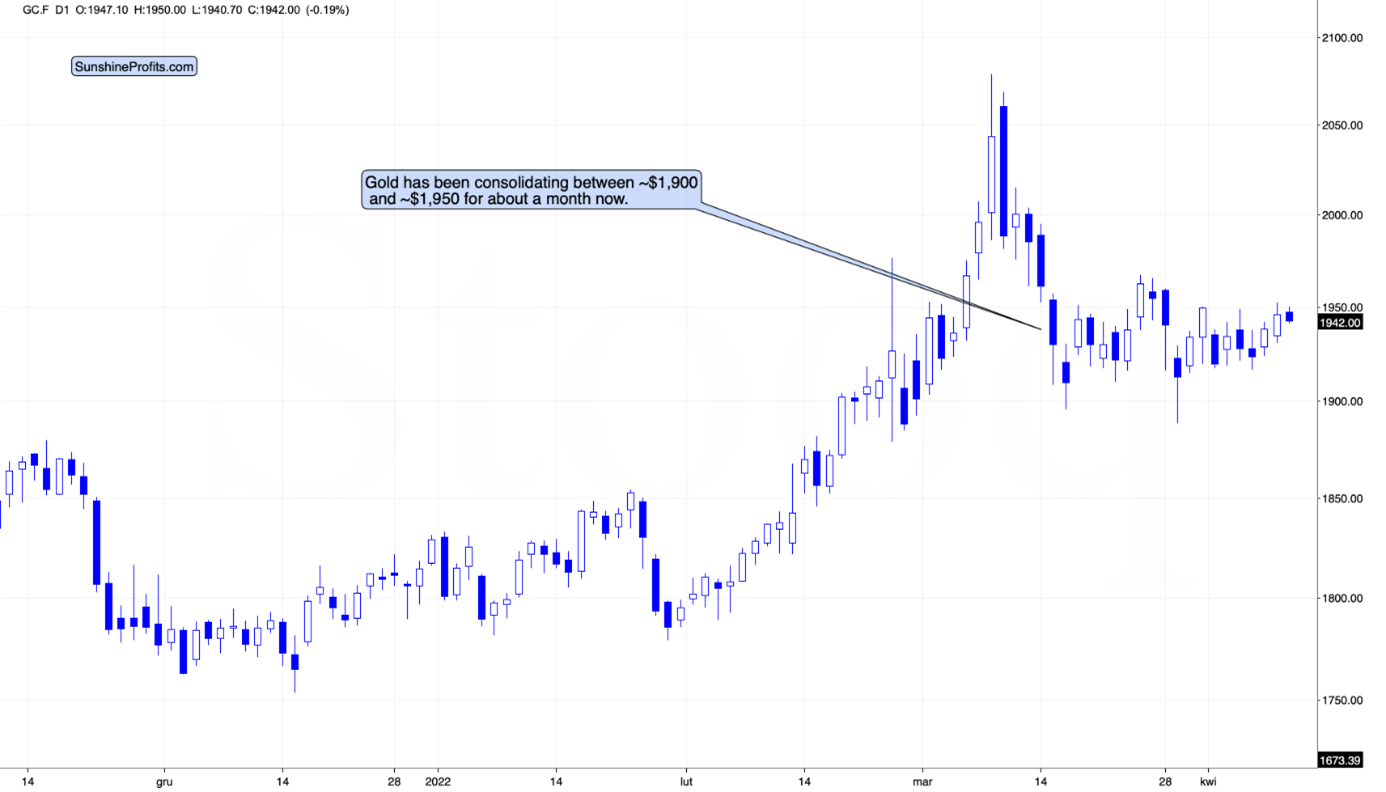
Gold prices moved higher on Friday, and they are somewhat down so far today, which means that overall the monthly consolidation continues.
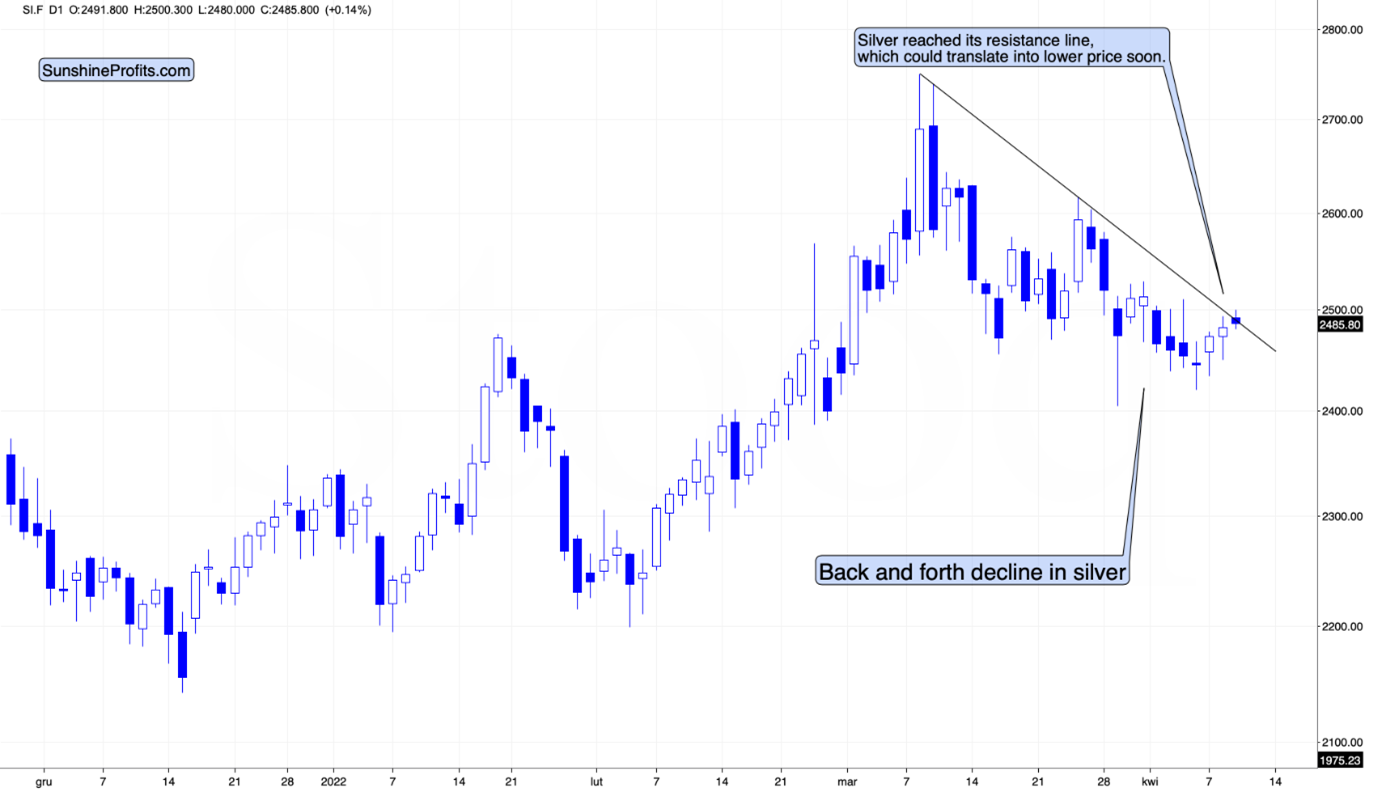
Silver prices moved higher, but it was nothing to write home about, and overall, silver continues to decline in a back-and-forth manner.
Moreover, since the white metal just moved to its declining resistance line, the odds are that we’ll see another short-term downswing shortly.
The above-mentioned moves in gold and silver are in perfect tune with what we saw in 2012 in both precious metals right after the final pre-slide top.
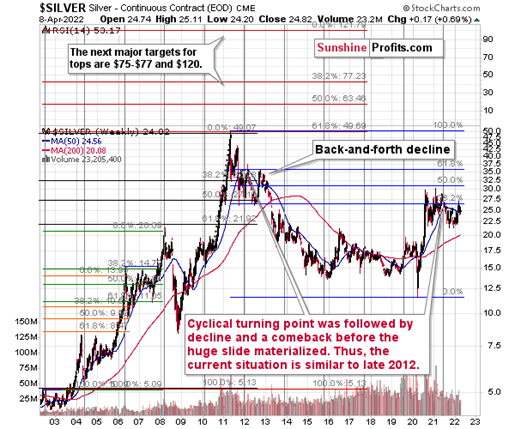
In both cases, the decline first took the form of a back-and-forth move lower, which is generally what we see on the charts right now. Therefore, lower, not higher, values of precious metals are to be expected in the medium term, even though it’s not 100% clear when the short-term consolidation will end.
Silver’s move to its declining resistance line suggests that another short-term decline is just around the corner, but then again, silver is known for fake breakouts right before declining, so it wouldn’t be surprising to see some short-term strength before a much bigger decline resumes.
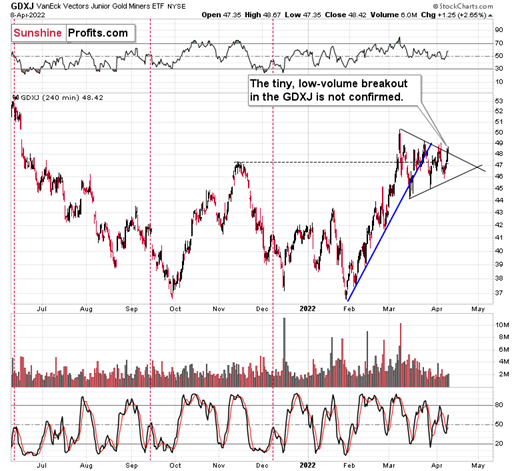
Junior miners moved slightly above their triangle pattern, but this breakout is far from being confirmed. The GDXJ closed the day just slightly above the upper border of the triangle, and the move took place on relatively low volume. This indicates that market participants are not convinced that the next move will really be to the upside.
Also, since I already wrote about the similarity to 2012 in gold and silver, let’s see how GDXJ performed at that time.

In short, it performed similarly.
At first, in late-September 2012 and early-October 2012, junior miners consolidated, and then they declined, thus entering the back-and-forth decline mode. It happened on relatively low volume.
What happened next?
Well, at the late-2012 top, the GDXJ closed at $87.83. Months later, it closed at $29.59, or roughly one third of its initial price. In other words, junior miners erased about two-thirds of their initial price. Yes, it was a great time for inversely trading instruments. The JDST wasn’t trading at that time yet, but DUST (which trades opposite to GDX) moved up by over 600%.
Even though the short-term outlook is somewhat unclear, the medium-term outlook for the precious metals sector remains very bearish, and the upside potential for the short positions in junior mining stocks remains enormous, in my opinion. In my view, patience is likely to be very well rewarded.
Thank you for reading our free analysis today. Please note that the above is just a small fraction of the full analyses that our subscribers enjoy on a regular basis. They include multiple premium details such as the interim targets for gold and mining stocks that could be reached in the next few weeks. We invite you to subscribe now and read today’s issue right away.
Sincerely,
Przemyslaw Radomski, CFA
Founder, Editor-in-chief -
Gold Investors: High Time to Treat Market Threats Seriously?
April 8, 2022, 9:26 AM
The rising USDX and more interest rate hikes prospect don’t seem to bother investors. Meanwhile, gold’s outlook for 2022 has worsened significantly.With the bond market unhinged and equities pretending that all is well, the PMs look like the cleanest shirts in the basket of dirty laundry. For example, bond prices often move inversely to stock prices. When stocks fall, bonds are bid, and the latter serves as a hedge against uncertainty and volatility.
However, with inflation raging and the Fed hawked up, bond prices have been falling, yields have been rising, and risk-on/risk-off sentiment has done little to reassert the historical relationship. However, keep in mind, the bond market is pricing in the implications of the Fed’s war on inflation, while the general stock market and the PMs are not. As such, U.S. Treasuries’ safe-haven bid has evaporated, and in this upside-down world, stocks and commodities are incurring much less volatility.
Thus, please remember that short-term moves in the financial markets are not based on fundamentals. Instead, algorithms analyze sentiment indicators, and as long as momentum is bullish, why worry about medium-term fundamentals?
Think of it like this: we could present a quantitative trader with data that supports medium-term caution. However, he would respond with… who cares? In reality, momentum investors are so short-term-oriented that their strategy is to ride the wave higher and bolt at the first sign of trouble. As a result, with the PMs exhibiting less volatility, momentum investors haven’t seen the red flags that would cause them to exit their positions.
Furthermore, a subscriber asked me if “gold is now the only risk-off asset left standing” and if “this would explain why gold has been so resilient.” To answer, the conclusion is spot on.
With investors hiding out in gold despite its domestic fundamentals falling off a cliff, the Russia-Ukraine crisis has provided cover for overzealous investors. However, while gold permabulls use the elevated price to justify their narrative, the reality is that “those who cannot remember the past are condemned to repeat it.”
For context, we expect the PMs to soar over the long term. However, with the Fed hawked up and its rate hike cycle just beginning, we should witness sharp drawdowns before their secular bull markets continue.
To that point, I’ve written a lot about U.S. real yields over the last several months. With the metric bullish for the USD Index and bearish for the PMs, I warned on Feb. 7 that the former’s short-term pullback contrasted with fundamental reality. I wrote:
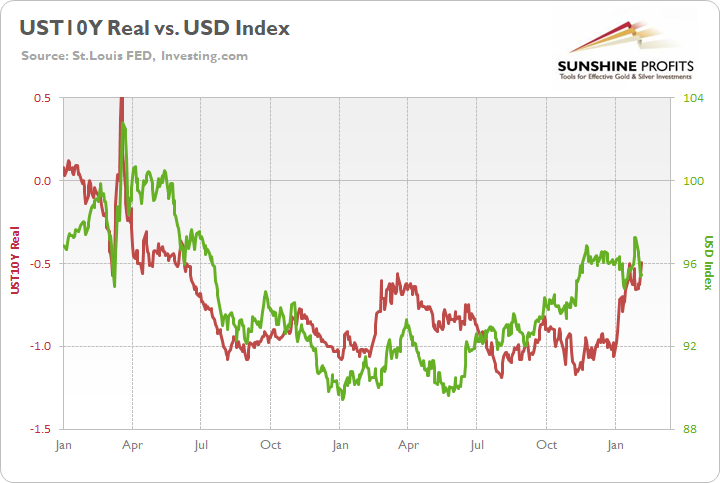
To explain, the green line above tracks the USD Index since January 2020, while the red line above tracks the U.S. 10-Year real yield. While the latter didn’t bottom in January 2021 like the USD Index and the FCI (though it was close), all three surged in late 2021 and hit new highs in 2022. Moreover, the U.S. 10-Year Treasury nominal and real yields hit new 2022 highs on Feb. 4.
Furthermore, with the Fed likely to raise interest rates at its March monetary policy meeting, a realization supports a higher U.S. 10-Year real yield, and a higher FCI. As a result, the fundamentals underpinning the USD Index remain robust, and short-term sentiment is likely responsible for the recent weakness.
Therefore, while the algorithms won the short-term battle, the fundamentals won the medium-term war. Moreover, with the U.S. 10-Year real yield surging in recent weeks, the USD Index has responded as expected.
Please see below:
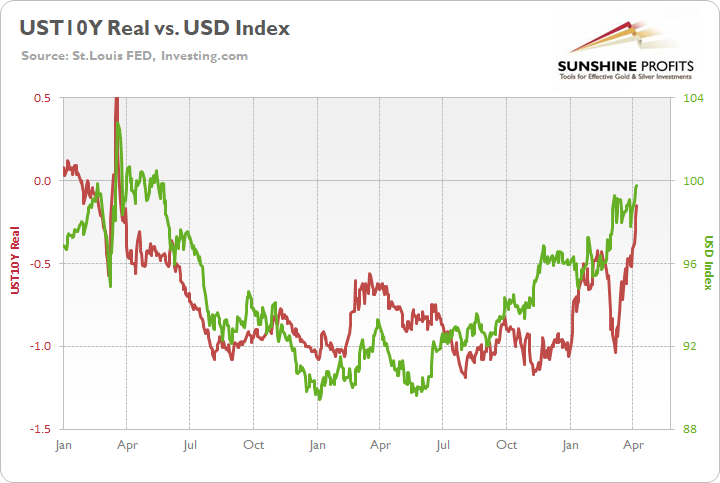
However, gold prices’ persistent optimism is similar to the USD Index’s pullback in February. For example, the algorithms pushed the USD Index lower when momentum turned. However, reality re-emerged as time passed. Likewise, the algorithms are pushing the PMs higher now, but reality should also re-emerge over the next few months.
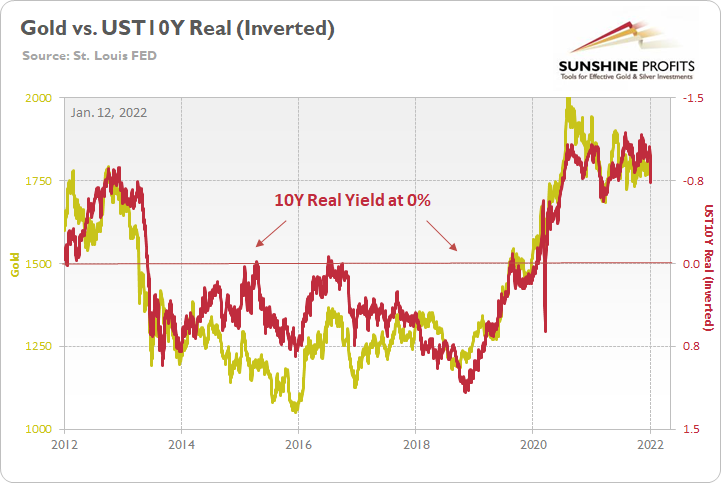
To explain, I wrote on Jan. 12:
The PMs are less volatile than speculative assets. However, it's important to remember that gold, silver, and mining stocks peaked amid the liquidity-fueled surge in the summer of 2020. Likewise, their uprisings coincided with real interest rates that were at all-time lows at the time.
Conversely, with the Fed's liquidity drain already unfolding and real interest rates poised to rise in the coming months, the PMs should suffer from the likely re-pricings. For example, when the U.S. 10-Year real yield was at 0% or higher from June 2013 until October 2018, gold was stuck below $1,400 during that timeframe and actually fell below $1,100. As a result, if the Fed pushes its hawkish chips into the middle, don't be surprised if the PMs fold in 2022.
Please see below:
To that point, the U.S. 10-Year real yield has surged in 2022, and hawkish remarks from the Fed lifted the metric to -0.16% on Apr. 7.
Please see below:
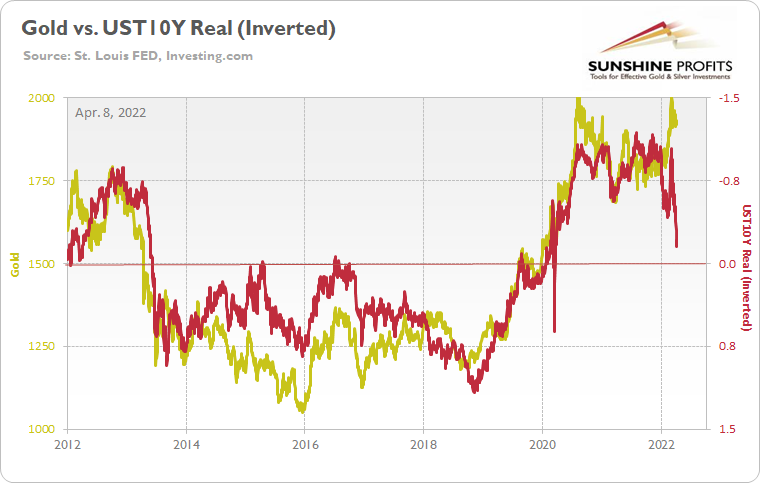
For your reference, the gold line above tracks the gold futures price, while the red line above tracks the inverted U.S. 10-Year real yield. For context, inverted means that the latter’s scale is flipped upside down and that a rising red line represents a falling U.S. 10-Year real yield, while a falling red line represents a rising U.S. 10-Year real yield.
If you analyze the left side of the chart, you can see that when the U.S. 10-Year real yield surged during the 2013 taper tantrum (depicted by the red line moving sharply lower), gold plunged by more than $500 in less than six months.
Moreover, if you focus your attention on the right side of the chart, you can see that the U.S. 10-Year real yield is gunning for neutral, and the Fed needs to push the metric above 0% to curb inflation.
As a result, the data couldn’t be clearer, and the fundamental outlooks for the USD Index and the U.S. 10-Year real yield are more bullish now than at the end of 2021. However, because algorithms rule the day in the short term, the timing of when reality will resurface is unclear.
Despite that, if we remove the Russia-Ukraine conflict from the equation, this is one of the worst medium-term fundamental setups for gold in a long time. Therefore, while the permabulls will shout that “this time is different,” history shows that the yellow metal can only ignore rising real yields for so long.
Furthermore, I wrote on Apr. 7 that the FOMC minutes show officials plan to raise interest rates several times in the coming months. Moreover, their use of terms like “faster,” “rapid” and “expeditiously” is not bullish for the PMs or the S&P 500. In addition, the crew also pledged to start reducing the balance sheet by ~$95 billion per month “at a coming meeting.” Likewise, the Fed minutes also stated:
“Many participants noted that one or more 50 basis point increases in the target range could be appropriate at future meetings, particularly if inflation pressures remained elevated or intensified. A number of participants noted that the Committee's previous communications had already contributed to a tightening of financial conditions, as evident in the notable increase in longer-term interest rates over recent months.”
As a result, the medium-term outlook remains unchanged: the Fed could double up its rate hikes at “one or more” meetings, and the future path depends heavily on inflation. However, with the latter still raging, the chances of a dovish pivot are slim to none.
As evidence, the Institute for Supply Management (ISM) released its U.S. Services PMI on Apr. 5. Moreover, the headline index increased from 56.5 in February to 58.3 in March. The report revealed:
“Prices paid by services organizations for materials and services increased in March for the 58th consecutive month, with the index registering 83.8 percent, 0.7 percentage point higher than the February figure of 83.1 percent. This is its second-highest reading ever, behind the seasonally adjusted figure of 83.9 percent registered in December 2021.”
In addition:
“Employment activity in the services sector grew in March after contracting in February. ISM’s Services Employment Index registered 54 percent in March, up 5.5 percentage points from the reading of 48.5 percent registered in February. Comments from respondents include: ‘Labor shortages seem to be improving as omicron has waned’ and ‘Hiring back to normal levels.’
As such, all of this is bullish for Fed policy.
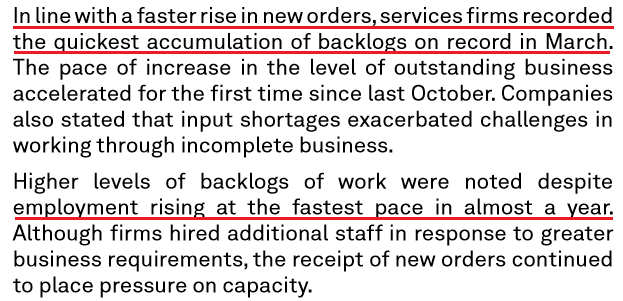
Likewise, S&P Global also released its U.S. Services PMI on Apr. 5. Here, the headline index increased from 56.5 in February to 58.0 in March. The report revealed:
“On the price front, firms recorded a substantial increase in output charges during March. The rise in selling prices was the sharpest on record (since October 2009), as service providers reportedly passed through higher costs to clients, where possible.”
For more context:
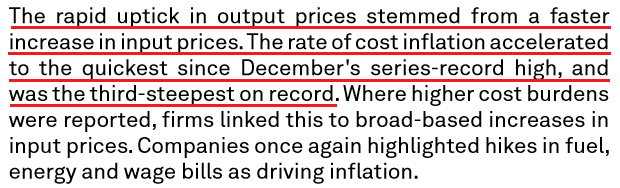 Source: S&P Global
Even more bullish for Fed policy:
 Source: S&P Global
The bottom line? While momentum remains gold and silver’s best friend, their domestic fundamental outlooks have deteriorated sharply in 2022. The USD Index and U.S. real yields have risen dramatically, and the Fed has turned the hawkish dial up from 60 to 100. However, the PMs have largely ignored all of these troubling developments.
Despite that, though, history shows that technicals and fundamentals win out over the medium term. Moreover, while sentiment remains uplifted for now, the pendulum can swing without warning. When this occurs, the PMs will confront one of the worst domestic fundamental environments since late 2018.
In conclusion, the PMs rallied on Apr. 7, as momentum doesn’t die easily. However, with the bearish medium-term thesis becoming clearer by the day, investors are fighting a battle they haven’t won in 10 years. As a result, while the timing remains uncertain, the PMs should suffer profound drawdowns once sentiment shifts.
Thank you for reading our free analysis today. Please note that the above is just a small fraction of the full analyses that our subscribers enjoy on a regular basis. They include multiple premium details such as the interim targets for gold and mining stocks that could be reached in the next few weeks. We invite you to subscribe now and read today’s issue right away.
Sincerely,
Przemyslaw Radomski, CFA
Founder, Editor-in-chief -
Russian Invasion and the Hawkish Fed: A Killer Combo for Gold?
April 7, 2022, 9:20 AMThis week belonged to the Fed, as officials finally knocked some sense into overzealous investors. For example, it began with Brainard, George, Daly, and Williams sounding the hawkish alarm, and ended with the FOMC minutes that shook the financial markets. Moreover, while the bearish fundamental implications of the Fed’s rate hike cycle are slowly being grasped by investors, I’ve been warning for weeks that a reality check would unfold. To explain, I wrote on Mar. 22:
While the PMs seem to think that the Fed’s inflation fight won’t impact their medium-term prospects, the reality is that higher real interest rates are needed to reduce inflation. And with commodity investors failing to comply, the merry-go-round of higher input prices leading to higher output prices will continue. As a result, the downside risk confronting the PMs is enormous at this point.
Remember, the Fed can only slow inflation by slowing the U.S. economy. That's why Powell keeps referencing a "soft landing" when describing the tradeoff between calming inflation and maintaining growth. However, with continued inflation of 8%+ likely to push the U.S. into recession, Powell knows that doing nothing is as bad as doing too much. As a result, investors should eventually learn that Powell's dovish days are over.
To that point, while the S&P 500 and the NASDAQ Composite have gotten the memo in recent days, the PMs still remain relatively elevated. However, while the Russia-Ukraine conflict keeps the PMs’ hopes alive for now, their medium-term fundamentals are growing more bearish by the day.
For example, the Fed released the minutes from its Mar. 15/16 policy meeting on Apr. 6. The report revealed:
“Many participants noted that – with inflation well above the Committee's objective, inflationary risks to the upside, and the federal funds rate well below participants' estimates of its longer-run level – they would have preferred a 50 basis point increase in the target range for the federal funds rate at this meeting.
“A number of these participants indicated, however, that, in light of greater near-term uncertainty associated with Russia's invasion of Ukraine, they judged that a 25 basis point increase would be appropriate at this meeting.”
However, while the Fed initially balked at a 50 basis point rate hike, the policy initiatives that should materialize over the next several months are even more bearish. For example, the report added:
“Many participants noted that one or more 50 basis point increases in the target range could be appropriate at future meetings, particularly if inflation pressures remained elevated or intensified. A number of participants noted that the Committee's previous communications had already contributed to a tightening of financial conditions, as evident in the notable increase in longer-term interest rates over recent months.”
If that wasn’t enough, the FOMC made it clear that selling assets on the balance sheet will occur at “a more rapid pace” than in 2017-2019, with a combined ~$95 billion of U.S. Treasuries and agency mortgage-backed securities (MBS) set to hit the open market each month.
Please see below:
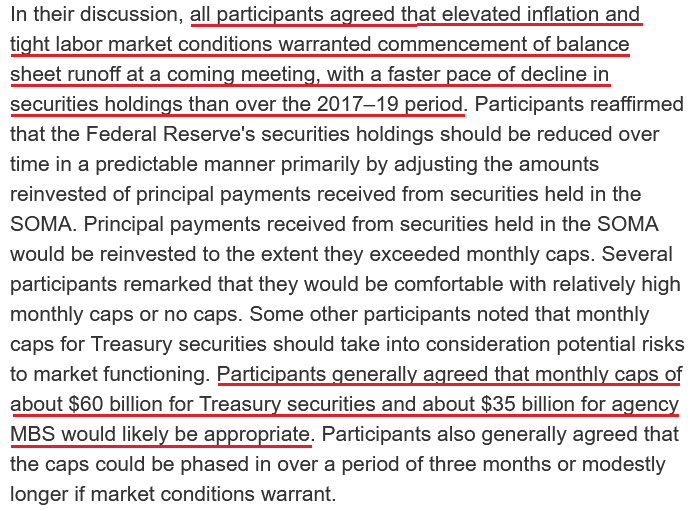 Source: U.S. Fed
In addition:
 Source: U.S. Fed
The Mid-Week Fundamental Roundup
As a result, there are those buzzwords again. With Fed officials repeating the terms “rapid” and “expeditiously” recently, investors ignored the warnings at their own peril. However, while the minutes moved markets on Apr. 6, the release didn’t include anything materially different from what Fed officials have already said over the last few weeks.
Moreover, remember what I wrote on Dec. 16 about Chairman Jerome Powell’s press conference?
As one of the most important quotes of the press conference, he admitted:
“My colleagues were out talking about a faster taper, and that doesn’t happen by accident. They were out talking about a faster taper before the president made his decision. So it’s a decision that effectively was more than entrained.”
While Powell sounded a little rattled during the exchange, his slip highlights the importance of Fed officials’ hawkish rhetoric. Essentially, when Clarida, Waller, Bostic, Bullard, etc., are making the hawkish rounds, “that doesn’t happen by accident.” As such, it’s an admission that his understudies serve as messengers for pre-determined policy decisions.
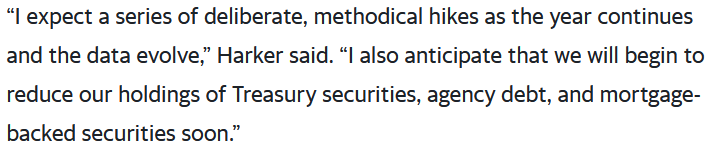
However, while investors were in la la land, the dynamic was on full display. With more than 10 Fed officials making the hawkish rounds recently, they made it clear that inflation was Public Enemy No. 1. Furthermore, Philadelphia Fed President Patrick Harker reiterated the message on Apr. 6. He said:
“Inflation is running far too high, and I am acutely concerned about this. Russia’s invasion of Ukraine will add to inflation pressure, not only hiking oil and gas prices but other commodities, like wheat and fertilizer, as well.”
As a result, he used two sentences to sum up the Fed minutes and what every other Fed official has said over the last month.
Please see below:
 Source: Bloomberg
In addition, while the S&P 500 and the NASDAQ Composite suffered on Apr. 6, they still remain materially overvalued. Moreover, the PMs have somewhat side-stepped the volatility and also remain in denial of what’s likely to unfold over the medium term. However, I warned on Apr. 6 that Fed officials should continue to pound away at the financial markets until investors finally fulfill their hawkish wishes. I wrote:
Please remember that the Fed needs to slow the U.S. economy to calm inflation, and rising asset prices are mutually exclusive to this goal. Therefore, officials should keep hammering the financial markets until investors finally get the message.
Moreover, with the Fed in inflation-fighting mode and reformed doves warning that the U.S. economy “could teeter” as the drama unfolds, the reality is that there is no easy solution to the Fed’s problem. To calm inflation, it has to kill demand. As that occurs, investors should suffer a severe crisis of confidence.
Thus, while negativity reigned supreme on Apr. 6, we’re likely in the early innings of this thesis. For more context, I wrote on Apr. 5:
To explain, the orange line above tracks the number of rate hikes priced in by the futures market, while the blue line above tracks Goldman Sachs’ Financial Conditions Index (FCI). If you analyze the movement of the former, futures traders expect roughly nine rate hikes by the Fed in 2022.
However, if you focus your attention on the right side of the chart, you can see that the FCI has declined materially from its highs. Therefore, financial conditions are easier now than they were before the March FOMC meeting.
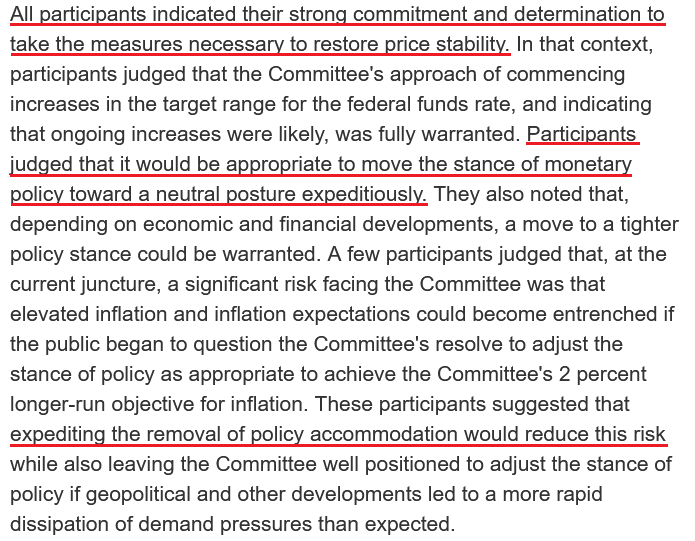
Please remember that loose financial conditions impair the Fed’s ability to achieve its inflation goal. As such, we should expect tighter financial conditions over the medium term, and the FOMC made that point clear in the minutes.
Please see below:
 Source: U.S. Fed
Therefore, please remember that loose financial conditions are bullish for the PMs, while tighter financial conditions are bearish. With Fed officials actively trying to push the blue line above higher, several asset classes should suffer from the Fed’s hawkish disposition. In a nutshell: lower stock and commodity prices and a stronger U.S. dollar help the Fed achieve its inflation goal. The opposite does not.
Also noteworthy, with inflation a political liability for the Biden Administration (which I’ve noted on several occasions), the chances of a dovish pivot are slim to none. Thus, is it wise to fight the Fed?
Please see below:
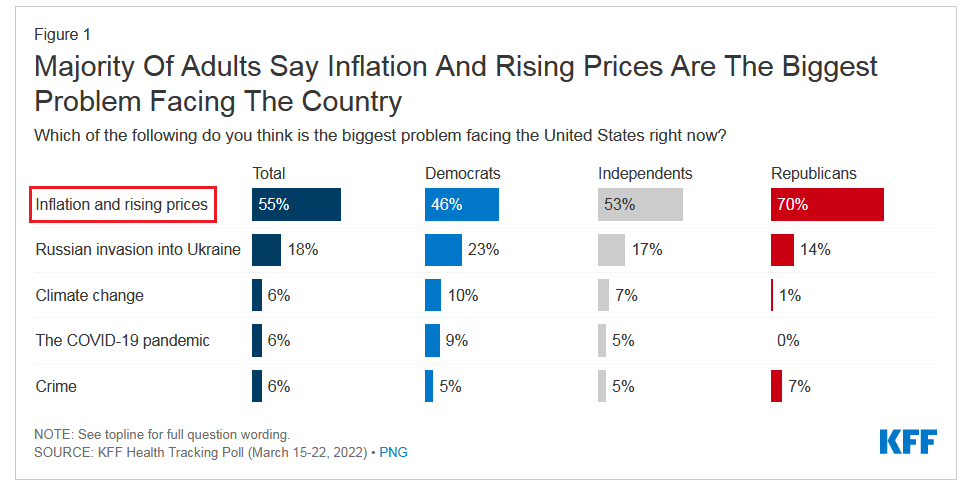
To explain, the Kaiser Family Foundation’s (KFF) poll released on Mar. 31 stated that “more than half of the public (55%) say inflation and rising prices is the biggest problem facing the U.S. right now, more than three times the share who say the same about any other issue included in the survey.”
As a result, the Fed has the political authority to reduce inflation by any means necessary. If history is any indication, the power struggle should light plenty of fireworks over the medium term. To explain, I wrote on Mar. 23:
When Fed officials dial up the hawkish rhetoric, their “messaging” is supposed to shift investors’ expectations. As such, the threat of raising interest rates is often as impactful as actually doing it. However, when investors don’t listen, the Fed has to turn the hawkish dial up even more. If history is any indication, a calamity will eventually unfold.
Please see below:
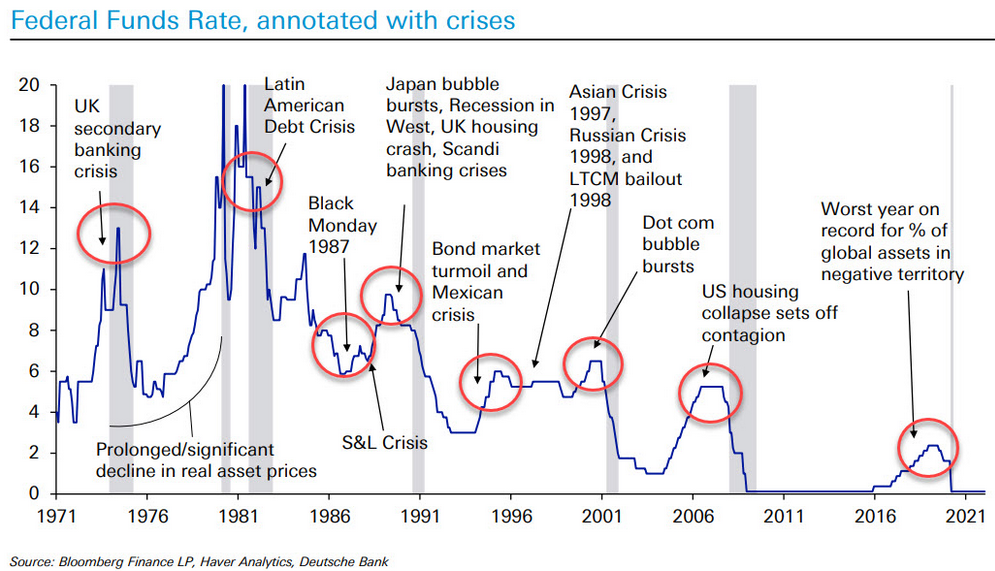
To explain, the blue line above tracks the U.S. federal funds rate, while the various circles and notations above track the global crises that erupted during the Fed’s rate hike cycles. As a result, standard tightening periods often result in immense volatility.
However, with investors refusing to let asset prices fall, they’re forcing the Fed to accelerate its rate hikes to achieve its desired outcome (calm inflation). As such, the next several months could be a rate hike cycle on steroids.
In addition, while I noted that we’re likely in the early innings of this thesis, a slow shift is already unfolding. Moreover, once the PMs realize that they are as vulnerable as the S&P 500, investors’ sentiment should follow.
Please see below:
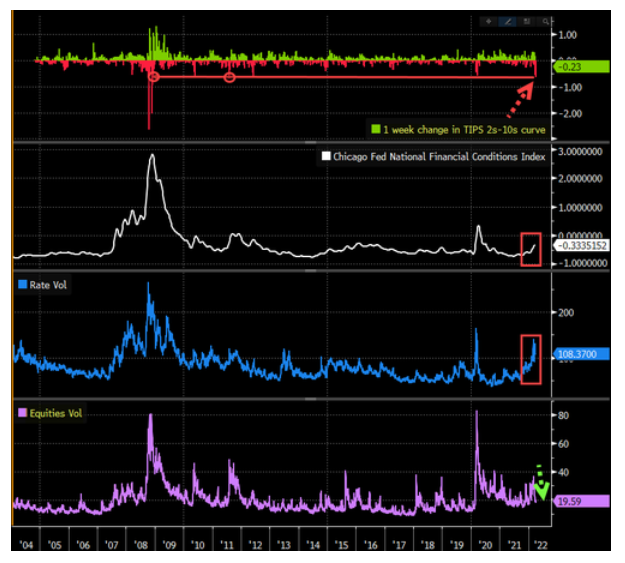 Source: Bloomberg/Zero Hedge
To explain, the four charts above depict various shifts in financial conditions. Whether its inflation expectation spreads, the Chicago Fed’s National Financial Conditions Index, or bond market volatility, the Fed’s message is slowly seeping in. However, with equity volatility (the purple line) quite muted relative to bond volatility (the blue line), the former should crack as the Fed continues its hawkish stampede.
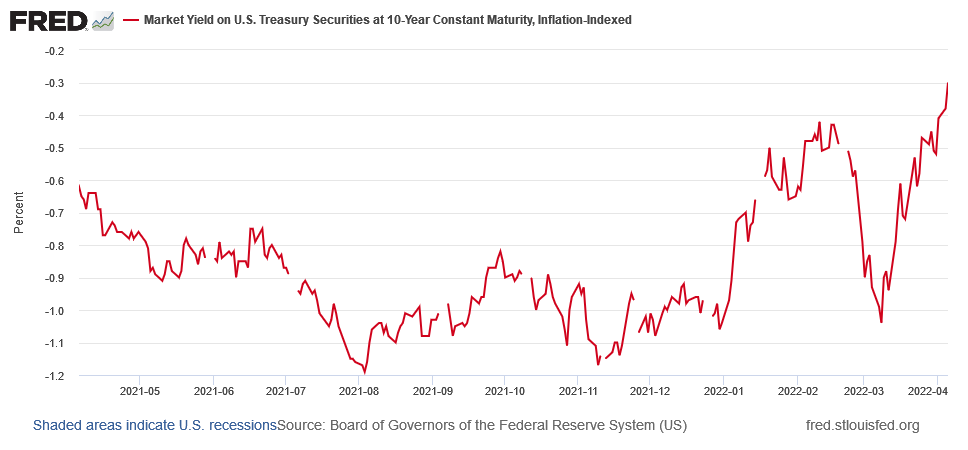
Finally, please note that the PMs often move inversely to U.S. real yields, and with the U.S. 10-Year real yield hitting another 2022 high of -0.30%, the Fed’s “rapid” liquidity drain should lift the metric toward 0% over the medium term.
The bottom line? While the Fed’s hawkish disposition aligns perfectly with my expectations, investors’ denial of the fundamental ramifications has delayed the PMs’ likely drawdowns. However, as the financial market impact of the Russia-Ukraine conflict subsides and the Fed’s rate hike cycle takes its toll on the U.S. economy, commodities’ fervor should dissipate. Moreover, the fundamental constraints confronting the PMs now are even worse than they were at the end of 2021.
In conclusion, the PMs declined on Apr. 6, as a sea of red flooded Wall Street. However, with rising real yields and a stronger USD Index akin to fundamental Kryptonite, gold, silver, and mining stocks face many economic headwinds. As such, while the short term remains uncertain, the bearish medium-term thesis is becoming clearer by the day.
Thank you for reading our free analysis today. Please note that the above is just a small fraction of the full analyses that our subscribers enjoy on a regular basis. They include multiple premium details such as the interim targets for gold and mining stocks that could be reached in the next few weeks. We invite you to subscribe now and read today’s issue right away.
Sincerely,
Przemyslaw Radomski, CFA
Founder, Editor-in-chief


Gold Investment News
Delivered To Your Inbox
Free Of Charge
Bonus: A week of free access to Gold & Silver StockPickers.
Gold Alerts
More-
Status
New 2024 Lows in Miners, New Highs in The USD Index
January 17, 2024, 12:19 PM -
Status
Soaring USD is SO Unsurprising – And SO Full of Implications
January 16, 2024, 8:40 AM -
Status
Rare Opportunity in Rare Earth Minerals?
January 15, 2024, 2:06 PM

