

Briefly: in our opinion, full (300% of the regular position size) speculative short positions in junior mining stocks are justified from the risk/reward point of view at the moment of publishing this Alert.
Gold, silver, and mining stocks declined yesterday, as the USD Index moved to its new 2022 highs. That’s in tune with what I’ve been writing previously, but let’s keep in mind that this is just the beginning of what’s likely ahead – a big medium-term decline in precious metals, in particular in silver and mining stocks. In addition, junior miners are still likely to decline the most. Having said that, let’s start today’s analysis with a look at the fundamental news.
While the PMs and the S&P 500 have been in la la land in recent weeks, I warned on Apr. 5 that investors were ignoring the Fed at their own peril. I wrote:
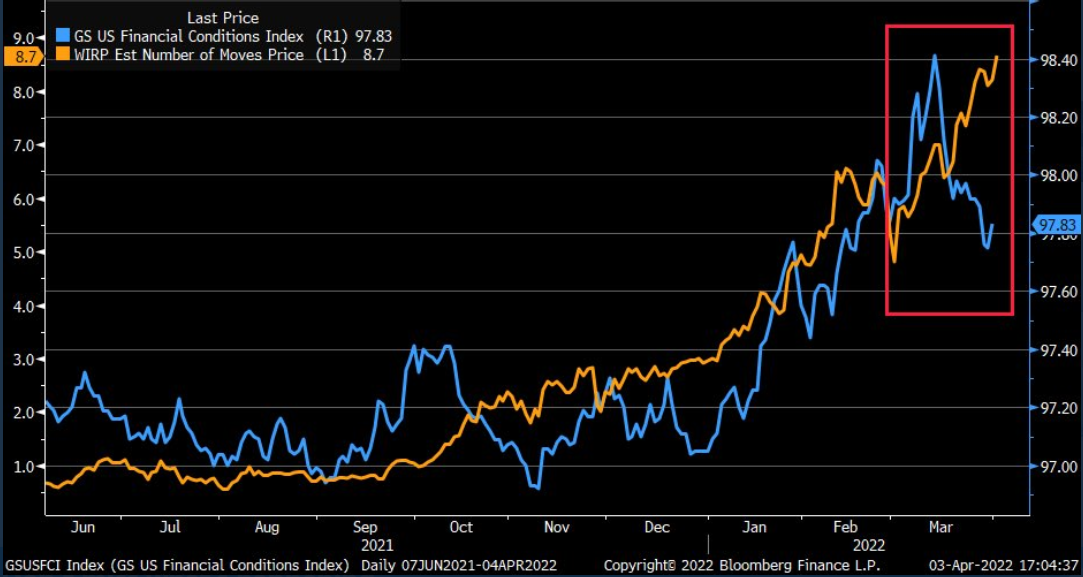
To explain, the orange line above tracks the number of rate hikes priced in by the futures market, while the blue line above tracks Goldman Sachs’ Financial Conditions Index (FCI). If you analyze the movement of the former, futures traders expect roughly nine rate hikes by the Fed in 2022.
However, if you focus your attention on the right side of the chart, you can see that the FCI has declined materially from its highs. Therefore, financial conditions are easier now than they were before the March FOMC meeting. However, the Fed needs to tighten financial conditions to calm inflation, but since market participants are not listening, Chairman Jerome Powell needs to amplify his hawkish rhetoric until the message hits home.
Think of it like this: when a person gains 10 pounds, losing the weight is a manageable task. However, when a person gains 100 pounds, returning to the prior baseline is much more difficult. As such, the Fed finds itself in category #2. With the U.S. labor market on fire and inflation following its lead, normalizing these metrics without hurting U.S. economic growth is like trying to lose 100 pounds while maintaining the same diet. Thus, tough times likely lie ahead as the Fed’s rate hike cycle accelerates over the medium term.
To that point, while it only took one day for the Fed to raise the hawkish bar, the financial markets suffered another dose of reality on Apr. 5.
For example, Fed Governor Lael Brainard said on Apr. 5: "I think we can all absolutely agree inflation is too high and bringing inflation down is of paramount importance."
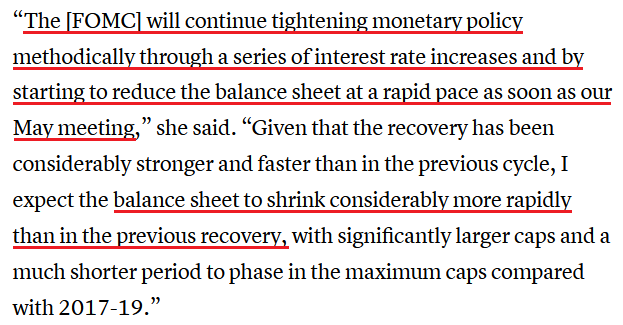
Moreover, she added that selling assets on the Fed's balance sheet "will contribute to monetary policy tightening over and above the expected increases in the policy rate reflected in market pricing and the Committee's Summary of Economic Projections."
As a result, with words like "rapid" entering the equation, her rhetoric mirrored Powell’s use of "expeditiously."
Please see below:
 Source: CNBC
Thus, while I’ve been warning for some time that investors are misreading the tea leaves, please remember that the Fed needs to slow the U.S. economy to calm inflation, and rising asset prices are mutually exclusive to this goal. Therefore, officials should keep hammering the financial markets until investors finally get the message.
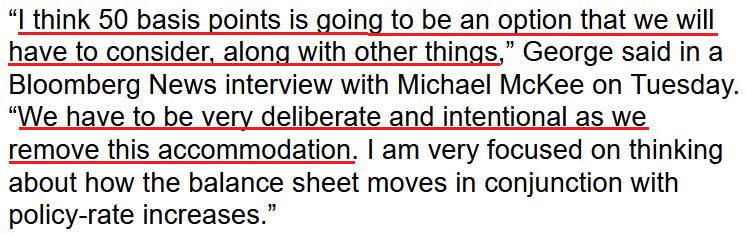
As further evidence, Kansas City Fed President Esther George said on Apr. 5: “I think if you just look at where we are today, you might say we will have to go above neutral to bring inflation down.” For context, she also added that “there is a long time between now and the end of the year to see how the economy unfolds.”
However, the end result remains the same:
 Source: Bloomberg
Again, notice how she said “along with other things.” Thus, the Fed’s united message is clear. With more than 10 officials warning that significant tightening is needed to reduce inflation, investors are the only ones who haven’t gotten the memo.
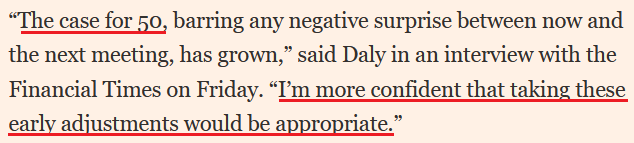
Furthermore, San Francisco Fed President Mary Daly told the Financial Times on Apr. 3: “If you want a job in the United States, you can get one and you can probably get multiple jobs at this point. If you’re an employer looking for workers, it’s hard to both hire them and retain them.”
As a result, a 50 basis point rate hike in May looks more and more like a done deal.
Please see below:
 Source: the Financial Times
Echoing that message, Daly told the Native American Finance Officers Association on Apr. 5 that their “goal is to make sure that people don’t stay up worrying about whether their dollar today will be the same and worth a dollar tomorrow (…).”
“Most Americans, most people, most businesses, hopefully people in tribal nations, you all have confidence that we’re not going to let this go forever. But if you don’t have that confidence, let me give it to you.”
As a result, Fed officials are screaming from the rooftops that taming inflation is priority number 1, not the performance of the S&P 500 or the PMs. While investors think they can have their cake and eat it too, I warned on Mar. 28 that harsh realities would likely emerge over the medium term. I wrote:
When the Fed tightens monetary policy, it's actively trying to slow down the U.S. economy. As a result, the tradeoff to calming inflation is less consumption, lower growth and pressure on asset prices. However, while investors think the Fed will pull a rabbit out of its hat and materially slow inflation without hurting the U.S. economy, the prospect is unrealistic.
Now, while Fed officials try and put on brave faces, they’re already admitting as much.
Please see below:
 Source: CNBC
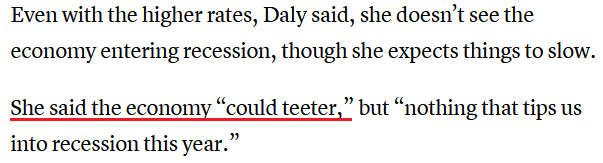
Thus, does a U.S. economy that “could teeter” sound bullish for the S&P 500 or the PMs? Moreover, while her relatively optimistic assessment assumes that a recession is unlikely, the data suggests otherwise. With annualized inflation at ~8% and the latest PMI and rental market data signaling even more price increases in March, plenty of demand destruction needs to unfold to reduce inflation to normalized levels.
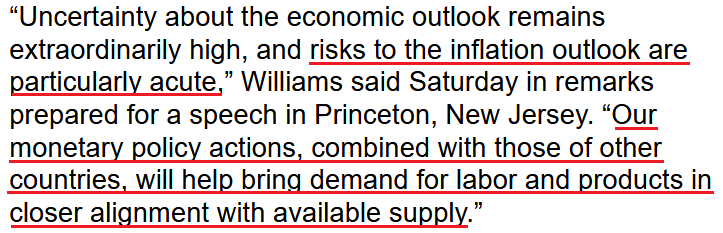
Moreover, even New York Fed President John Williams (a major dove) used pragmatic language on Apr. 2 to describe what lies ahead:
 Source: Bloomberg
Likewise, while he painted a rosy portrait of the effects of tighter monetary policy, Williams' point of bringing "demand for labor and products in closer alignment with available supply" really means: “we're going to increase unemployment, reduce wages, and kill demand until inflation calms down.”
That Didn’t Take Long
Remember, resilient consumer spending led to rapid increases in output prices. Since retailers know that consumers are feverishly spending, they eagerly accept higher input prices. As a result, the feedback loop of input-output inflation has reigned for months on end.
However, to reverse the spiral, the Fed needs to reduce consumer demand to the point where retailers are not experiencing robust sales. Only then will they need fewer inputs, which will lead to lower input prices and reverse the input-output feedback loop.
Moreover, this environment is bearish for the S&P 500 and the PMs. Less consumption and demand lead to lower corporate profits. In addition, while commodities remain in investors' good graces, a material slowdown in the U.S. economy (and a likely recession) is not bullish for commodity prices. As a result, the Fed's battle with inflation should profoundly impact several asset classes over the next few months.
Speaking of which, the U.S. housing market is extremely vulnerable. For context, I wrote on Mar. 31:
With the Fed caught between a rock and a hard place, how do officials reduce inflation without cracking the housing market?
Please see below:
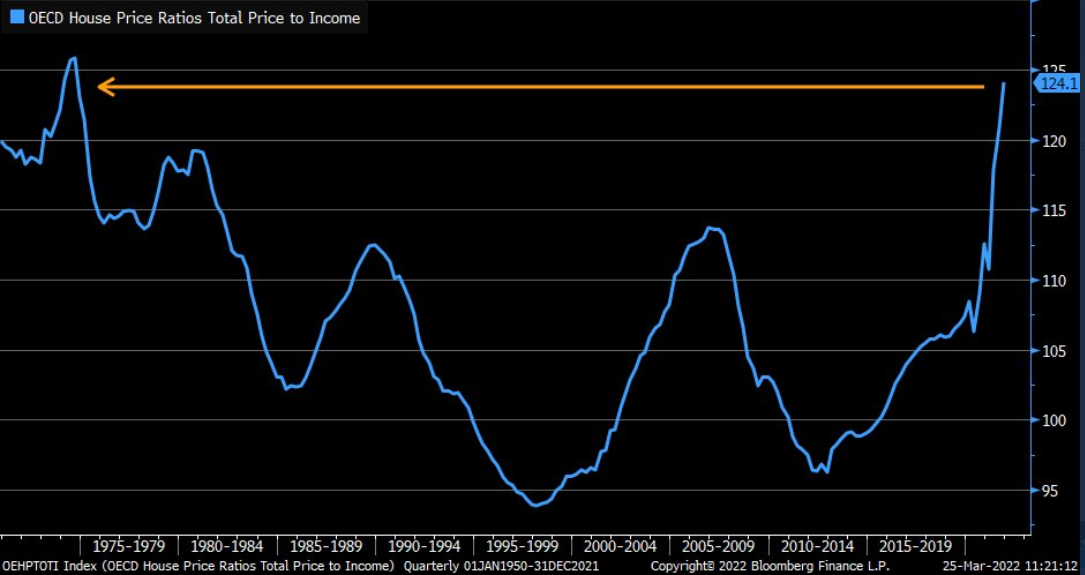
If you analyze the right side of the chart, you can see that homeowners’ price-to-income ratio is near the highs set in the 1970s. For context, this is a global metric and is not confined to the U.S. However, with consumers having less income to service their mortgage debt than in any period since the 1970s, does it seem like this will end well?
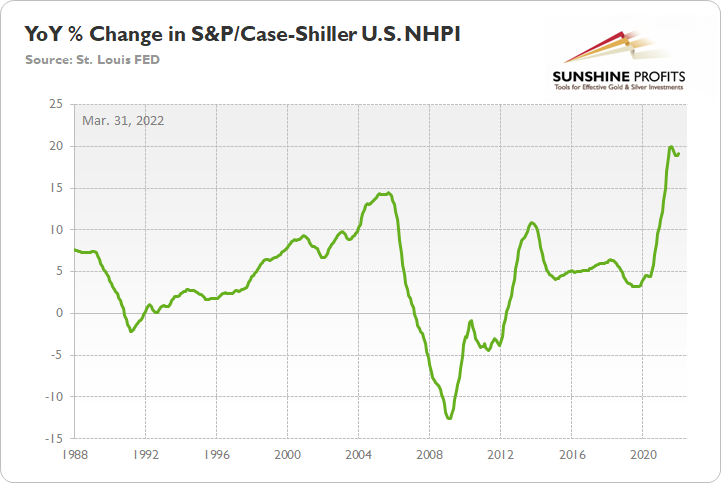
To that point, the S&P/Case-Shiller U.S. National Home Price Index (NHPI) increased by 19.2% year-over-year (YoY) on Mar. 29. For context, the consensus estimate was 18.4%. As a result, housing prices remain red hot at a time when the Fed needs to drop the hawkish hammer.
Please see below:
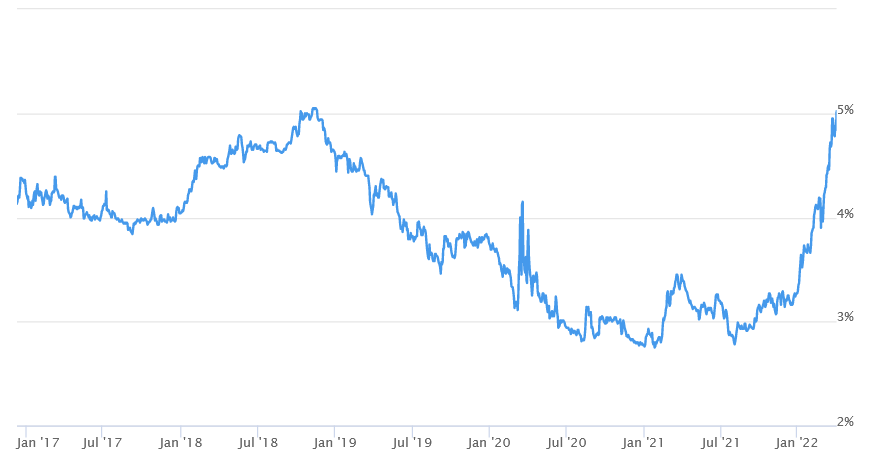
Adding to the ills, Mortgage News Daily revealed that the average 30-year fixed mortgage rate eclipsed 5% on Apr. 5. Therefore, it’s likely only a matter of time before the rate surpasses its 2018 high. In addition, if you analyze the right side of the chart below, you can see that the rate has surged over the last three months.
Please see below:
 Source: Mortgage News Daily
Finally, Fed officials’ hawkish rhetoric also lit a fire under U.S. Treasury yields. For example, the U.S. 10-Year Treasury yield closed at a new 2022 high of ~2.55% on Apr. 5.
Please see below:
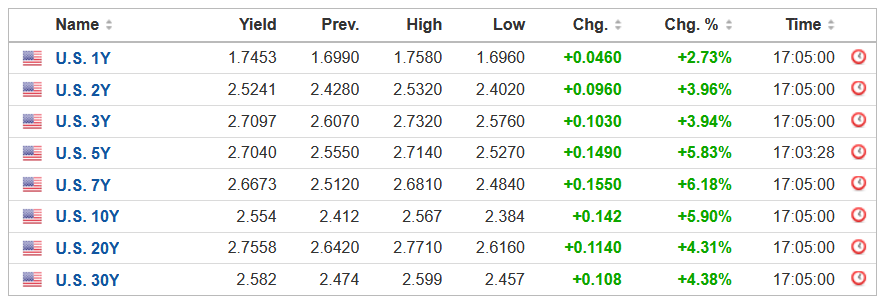 Source: Investing.com
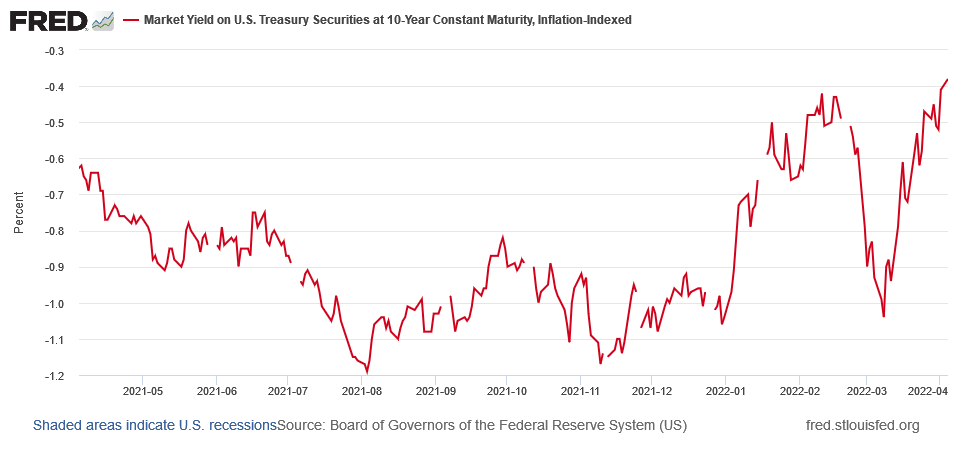
Furthermore, the U.S. 10-Year real yield also hit a new 2022 high of -0.38%.
In addition, J.P. Morgan told clients on Apr. 5: "our rates strategists raised their 2-year nominal yield forecast by 55bp to 2.90% by year-end and revised their 10-year target 35bp higher to 2.85% by the end of 2022. Hence, their forecasts imply a yield curve remaining inverted later this year."
The bottom line? I wrote on Apr. 5 that while market participants have embraced the idea that seven to 12 rate hikes don’t matter, their misguided optimism should come under severe pressure over the medium term. Moreover, I added that the medium term looks even more bearish than it did at the end of 2021. As such, all of that still stands.
While the Russia-Ukraine conflict has uplifted the PMs, their domestic medium-term fundamentals have deteriorated profoundly in 2022. Moreover, with the Fed in inflation-fighting mode and reformed doves warning that the U.S. economy “could teeter” as the drama unfolds, the reality is that there is no easy solution to the Fed’s problem. To calm inflation, it has to kill demand. As that occurs, investors should suffer a severe crisis of confidence.
In conclusion, the PMs declined on Apr. 5, as Fed officials hammered home their message once again. However, it’s likely a long way down before the medium-term implications are truly priced in. As such, while it may take more than words to shatter investors’ confidence, the Fed’s battle with inflation is a lose-lose situation for the U.S. economy.
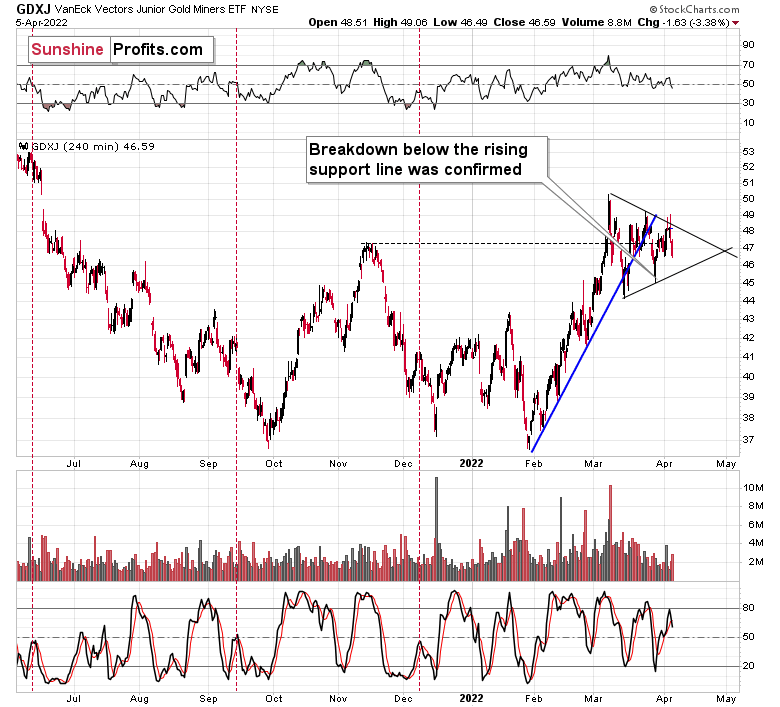
On the technical front, we saw that the junior mining stocks – once again – moved higher in the first part of the session. Unlike Monday’s session, yesterday’s one was followed by a move well below the opening price. Ultimately, junior miners ended the day more than 3% lower.
In yesterday’s analysis, I wrote that junior miners were likely to decline, and they did.
However, why did junior miners rally initially? Perhaps for technical reasons. They were moving higher in their immediate-term trend, and thus, it might have been necessary for them to reach a resistance level before they could return to their downtrend. That’s likely the same reason why they rallied early in the day on Monday, but it seems that Monday’s session wasn’t convincing enough and the bulls wanted to give the breakout another shot. It failed too.
Junior miners just found the resistance in the form of the declining line based on the previous March highs. After a tiny attempt to break above this line, the GDXJ declined and the breakout was invalidated, suggesting that the rally is over.
Now, the above-mentioned resistance line appears to be the upper border of the triangle pattern, which might concern you because triangles are usually a “continuation pattern”. In other words, the move that preceded the triangle is usually the type of move that follows it. The preceding move higher was up, so the following move could be to the upside as well.
However, for this to happen, junior miners would first need to confirm the breakout above the line, and we saw the opposite taking place yesterday – the breakout above the line was invalidated. Twice.
If – instead – we see a decline below the lower border of the triangle, the pattern would likely be followed by a decline. Please note that I wrote “usually” and now “always” with regard to the bullish implications of triangles.
If we look beyond the above chart, the bearish case is more justified than the bullish one.
I don’t mean just the extremely bearish situation in gold’s long-term chart, where it’s clear that gold is repeating its 2011-2013 performance, with the recent top being analogous to what we saw in 2012.
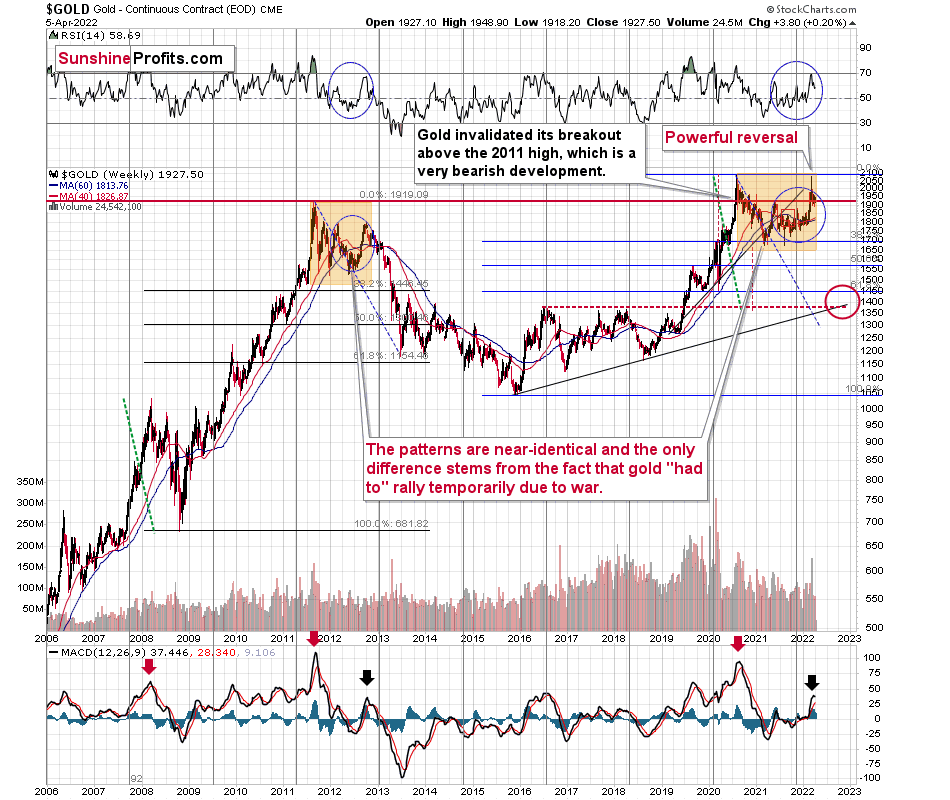
If it wasn’t for the Ukraine-war-tension-based rally, gold would have likely topped close to its current levels, which would be a perfect analogy to where it topped in 2012 – close to its preceding medium-term highs.
The fact that the RSI indicator moved lower recently after being close to 70 indicates that the top is already behind us.
If history is about to rhyme (and that’s very probable in my view), gold is likely to decline in a back-and-forth manner before it truly slides without looking back. Basically, that’s what we’ve been seeing recently. The recent consolidation is not a bullish development, but something in perfect tune with the extremely bearish pattern from 2012.
I don’t mean “just” the above, because we see similar analogies in silver and gold stocks (the HUI Index), and we get other indications (of more short-term nature) from the USD Index and the general stock market.
Before we get to them, let’s check gold’s short-term chart.
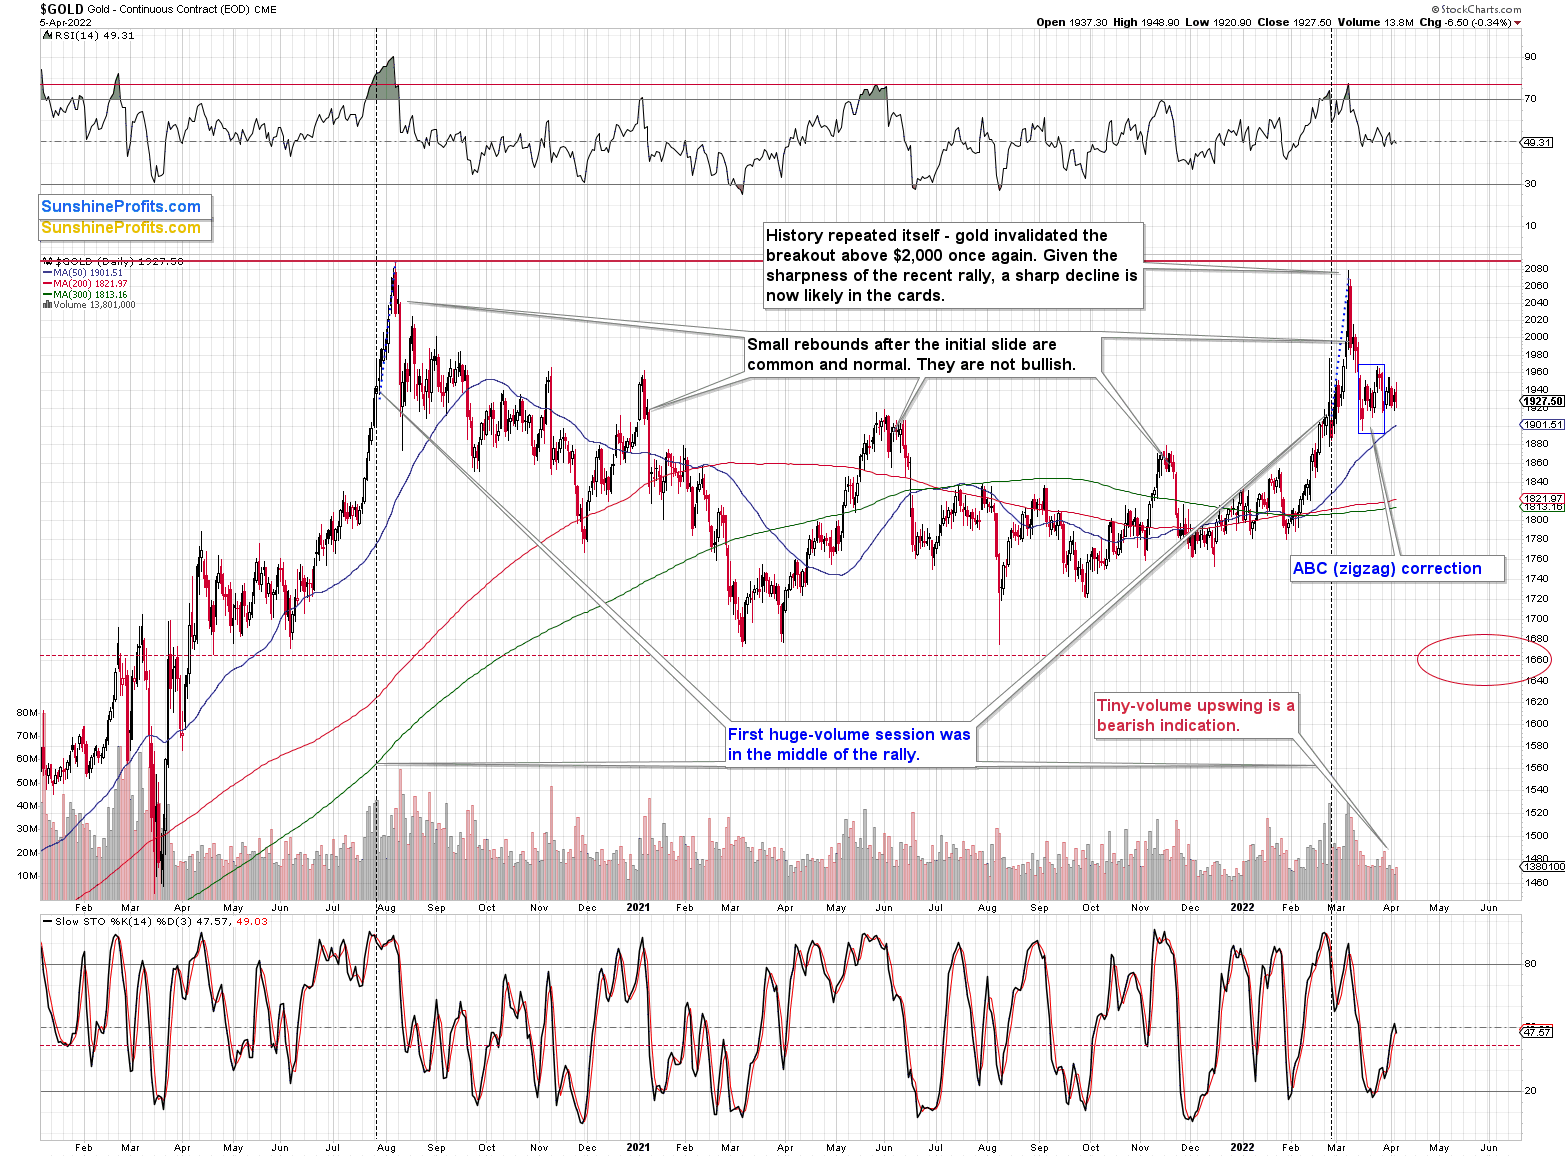
In short, it’s consolidating, which is in perfect tune with what we saw after the previous (unsuccessful) attempt to break above $2,000 – in 2020. Back then, the volatility was bigger, but the pre-top rally itself was also much higher. Overall, it seems that both situations are analogous.
With the USD Index breaking to new highs, it seems that gold is ready to fall lower once again. Speaking of the U.S. currency, let’s take a look at its chart.
In my previous analyses, I commented on the USD Index in the following way:
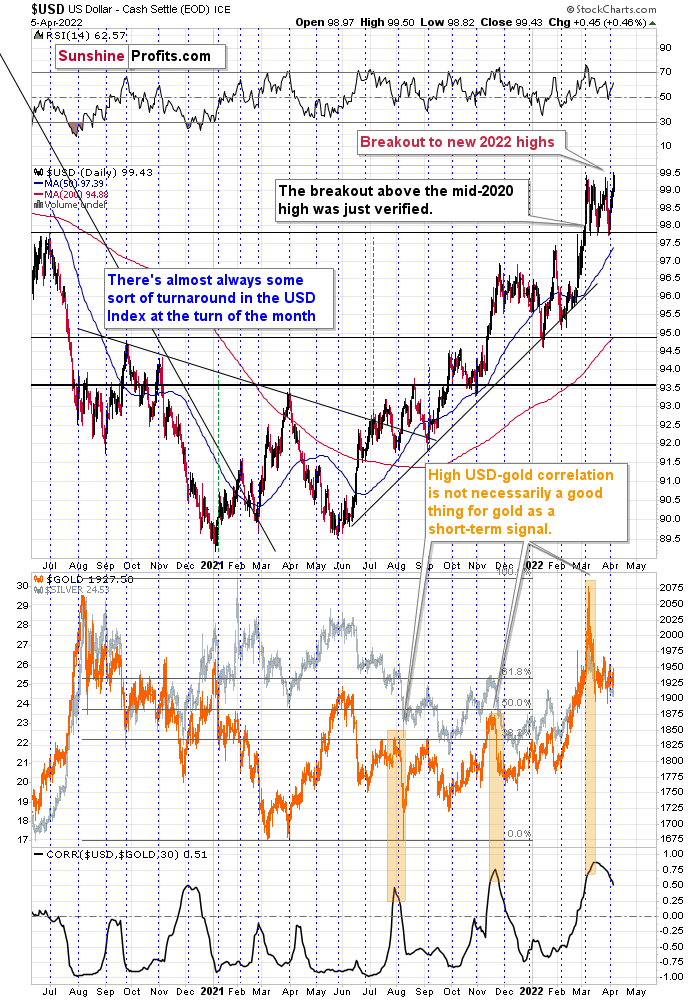
If we focus on the USD Index alone, we’ll see that yesterday’s decline was absolutely inconsequential with regard to changing the outlook for the USDX. It simply continues to consolidate after a breakout above the mid-2020 highs. Breakout + consolidation = increasing chances of rallies’ continuation. A big wave up in the USD Index is likely just around the corner, and the precious metal sector is likely to decline when it materializes.
As the war-based premiums in gold and the USD appear to be waning, a high-interest-rate-driven rally in the USD is likely to trigger declines in gold. The correlation between these two assets has started to decline. When that happened during the last two cases (marked with orange), gold plummeted profoundly shortly thereafter.
The USD Index rallied recently, once again clearly verifying the breakout above its mid-2020 high. This means that the USD Index is now likely ready to rally once again. Naturally, this has bearish implications for the precious metals sector.
Indeed – the USD Index has rallied, and it just moved to its new 2022 highs. What’s not visible on the above chart is that the rally continued in today’s pre-market movement. At the moment of writing these words, the USD Index futures are trading at about 99.7. Once the USD Index moves above 100, it will likely get media’s attention, which means that many more people will realize what’s going on.
What’s going on is that the USDX has been on the rise since early 2021 – when everyone (well, not you, if you’ve been following my analyses at that time) thought that the USD Index was about to collapse.
This renewed bullish sentiment is likely to keep precious metals prices in check and perhaps trigger another big wave down.
Meanwhile, the technical picture of the S&P 500 index continues to suggest that the final top and the initial corrective upswing are over.
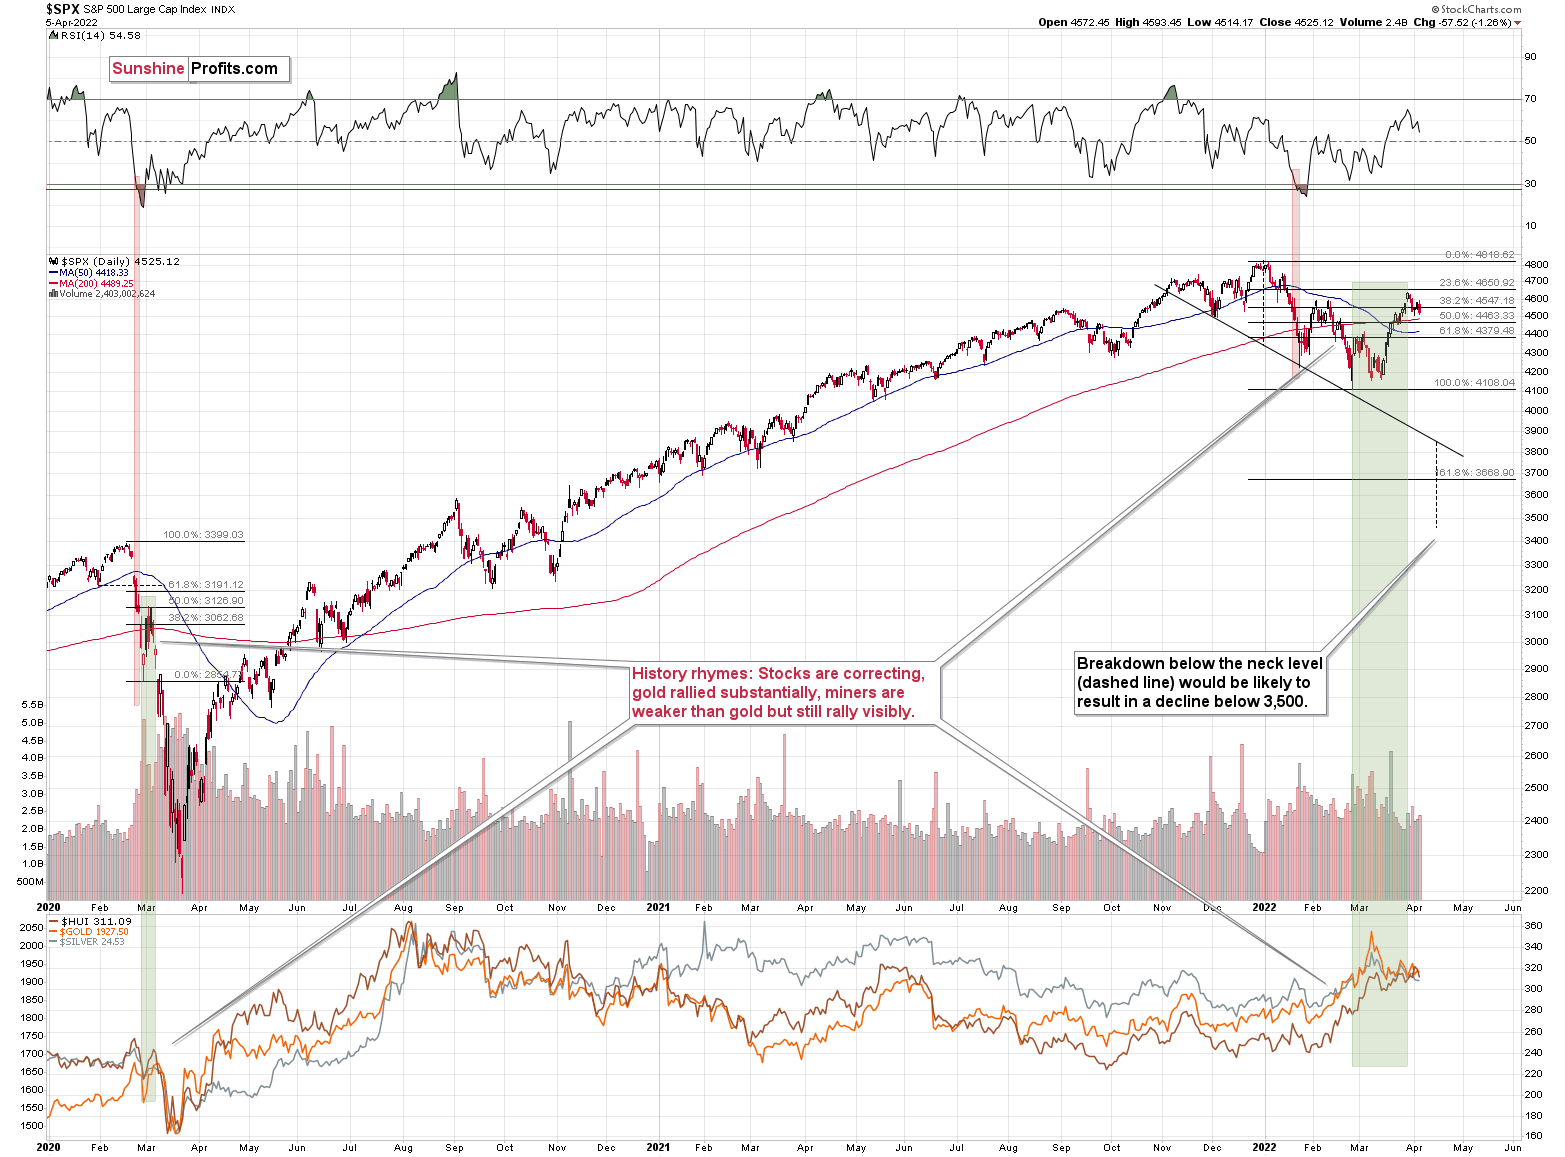
The general stock market closed the previous week below its February highs, which means that the small breakout above them was invalidated.
It also closed yesterday’s session lower, indicating that another short-term rally is about to take place.
This is a very bearish indication for the following weeks. Many more investors are likely to become aware of the new interest-rate-hike-driven medium-term bear market once the S&P 500 breaks to its new 2022 lows. That’s when the decline is supposed to accelerate, quite likely also in silver and mining stocks that are usually most vulnerable to stock market moves.
All in all, technicals favor a decline in the precious metals sector sooner rather than later.
Overview of the Upcoming Part of the Decline
- It seems to me that the corrective upswing is now over or very close to being over , and that gold, silver, and mining stocks are now likely to continue their medium-term decline.
- It seems that the first (bigger) stop for gold will be close to its previous 2021 lows, slightly below $1,800 . Then it will likely correct a bit, but it’s unclear if I want to exit or reverse the current short position based on that – it depends on the number and the nature of the bullish indications that we get at that time.
- After the above-mentioned correction, we’re likely to see a powerful slide, perhaps close to the 2020 low ($1,450 - $1,500).
- If we see a situation where miners slide in a meaningful and volatile way while silver doesn’t (it just declines moderately), I plan to – once again – switch from short positions in miners to short positions in silver. At this time, it’s too early to say at what price levels this could take place, and if we get this kind of opportunity at all – perhaps with gold close to $1,600.
- I plan to exit all remaining short positions once gold shows substantial strength relative to the USD Index while the latter is still rallying. This may be the case with gold close to $1,350 - $1,400. I expect silver to fall the hardest in the final part of the move. This moment (when gold performs very strongly against the rallying USD and miners are strong relative to gold after its substantial decline) is likely to be the best entry point for long-term investments, in my view. This can also happen with gold close to $1,375, but at the moment it’s too early to say with certainty.
- As a confirmation for the above, I will use the (upcoming or perhaps we have already seen it?) top in the general stock market as the starting point for the three-month countdown. The reason is that after the 1929 top, gold miners declined for about three months after the general stock market started to slide. We also saw some confirmations of this theory based on the analogy to 2008. All in all, the precious metals sector is likely to bottom about three months after the general stock market tops.
- The above is based on the information available today, and it might change in the following days/weeks.
You will find my general overview of the outlook for gold on the chart below:
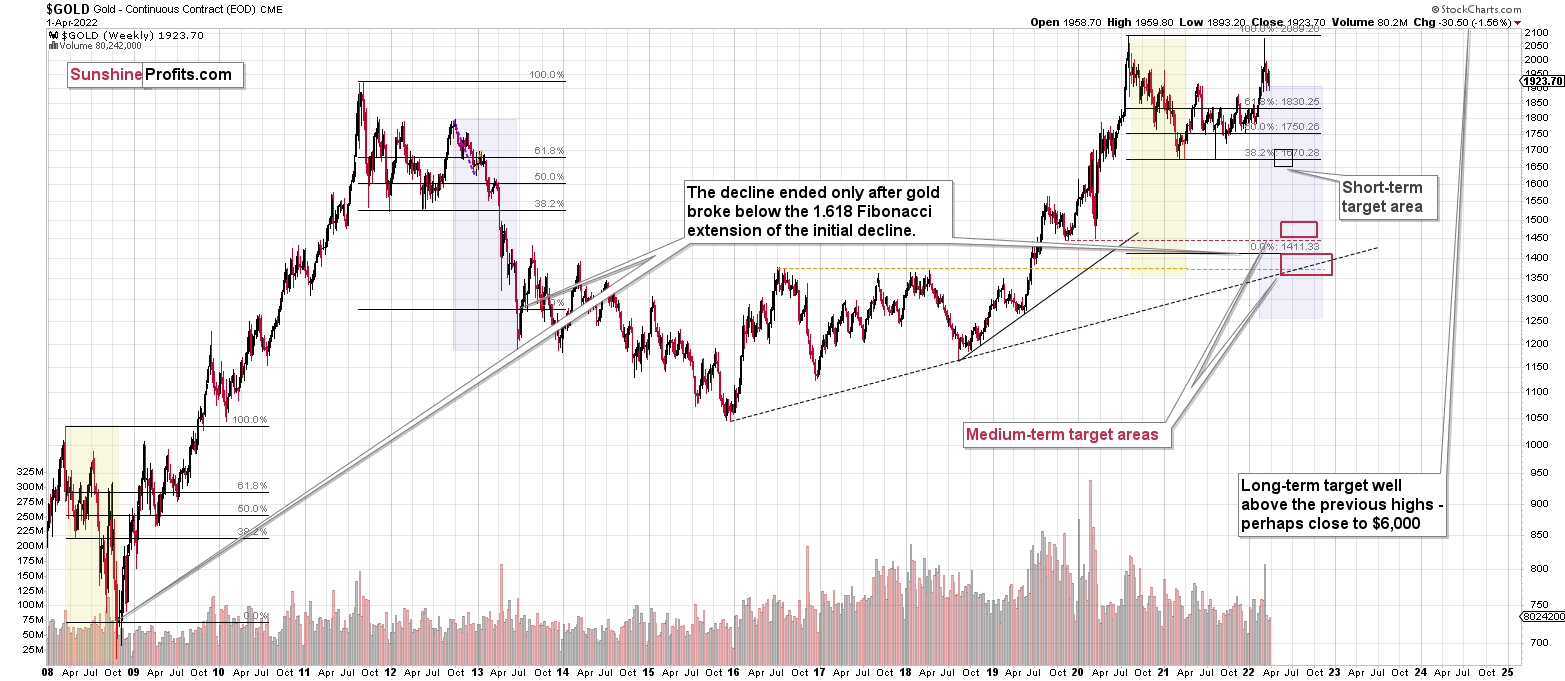
Please note that the above timing details are relatively broad and “for general overview only” – so that you know more or less what I think and how volatile I think the moves are likely to be – on an approximate basis. These time targets are not binding or clear enough for me to think that they should be used for purchasing options, warrants or similar instruments.
Summary
Summing up, despite the recent rally in gold, the outlook for junior mining stocks remains exactly as I described previously.
Crude oil’s extreme outperformance, the stock market’s weakness, and critical medium-term resistance levels reached by gold (all-time high!) and junior mining stocks – all indicate that the tops are at hand or have just formed.
Investing and trading are difficult. If it was easy, most people would be making money – and they’re not. Right now, it’s most difficult to ignore the urge to “run for cover” if you physically don’t have to. The markets move on “buy the rumor and sell the fact.” This repeats over and over again in many (all?) markets, and we have direct analogies to similar situations in gold itself. Junior miners are likely to decline the most, also based on the massive declines that are likely to take place (in fact, they have already started) in the stock markets.
From the medium-term point of view, the two key long-term factors remain the analogy to 2013 in gold and the broad head and shoulders pattern in the HUI Index. They both suggest much lower prices ahead.
It seems that our profits from short positions are going to become truly epic in the coming months.
After the sell-off (that takes gold to about $1,350-$1,500), I expect the precious metals to rally significantly. The final part of the decline might take as little as 1-5 weeks, so it's important to stay alert to any changes.
As always, we'll keep you - our subscribers - informed.
To summarize:
Trading capital (supplementary part of the portfolio; our opinion): Full speculative short positions (300% of the full position) in junior mining stocks are justified from the risk to reward point of view with the following binding exit profit-take price levels:
Mining stocks (price levels for the GDXJ ETF): binding profit-take exit price: $34.63; stop-loss: none (the volatility is too big to justify a stop-loss order in case of this particular trade)
Alternatively, if one seeks leverage, we’re providing the binding profit-take levels for the JDST (2x leveraged) and GDXD (3x leveraged – which is not suggested for most traders/investors due to the significant leverage). The binding profit-take level for the JDST: $14.98; stop-loss for the JDST: none (the volatility is too big to justify a SL order in case of this particular trade); binding profit-take level for the GDXD: $25.48; stop-loss for the GDXD: none (the volatility is too big to justify a SL order in case of this particular trade).
For-your-information targets (our opinion; we continue to think that mining stocks are the preferred way of taking advantage of the upcoming price move, but if for whatever reason one wants / has to use silver or gold for this trade, we are providing the details anyway.):
Silver futures downside profit-take exit price: $19.12
SLV profit-take exit price: $17.72
ZSL profit-take exit price: $38.28
Gold futures downside profit-take exit price: $1,683
HGD.TO – alternative (Canadian) inverse 2x leveraged gold stocks ETF – the upside profit-take exit price: $11.79
HZD.TO – alternative (Canadian) inverse 2x leveraged silver ETF – the upside profit-take exit price: $29.48
Long-term capital (core part of the portfolio; our opinion): No positions (in other words: cash
Insurance capital (core part of the portfolio; our opinion): Full position
Whether you already subscribed or not, we encourage you to find out how to make the most of our alerts and read our replies to the most common alert-and-gold-trading-related-questions.
Please note that we describe the situation for the day that the alert is posted in the trading section. In other words, if we are writing about a speculative position, it means that it is up-to-date on the day it was posted. We are also featuring the initial target prices to decide whether keeping a position on a given day is in tune with your approach (some moves are too small for medium-term traders, and some might appear too big for day-traders).
Additionally, you might want to read why our stop-loss orders are usually relatively far from the current price.
Please note that a full position doesn't mean using all of the capital for a given trade. You will find details on our thoughts on gold portfolio structuring in the Key Insights section on our website.
As a reminder - "initial target price" means exactly that - an "initial" one. It's not a price level at which we suggest closing positions. If this becomes the case (like it did in the previous trade), we will refer to these levels as levels of exit orders (exactly as we've done previously). Stop-loss levels, however, are naturally not "initial", but something that, in our opinion, might be entered as an order.
Since it is impossible to synchronize target prices and stop-loss levels for all the ETFs and ETNs with the main markets that we provide these levels for (gold, silver and mining stocks - the GDX ETF), the stop-loss levels and target prices for other ETNs and ETF (among other: UGL, GLL, AGQ, ZSL, NUGT, DUST, JNUG, JDST) are provided as supplementary, and not as "final". This means that if a stop-loss or a target level is reached for any of the "additional instruments" (GLL for instance), but not for the "main instrument" (gold in this case), we will view positions in both gold and GLL as still open and the stop-loss for GLL would have to be moved lower. On the other hand, if gold moves to a stop-loss level but GLL doesn't, then we will view both positions (in gold and GLL) as closed. In other words, since it's not possible to be 100% certain that each related instrument moves to a given level when the underlying instrument does, we can't provide levels that would be binding. The levels that we do provide are our best estimate of the levels that will correspond to the levels in the underlying assets, but it will be the underlying assets that one will need to focus on regarding the signs pointing to closing a given position or keeping it open. We might adjust the levels in the "additional instruments" without adjusting the levels in the "main instruments", which will simply mean that we have improved our estimation of these levels, not that we changed our outlook on the markets. We are already working on a tool that would update these levels daily for the most popular ETFs, ETNs and individual mining stocks.
Our preferred ways to invest in and to trade gold along with the reasoning can be found in the how to buy gold section. Furthermore, our preferred ETFs and ETNs can be found in our Gold & Silver ETF Ranking.
As a reminder, Gold & Silver Trading Alerts are posted before or on each trading day (we usually post them before the opening bell, but we don't promise doing that each day). If there's anything urgent, we will send you an additional small alert before posting the main one.
Thank you.
Przemyslaw Radomski, CFA
Founder, Editor-in-chief

