

Briefly: in our opinion, full (300% of the regular position size) speculative short positions in junior mining stocks are justified from the risk/reward point of view at the moment of publishing this Alert.
Friday’s price action in the precious metals sector was mixed, with gold and silver moving down, and miners moving up. However, before digging into charts, let’s take a look at the markets from a more fundamental point of view.
Fueling the Fed
While the PMs and the general stock market assume that rising interest rates won’t cause any significant bouts of volatility, history suggests otherwise. With good data likely to elicit bad outcomes for both parties, the hotter the U.S. economy gets, the more cold water the Fed has to pour on the financial markets.
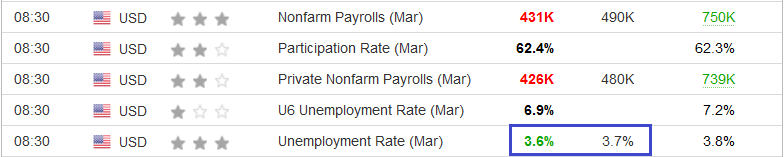
To that point, U.S. nonfarm payrolls came in at 431,000 versus 490,000 expected on Apr. 1. However, despite the slight miss, the U.S. unemployment rate fell to 3.6% and outperformed expectations.
Please see below:
 Source: Investing.com
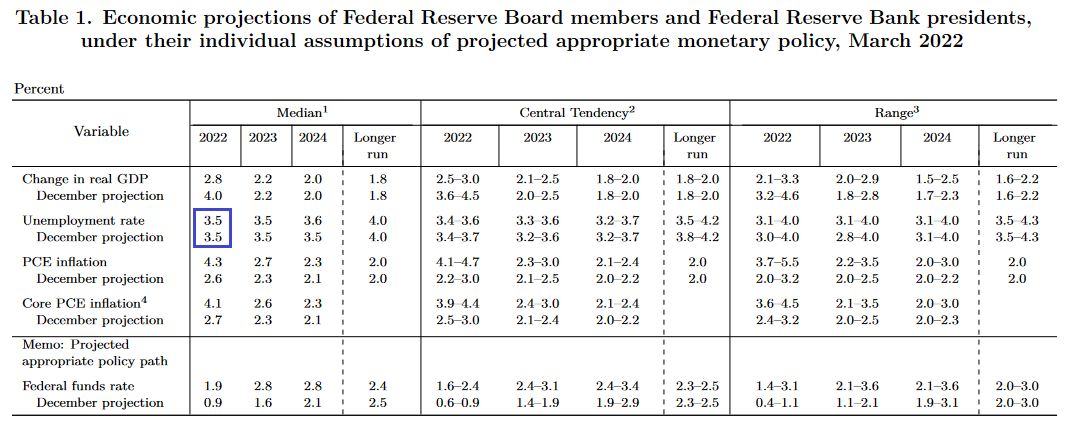
Furthermore, the FOMC’s latest Summary of Economic Projections (SEP) shows that Fed officials expect the U.S. unemployment rate to reach 3.5% by the end of 2022. However, with the metric likely to outperform sooner than expected, a realization will add more fuel to the hawkish fire.
Please see below:
 Source: U.S. Fed
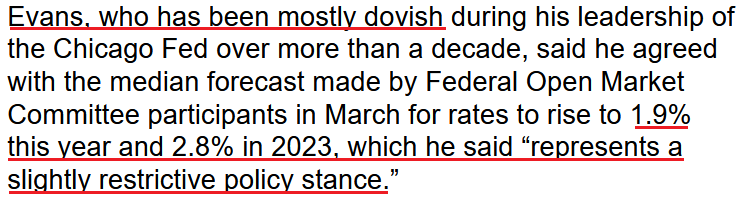
In addition, while the number of Fed officials calling for seven rate hikes or more in 2022 has reached double digits, Chicago Fed President Charles Evans joined the fray on Apr. 1. He said:
“If monetary policy did not respond to these broader inflation pressures, we would see the expectation of continued high inflation become embedded in economic decisions, and we would have even harder work to do to rein it in. So monetary policy must shift to removing accommodation in a timely fashion, which is what you’ve seen in the latest actions by and communications from the FOMC.”
Moreover, while Evans supports the median projection and expects seven rate hikes in 2022, his expectations of a 1.9% and 2.8% U.S. federal funds rate in 2022 and 2023 are profoundly hawkish.
Please see below:
 Source: Bloomberg
For context, please remember that Fed officials’ September projections showed roughly one rate hike in 2022. As a result, while investors remain sanguine for the time being, does it seem likely that the Fed will hike interest rates several times without any volatility? Moreover, if history is any indication, once the data starts to roll over, the narrative will shift from ‘all is well’ to ‘uh oh.’
In the meantime, though, the U.S. economy remains resilient, and with employment and inflation headlining the Fed’s dual mandate, there more they outperform, the more confidence the Fed will have to raise interest rates.
To that point, the Institute for Supply Management (ISM) released its U.S. Manufacturing PMI on Apr. 1. While the headline index decreased from 58.6 in February to 57.1 in March, Timothy R. Fiore, Chair of the ISM Manufacturing Business Survey Committee, said:
"The U.S. manufacturing sector remains in a demand-driven, supply chain-constrained environment. In March, progress was made to solve the labor shortage problems at all tiers of the supply chain, which will result in improved factory throughput and supplier deliveries. Panelists reported lower rates of quits and early retirements compared to previous months, as well as improving internal and supplier labor positions.”
As a result, the “ISM’s Employment Index registered 56.3 percent in March, 3.4 percentage points above the February reading of 52.9 percent.”
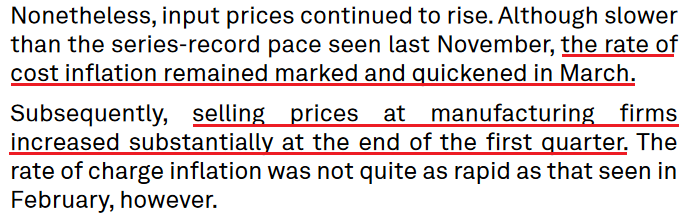
More importantly, though, inflation surged in March. The report revealed:
“The ISM Prices Index registered 87.1 percent, up 11.5 percentage points compared to the February reading of 75.6 percent, indicating raw materials prices increased for the 22nd consecutive month, at a notably faster rate in March. This is the biggest month-over-month increase since a 12.2-percentage point gain (to 77.6 percent) in December 2020.”
Thus, with the ISM’s data supporting the Fed’s hawkish disposition, inflation continues to run away from the central bank. As further evidence, S&P Global also released its U.S. Manufacturing PMI on Apr. 1. Here, the headline index increased from 57.3 in February to 58.8 in March. The report revealed:
“The pace of growth continued to gain momentum and was the quickest since last August. Crucial to the increase were reports of improved availability of raw materials and inputs as supply chain disruption eased slightly. Companies also noted that higher output was supported by stronger client demand and a rise in new orders. (…) Foreign client demand also strengthened, with new export orders rising at the joint-fastest pace for almost a year.”
In addition:
“Encouraged by stronger demand conditions, firms stepped up their hiring activity, with some also noting a greater ability to find suitable candidates.”
On top of that:
 Source: S&P Global
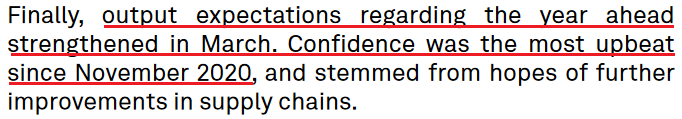
Likewise, if the Fed needed any more fuel to light the hawkish fire, business confidence improved in March and highlights how the inflationary spiral will continue until the Fed curbs demand.
Please see below:
 Source: S&P Global
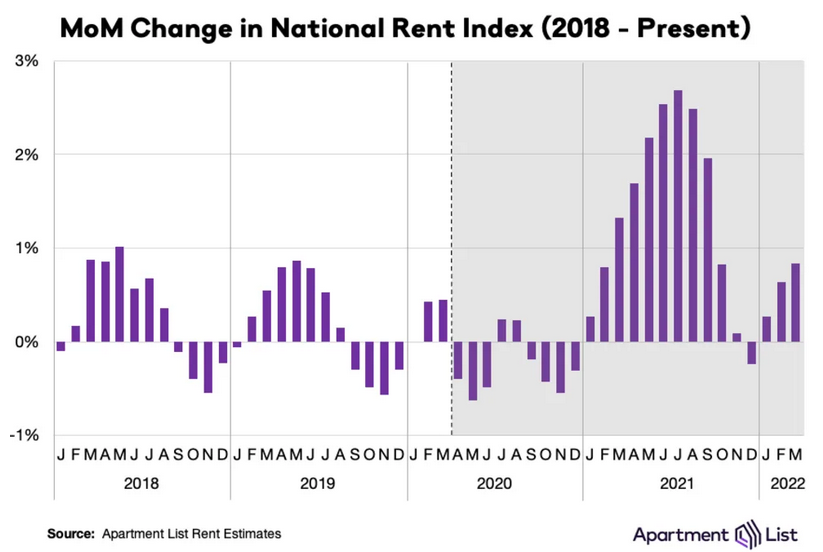
Adding to the Fed's ills, Apartment List released its National Rent Report on Mar. 28. For context, Shelter accounts for more than 30% of the headline Consumer Price Index's (CPI) movement. As a result, lodging is an important variable when analyzing the path of inflation, and therefore, future Fed policy.
The report revealed:
“Rent growth is continuing to pick up steam again, after a brief winter cooldown, with our national index up by 0.8 percent over the course of March.”
“This is a bit slower than the 1.3 percent increase that we saw last March, when the 2021 rent growth boom was just starting to pick up steam. It’s also well below the 2.3 percent average monthly rent growth that we saw from last April through September.
But even if growth has cooled down substantially from last summer’s peak, it is also pacing well ahead of the pre-pandemic norm for this time of year. In the first three months of 2022, rents nationally have increased by a total of 1.8 percent, which is twice as fast as the growth that we saw over the same period in 2018 (0.9 percent) and 2019 (0.8 percent).”
Please see below:
In addition, the report stated:
“In December 2021, rents fell in 61 of the nation’s 100 largest cities, the only month last year in which more than half of these cities saw a decline. This month, however, rents were up in 93 of the nation’s 100 largest cities.”
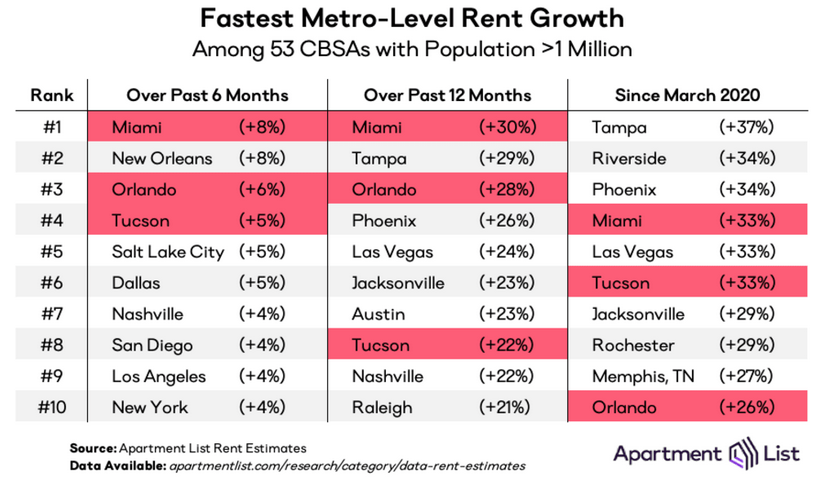
On top of that, when analyzing rent inflation across the fastest growing regions, the year-over-year (YoY) percentage changes (the second column below) are quite extreme.
Please see below:
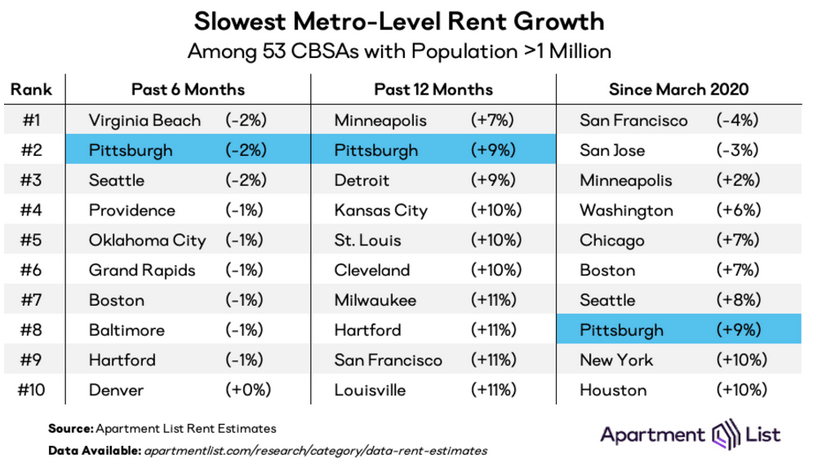
Furthermore, the Shelter CPI increased by 4.8% YoY on Mar. 10, while the owners’ equivalent rent metric increased by 4.3% YoY. However, Apartment List’s data shows that even the slowest growing regions (the second column below) have outpaced the U.S. government’s data over the last 12 months. As a result, with rents still rising MoM and government data still lagging, the Shelter CPI should have plenty of upside over the medium term.
Please see below:
Finally, I’ve highlighted how wage inflation has exploded in recent months, and with companies like Dave & Buster’s and Chewy citing labor cost increases of 20% and 17%, respectively, how can the Fed curb inflation with job openings near their all-time high and wage inflation still abundant?
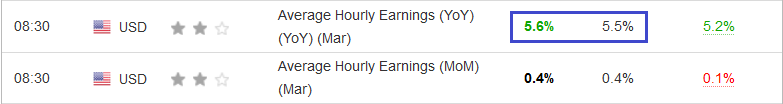
Well, it’s important to note that average hourly earnings increased by 5.6% YoY on Apr. 1. Moreover, the metric outperformed the 5.5% YoY estimate and surpassed the 5.2% YoY figure from February.
Please see below:
 Source: Investing.com
Also noteworthy, Walgreens Boots Alliance released its second-quarter earnings on Mar. 31. President John Standley said:
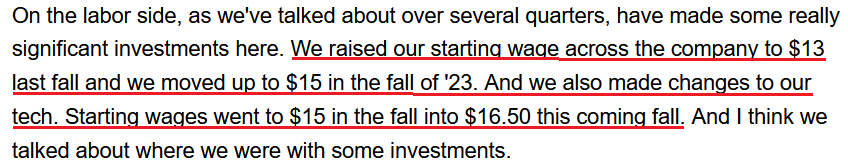 Source: Walgreens Boots Alliance/Seeking Alpha
As a result, if companies continue to increase their wages to attract employees, the inflationary spiral will never end. That’s precisely why environments like these are bullish for the U.S. federal funds rate.
Please see below:
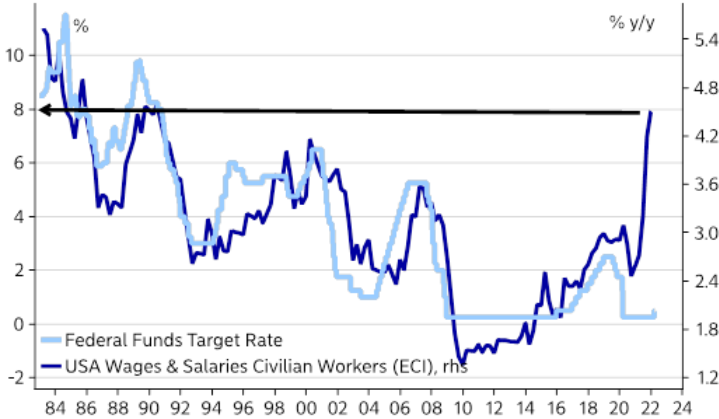 Source: Nordea
To explain, the dark blue line above tracks the YoY percentage change in the U.S. Employment Cost Index (ECI), while the light blue line above tracks the U.S. federal funds rate. As you can see, the pair have a tight historical relationship.
Moreover, with the gap on the right side of the chart unlike anything seen in the last ~40 years, the U.S. federal funds rate has plenty of room to run, and such a realization is profoundly bearish for silver and gold prices.
The bottom line? The hotter the data, the more hawkish the Fed. With inflation and employment continuing to sizzle, the Fed needs to cool the economy to avoid even bigger problems down the road. Moreover, with more than 10 Fed officials calling for at least seven rate hikes in 2022, it's naive to assume that bouts of panic won't erupt along the way. As such, history shows that liquidity drains are bearish for the PMs, and the likely pace of this one aligns with some of the most hawkish on record.
In conclusion, the PMs were mixed on Apr. 1, as momentum helped drive mining stocks higher. However, with their medium-term technicals and fundamentals continuing to decelerate, the next few months should elicit sharp reversals. Moreover, while investors act as if the end of QE and seven to 12 rate hikes are no big deal, the confidence game will likely unravel as the real drama unfolds.
Moving to the technical side of things, we saw very little change in gold and silver.
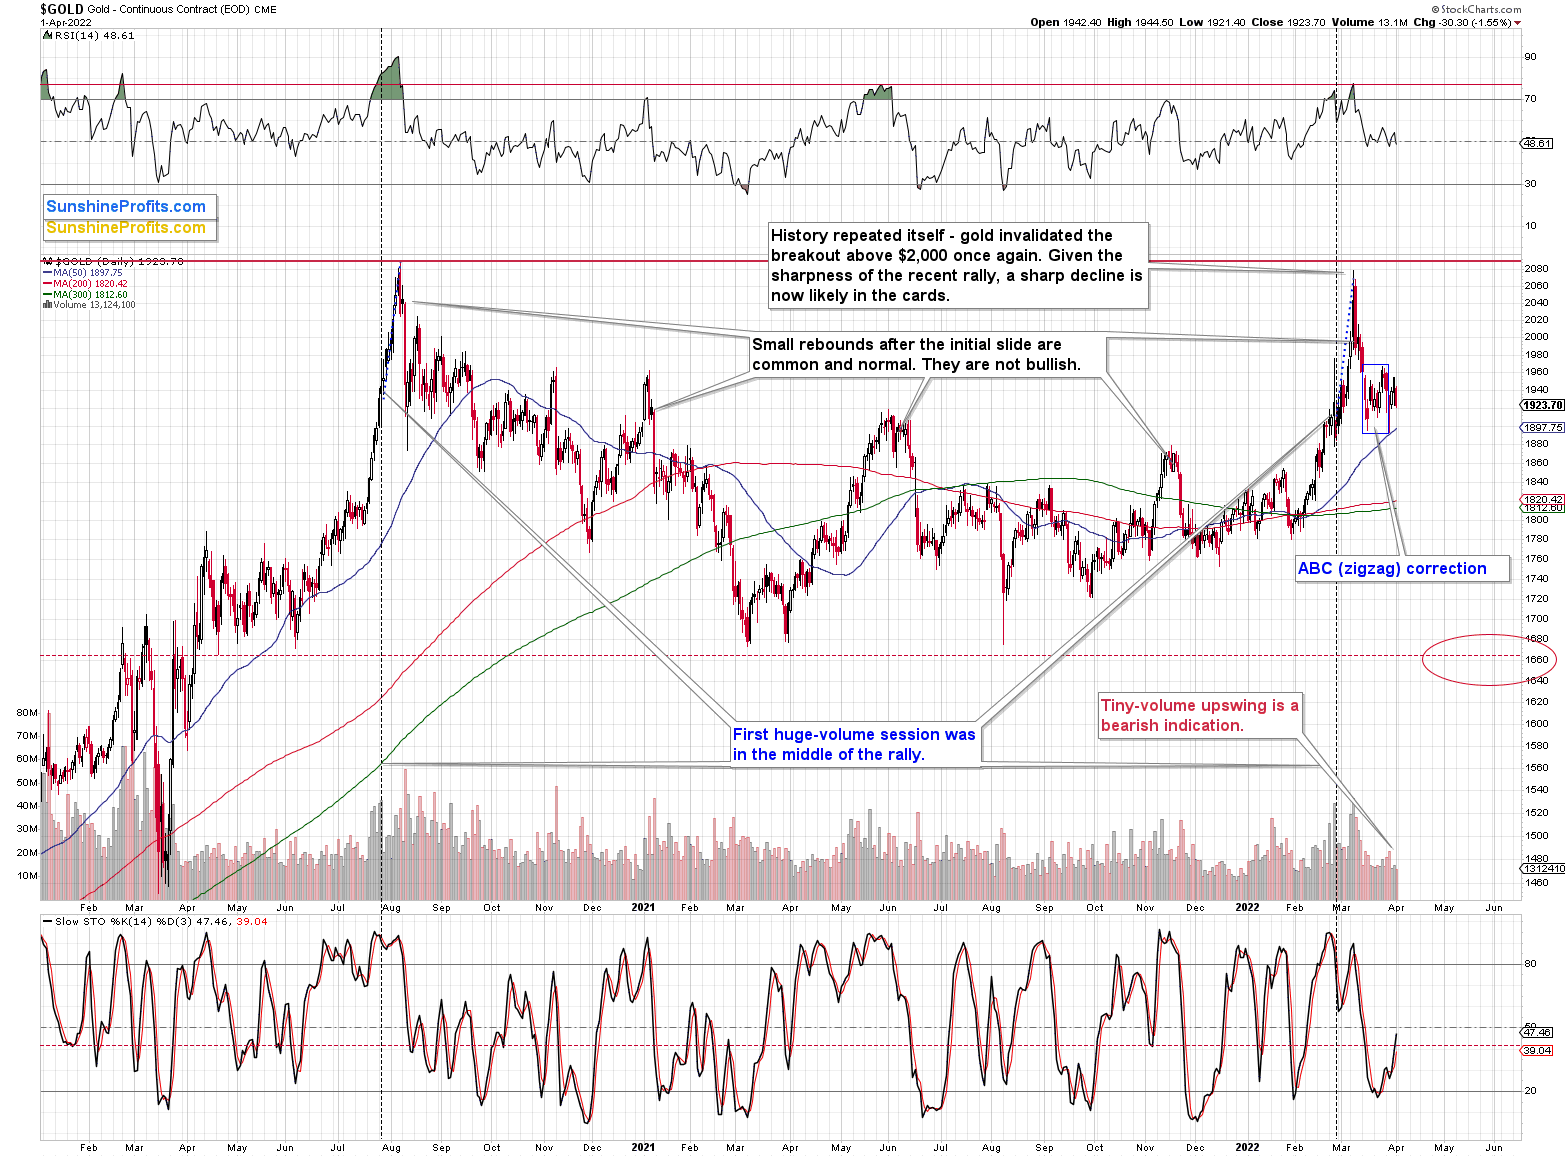
Gold moved lower, but it didn’t clearly invalidate the breakout above the mid-201 highs, so the action was neither particularly bearish or bullish from the short-term point of view.
From the medium-term point of view, the fact that gold failed to rally above its previous high earlier this year despite war in Europe is a sign of its weakness and it’s bearish for the following weeks and months.
In other words, my previous comments on the above gold chart remain up-to-date:
The gold price moved higher, but the daily rally took place on tiny volume, suggesting that it’s just another counter-trend move – a breather. This is in perfect tune with what happened after the August 2020 slide. This time, the consolidation is not as volatile, but its existence is completely normal.
This – along with yesterday’s underperformance of mining stocks – is an indication that the big decline is about to continue.
After the correction, gold is likely to decline once again, just as it did back then, only this time, the decline is likely to be more profound.
Silver declined just as gold did.
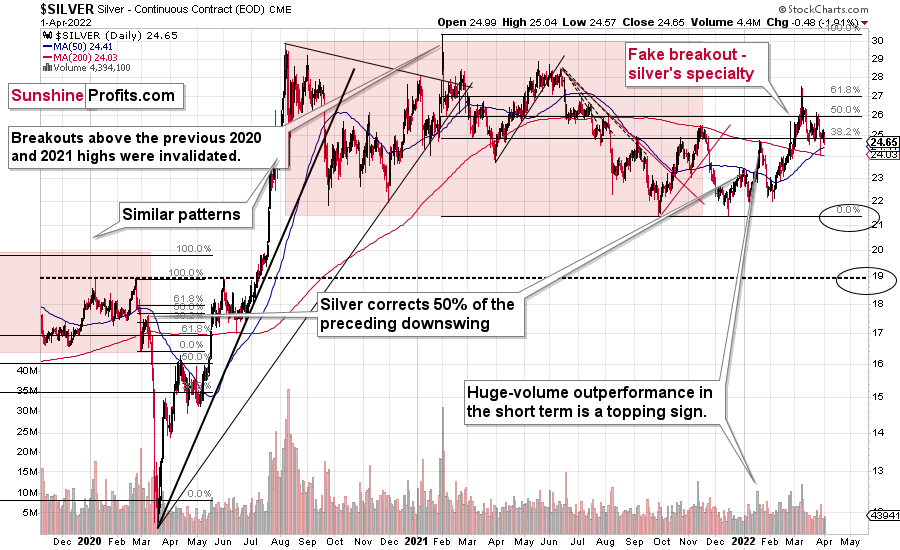
Interestingly, the white metal closed the week not only below its late-2021 high, but also above its January 2022 high.
The war-tensions-based rally appears to be over, as the maximum fear is already behind us. The war continues, but the uncertainty surrounding it is decreasing. This can also be seen through the number of searches for “Ukraine war” in Google (chart courtesy of Google Trends).
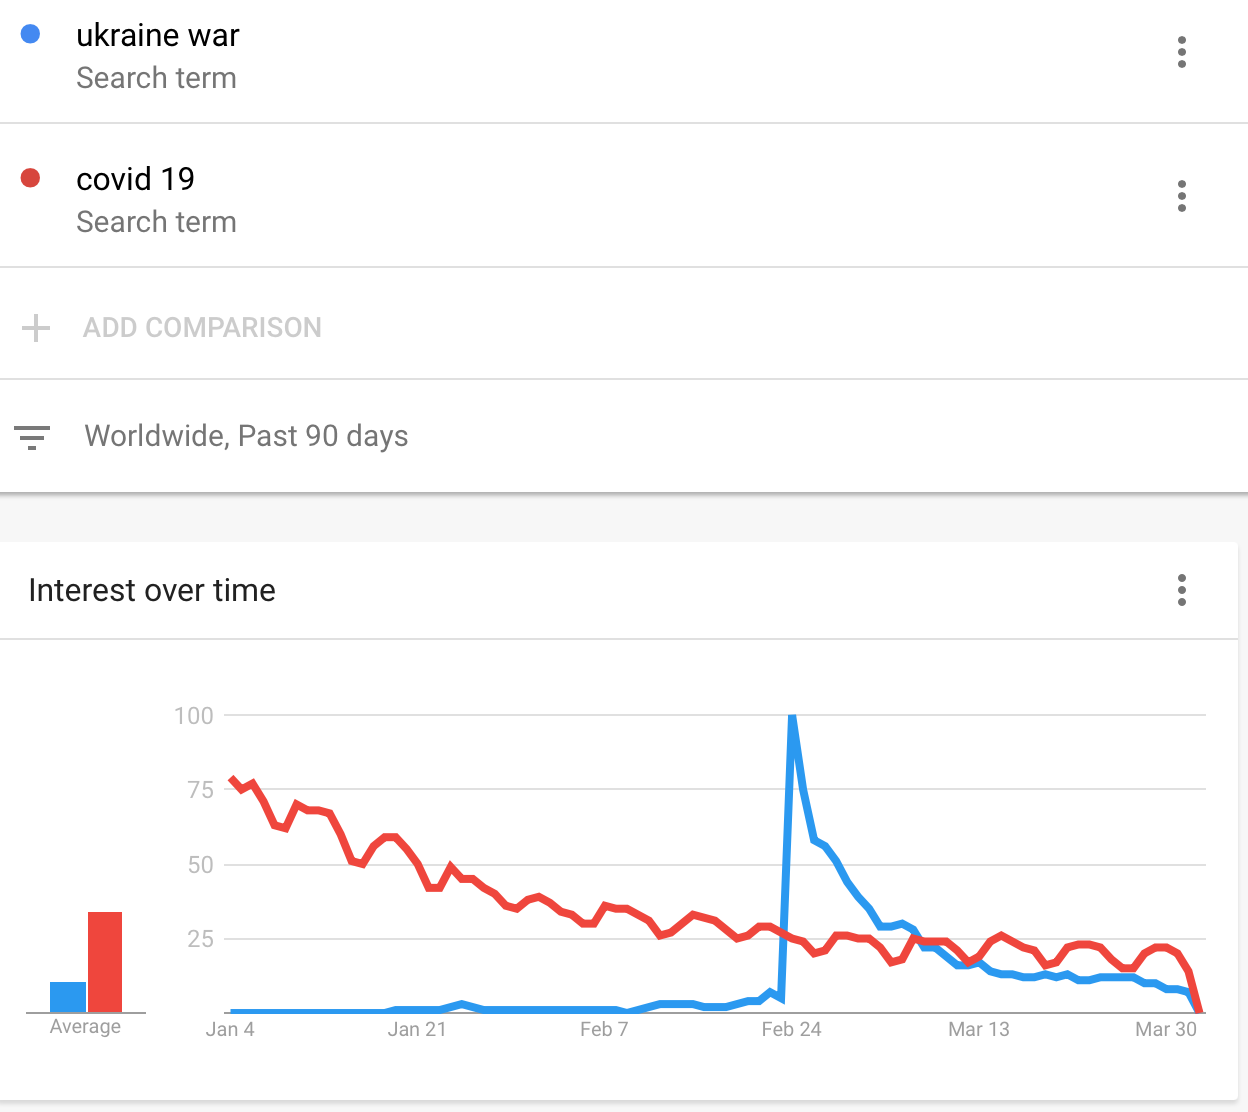
I also added the number of searches for “Covid 19”, which is also declining.
As fear-based premia decline, it seems that gold and silver prices will soon follow. In fact, they are probably already after the top.
The thing that the markets are likely to become more and more interested in are the interest rate hikes, as that’s what will hit the overly-indebted companies and individuals the most. It appears that it’s still not clear to most market participants that the interest rate hikes are likely to take place and that they are likely to push prices lower in the near and medium term.
The technical picture of the S&P 500 index suggests that the final top and the initial corrective upswing are over.
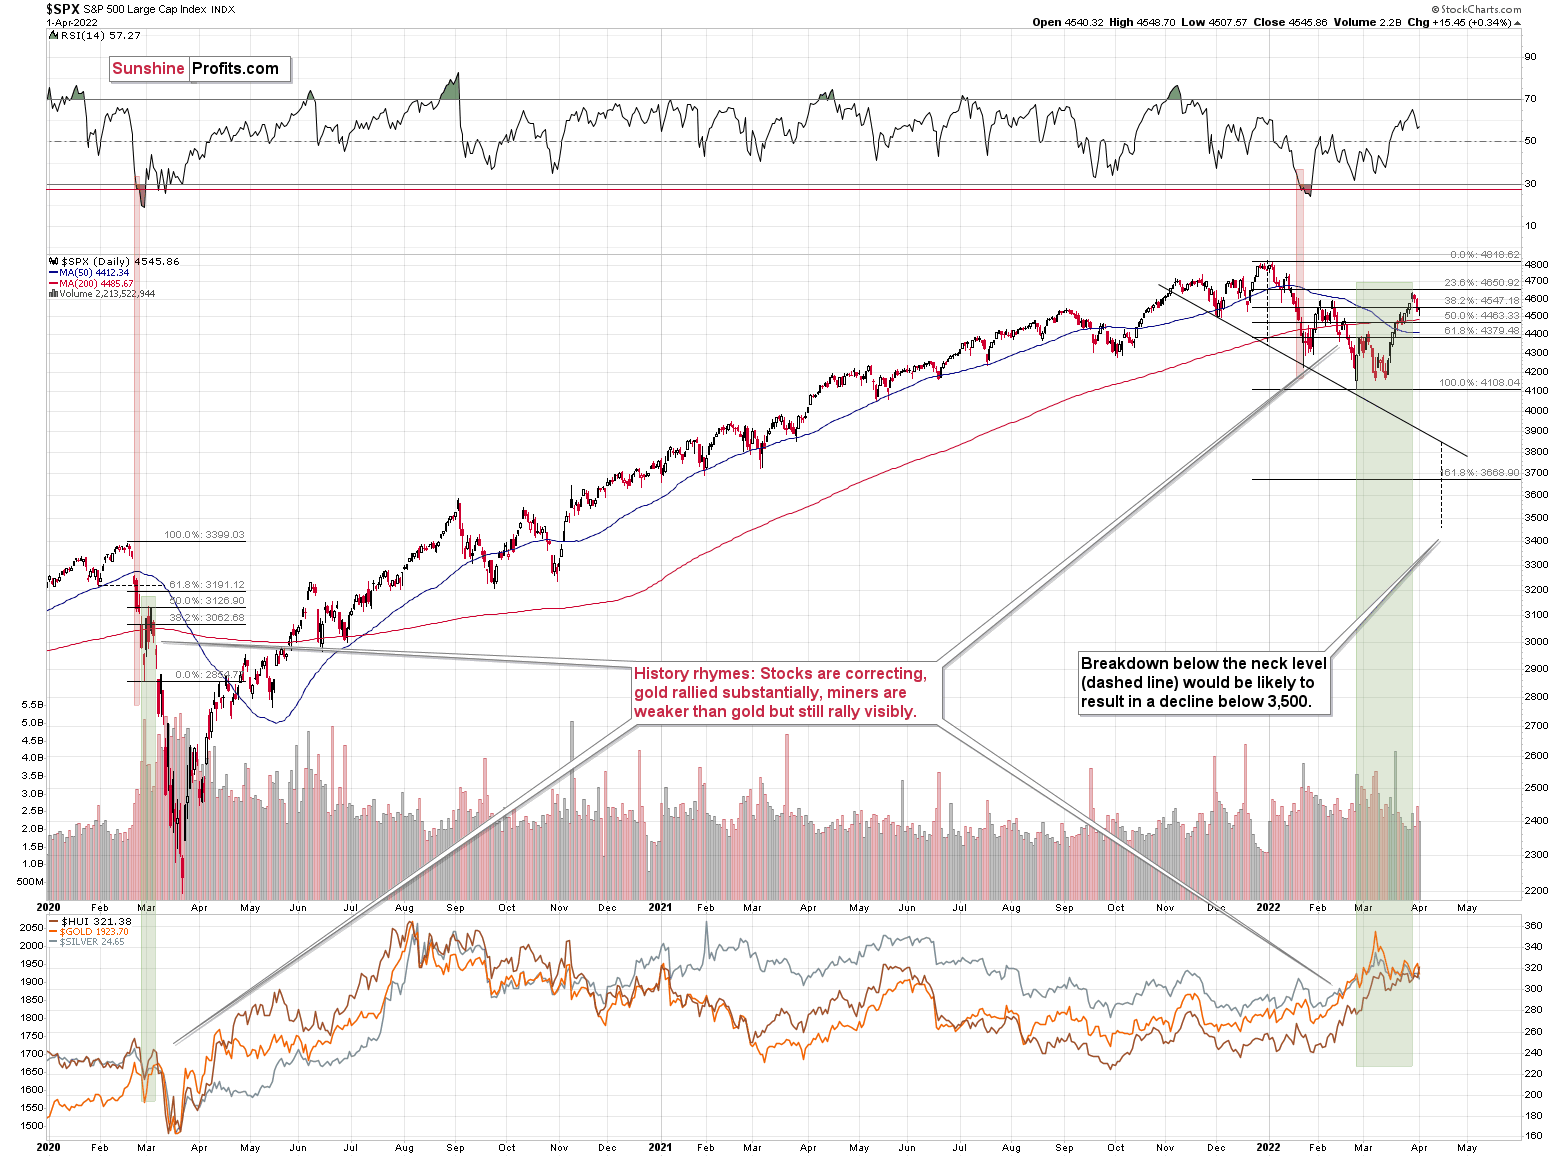
The general stock market closed the week below its February highs, which means that the small breakout above them was invalidated. This is a very bearish indication for the following weeks. Many more investors are likely to become aware of the new interest-rate-hike-driven medium-term bear market once the S&P 500 breaks to new 2022 lows.. That’s when the decline is likely to accelerate, quite likely also in silver and mining stocks that are usually most vulnerable to stock market moves.
Now, “usually” doesn’t mean “always”. Just as it isn’t the case that gold stocks’ strength relative to gold is always a bullish sign. It is the case most of the time, but one should be on the lookout for the circumstances indicating that what one sees is actually an exception. It seems that what we saw on Friday – miners’ strength despite gold’s decline – falls into this category.
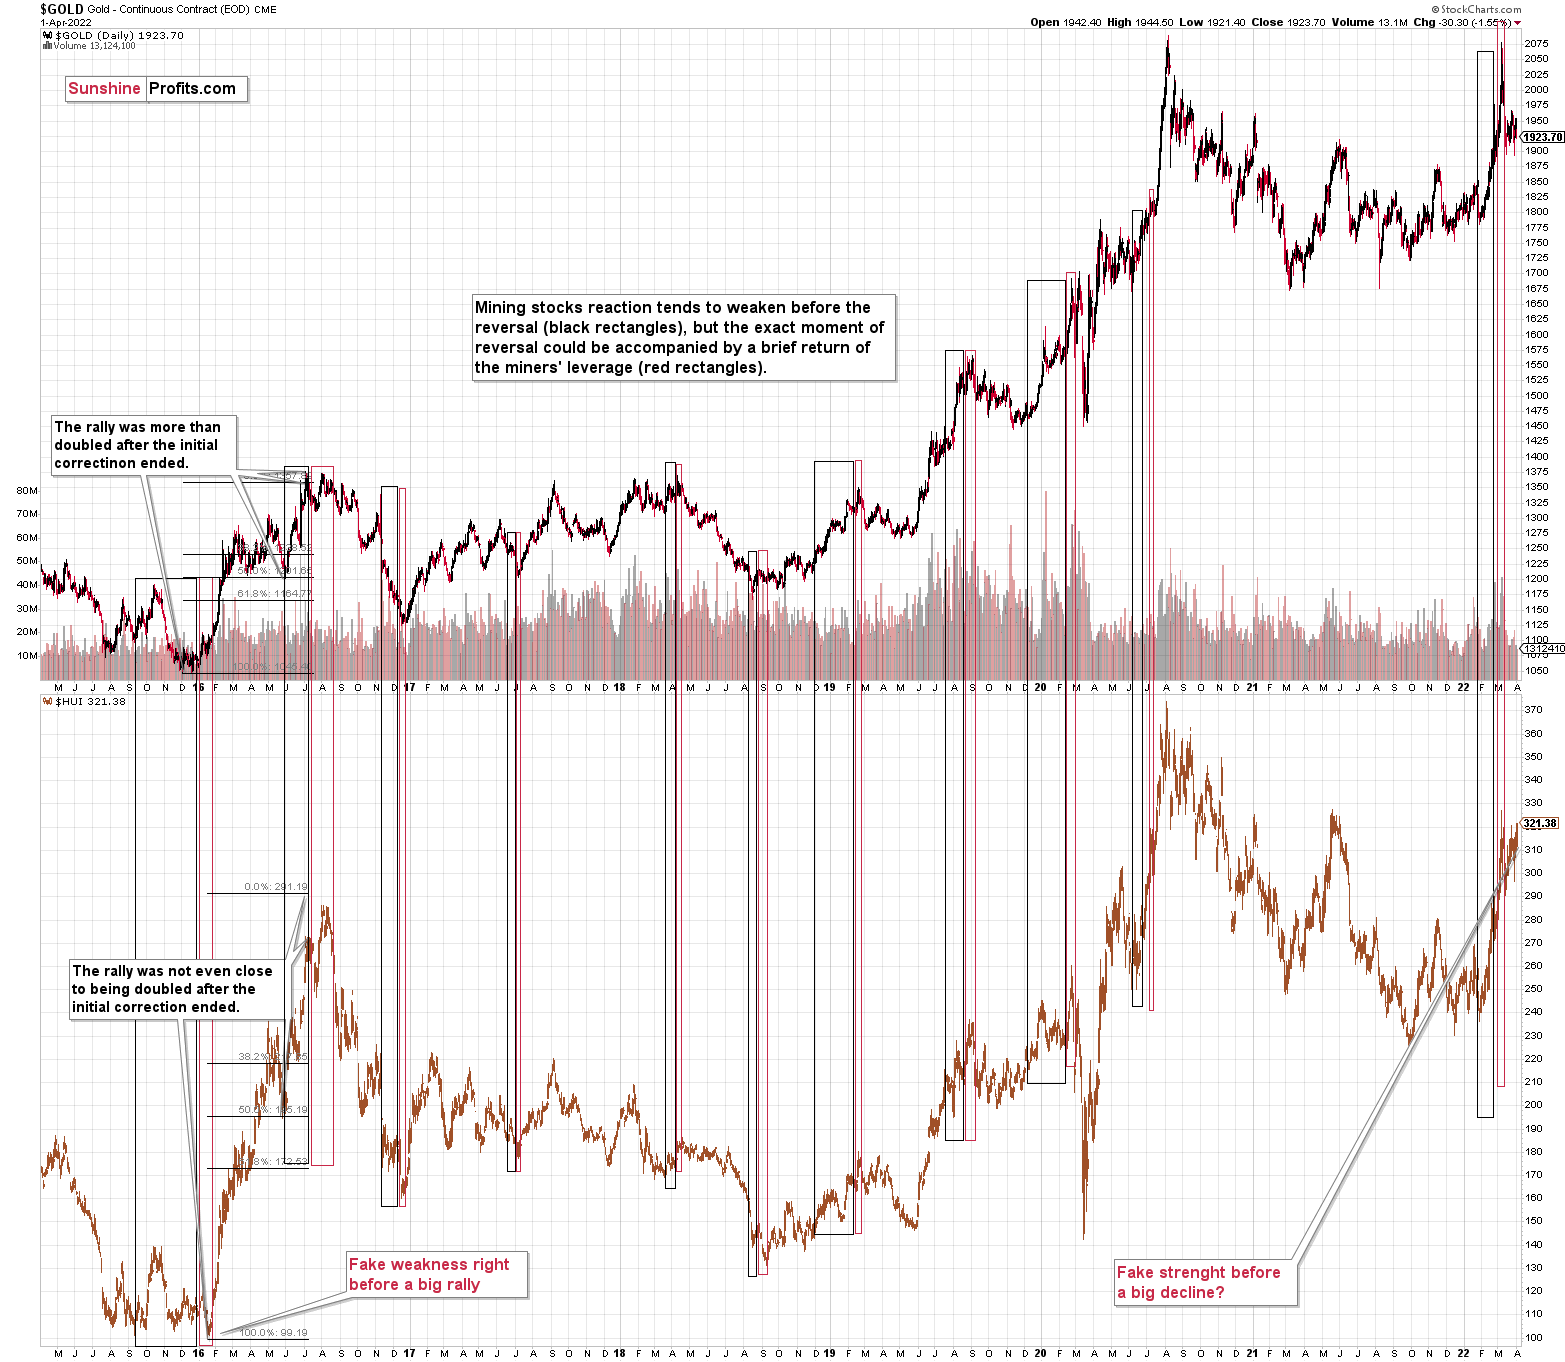
Gold stocks tend to weaken their reaction to what gold is doing for most of the move, but it is not that uncommon for gold stocks to actually magnify gold’s trend right before its reversal.
It’s easier to show it in the example. Please take a look at the late-2015 performance of gold (upper part of the above chart) and gold stocks (lower part of the above chart). When gold first declined below its mid-2015 lows in late-2015, gold stocks held above their own lows. In other words, they were strong relative to gold. However, just before the rally, the gold stocks declined below their previous lows, while gold did almost nothing (they were weak relative to gold). Then they shot up higher.
I marked this and other similar cases with black (miners’ reaction is relatively weak) and red (miners’ reaction is relatively strong) rectangles. As you can see, the 2015-2016 case was not the only one we saw.
Keeping this in mind, please note that what happened on Friday – gold stocks rallied while gold declined – could be this kind of phenomenon. In other words, it could have been a bull trap for gold stock investors.
Looking at the performance of junior mining stocks, we see that nothing major actually happened.
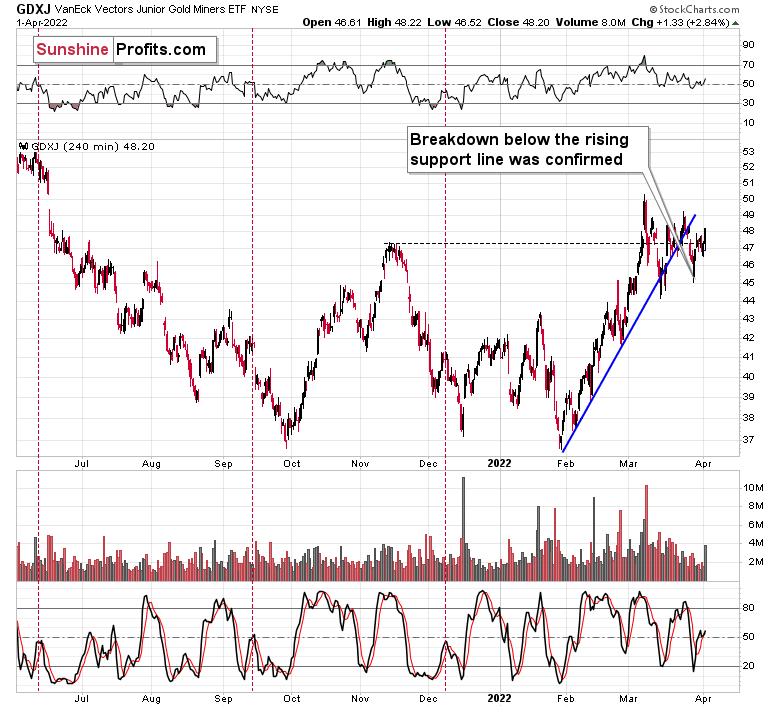
The breakdown below the rising blue support line was confirmed, and this line turned into resistance.
The volume that accompanied the rally was much bigger than what accompanied the preceding 4-hour candlesticks, so it seems that what we saw can be compared to the mid-January top, which also took place when GDXJ rallied on relatively big volume after a few-week-long consolidation.
The volume was also high in mid-December 2021, but this situation is not comparable to the current one, as back then GDXJ was after a short-term decline, and this isn’t the case right now.
Moreover, let’s keep in mind that the USD Index is likely to soar once again soon, thus triggering declines in the precious metals market.
In my previous analyses, I commented on the USD Index in the following way:
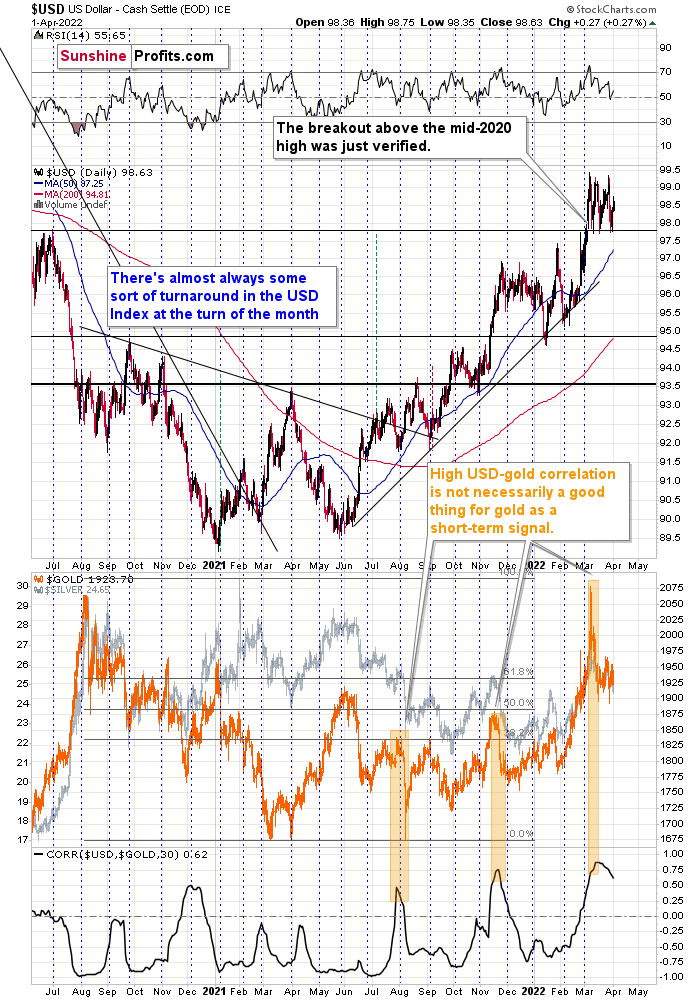
If we focus on the USD Index alone, we’ll see that yesterday’s decline was absolutely inconsequential with regard to changing the outlook for the USDX. It simply continues to consolidate after a breakout above the mid-2020 highs. Breakout + consolidation = increasing chances of rallies’ continuation. A big wave up in the USD Index is likely just around the corner, and the precious metal sector is likely to decline when it materializes.
As the war-based premiums in gold and the USD appear to be waning, a high-interest-rate-driven rally in the USD is likely to trigger declines in gold. The correlation between these two assets has started to decline. When that happened during the last two cases (marked with orange), gold plummeted profoundly shortly thereafter.
The USD Index rallied recently, once again clearly verifying the breakout above its mid-2020 high. This means that the USD Index is now likely ready to rally once again. Naturally, this has bearish implications for the precious metals sector.
All in all, technicals favor a decline in the precious metals sector sooner rather than later.
Overview of the Upcoming Part of the Decline
- It seems to me that the corrective upswing is now over or very close to being over , and that gold, silver, and mining stocks are now likely to continue their medium-term decline.
- It seems that the first (bigger) stop for gold will be close to its previous 2021 lows, slightly below $1,800 . Then it will likely correct a bit, but it’s unclear if I want to exit or reverse the current short position based on that – it depends on the number and the nature of the bullish indications that we get at that time.
- After the above-mentioned correction, we’re likely to see a powerful slide, perhaps close to the 2020 low ($1,450 - $1,500).
- If we see a situation where miners slide in a meaningful and volatile way while silver doesn’t (it just declines moderately), I plan to – once again – switch from short positions in miners to short positions in silver. At this time, it’s too early to say at what price levels this could take place, and if we get this kind of opportunity at all – perhaps with gold close to $1,600.
- I plan to exit all remaining short positions once gold shows substantial strength relative to the USD Index while the latter is still rallying. This may be the case with gold close to $1,350 - $1,400. I expect silver to fall the hardest in the final part of the move. This moment (when gold performs very strongly against the rallying USD and miners are strong relative to gold after its substantial decline) is likely to be the best entry point for long-term investments, in my view. This can also happen with gold close to $1,375, but at the moment it’s too early to say with certainty.
- As a confirmation for the above, I will use the (upcoming or perhaps we have already seen it?) top in the general stock market as the starting point for the three-month countdown. The reason is that after the 1929 top, gold miners declined for about three months after the general stock market started to slide. We also saw some confirmations of this theory based on the analogy to 2008. All in all, the precious metals sector is likely to bottom about three months after the general stock market tops.
- The above is based on the information available today, and it might change in the following days/weeks.
You will find my general overview of the outlook for gold on the chart below:
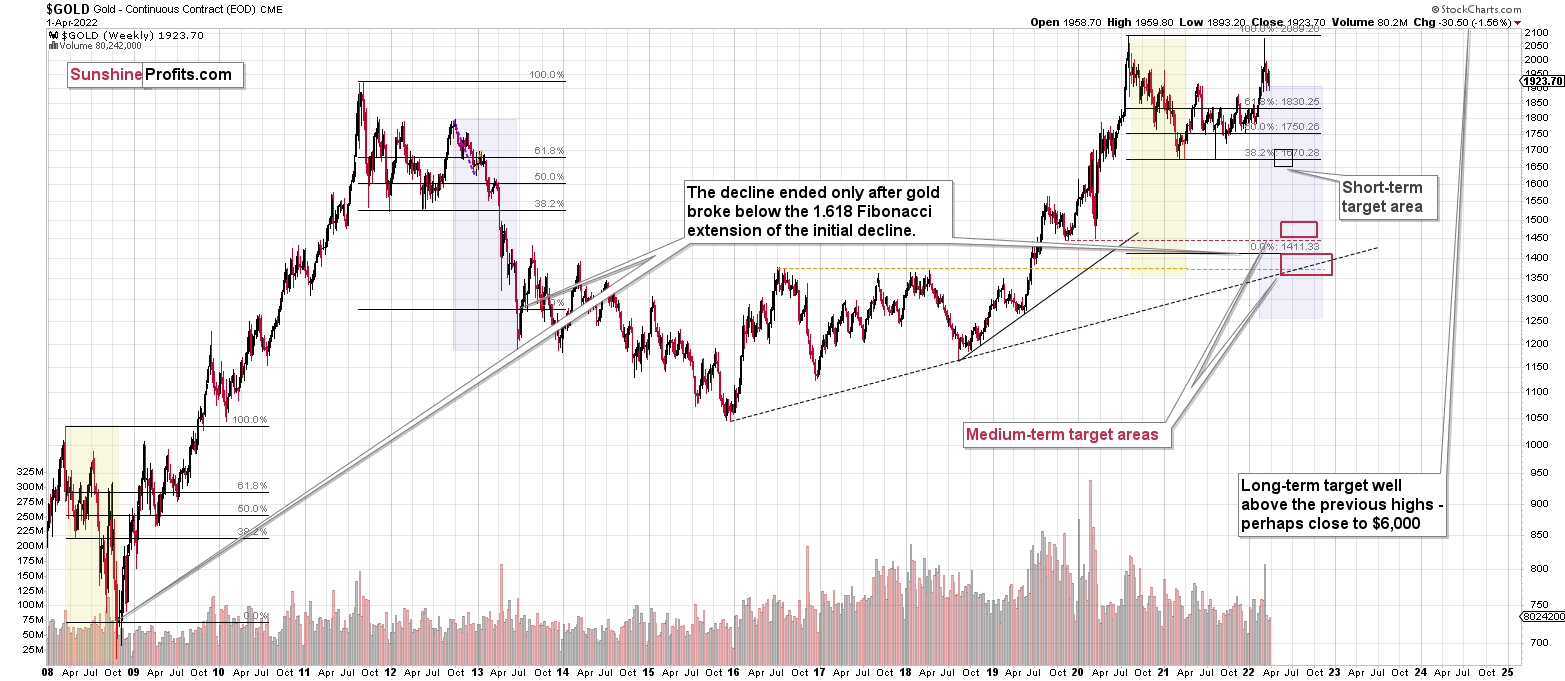
Please note that the above timing details are relatively broad and “for general overview only” – so that you know more or less what I think and how volatile I think the moves are likely to be – on an approximate basis. These time targets are not binding or clear enough for me to think that they should be used for purchasing options, warrants or similar instruments.
Summary
Summing up, despite the recent rally in gold, the outlook for junior mining stocks remains exactly as I described previously.
Crude oil’s extreme outperformance, the stock market’s weakness, and critical medium-term resistance levels reached by gold (all-time high!) and junior mining stocks, all indicate that the tops are at hand or have just formed.
Investing and trading are difficult. If it was easy, most people would be making money – and they’re not. Right now, it’s most difficult to ignore the urge to “run for cover” if you physically don’t have to. The markets move on “buy the rumor and sell the fact.” This repeats over and over again in many (all?) markets, and we have direct analogies to similar situations in gold itself. Junior miners are likely to decline the most, also based on the massive declines that are likely to take place (in fact, they have already started) in the stock markets.
From the medium-term point of view, the two key long-term factors remain the analogy to 2013 in gold and the broad head and shoulders pattern in the HUI Index. They both suggest much lower prices ahead.
It seems that our profits from short positions are going to become truly epic in the coming months.
After the sell-off (that takes gold to about $1,350-$1,500), I expect the precious metals to rally significantly. The final part of the decline might take as little as 1-5 weeks, so it's important to stay alert to any changes.
As always, we'll keep you - our subscribers - informed.
To summarize:
Trading capital (supplementary part of the portfolio; our opinion): Full speculative short positions (300% of the full position) in junior mining stocks are justified from the risk to reward point of view with the following binding exit profit-take price levels:
Mining stocks (price levels for the GDXJ ETF): binding profit-take exit price: $34.63; stop-loss: none (the volatility is too big to justify a stop-loss order in case of this particular trade)
Alternatively, if one seeks leverage, we’re providing the binding profit-take levels for the JDST (2x leveraged) and GDXD (3x leveraged – which is not suggested for most traders/investors due to the significant leverage). The binding profit-take level for the JDST: $14.98; stop-loss for the JDST: none (the volatility is too big to justify a SL order in case of this particular trade); binding profit-take level for the GDXD: $25.48; stop-loss for the GDXD: none (the volatility is too big to justify a SL order in case of this particular trade).
For-your-information targets (our opinion; we continue to think that mining stocks are the preferred way of taking advantage of the upcoming price move, but if for whatever reason one wants / has to use silver or gold for this trade, we are providing the details anyway.):
Silver futures downside profit-take exit price: $19.12
SLV profit-take exit price: $17.72
ZSL profit-take exit price: $38.28
Gold futures downside profit-take exit price: $1,683
HGD.TO – alternative (Canadian) inverse 2x leveraged gold stocks ETF – the upside profit-take exit price: $11.79
HZD.TO – alternative (Canadian) inverse 2x leveraged silver ETF – the upside profit-take exit price: $29.48
Long-term capital (core part of the portfolio; our opinion): No positions (in other words: cash
Insurance capital (core part of the portfolio; our opinion): Full position
Whether you already subscribed or not, we encourage you to find out how to make the most of our alerts and read our replies to the most common alert-and-gold-trading-related-questions.
Please note that we describe the situation for the day that the alert is posted in the trading section. In other words, if we are writing about a speculative position, it means that it is up-to-date on the day it was posted. We are also featuring the initial target prices to decide whether keeping a position on a given day is in tune with your approach (some moves are too small for medium-term traders, and some might appear too big for day-traders).
Additionally, you might want to read why our stop-loss orders are usually relatively far from the current price.
Please note that a full position doesn't mean using all of the capital for a given trade. You will find details on our thoughts on gold portfolio structuring in the Key Insights section on our website.
As a reminder - "initial target price" means exactly that - an "initial" one. It's not a price level at which we suggest closing positions. If this becomes the case (like it did in the previous trade), we will refer to these levels as levels of exit orders (exactly as we've done previously). Stop-loss levels, however, are naturally not "initial", but something that, in our opinion, might be entered as an order.
Since it is impossible to synchronize target prices and stop-loss levels for all the ETFs and ETNs with the main markets that we provide these levels for (gold, silver and mining stocks - the GDX ETF), the stop-loss levels and target prices for other ETNs and ETF (among other: UGL, GLL, AGQ, ZSL, NUGT, DUST, JNUG, JDST) are provided as supplementary, and not as "final". This means that if a stop-loss or a target level is reached for any of the "additional instruments" (GLL for instance), but not for the "main instrument" (gold in this case), we will view positions in both gold and GLL as still open and the stop-loss for GLL would have to be moved lower. On the other hand, if gold moves to a stop-loss level but GLL doesn't, then we will view both positions (in gold and GLL) as closed. In other words, since it's not possible to be 100% certain that each related instrument moves to a given level when the underlying instrument does, we can't provide levels that would be binding. The levels that we do provide are our best estimate of the levels that will correspond to the levels in the underlying assets, but it will be the underlying assets that one will need to focus on regarding the signs pointing to closing a given position or keeping it open. We might adjust the levels in the "additional instruments" without adjusting the levels in the "main instruments", which will simply mean that we have improved our estimation of these levels, not that we changed our outlook on the markets. We are already working on a tool that would update these levels daily for the most popular ETFs, ETNs and individual mining stocks.
Our preferred ways to invest in and to trade gold along with the reasoning can be found in the how to buy gold section. Furthermore, our preferred ETFs and ETNs can be found in our Gold & Silver ETF Ranking.
As a reminder, Gold & Silver Trading Alerts are posted before or on each trading day (we usually post them before the opening bell, but we don't promise doing that each day). If there's anything urgent, we will send you an additional small alert before posting the main one.
Thank you.
Przemyslaw Radomski, CFAFounder, Editor-in-chief

