
tools spotlight

-
When in Fear… Gold Is Near? Miners May Regret Hasty Decisions
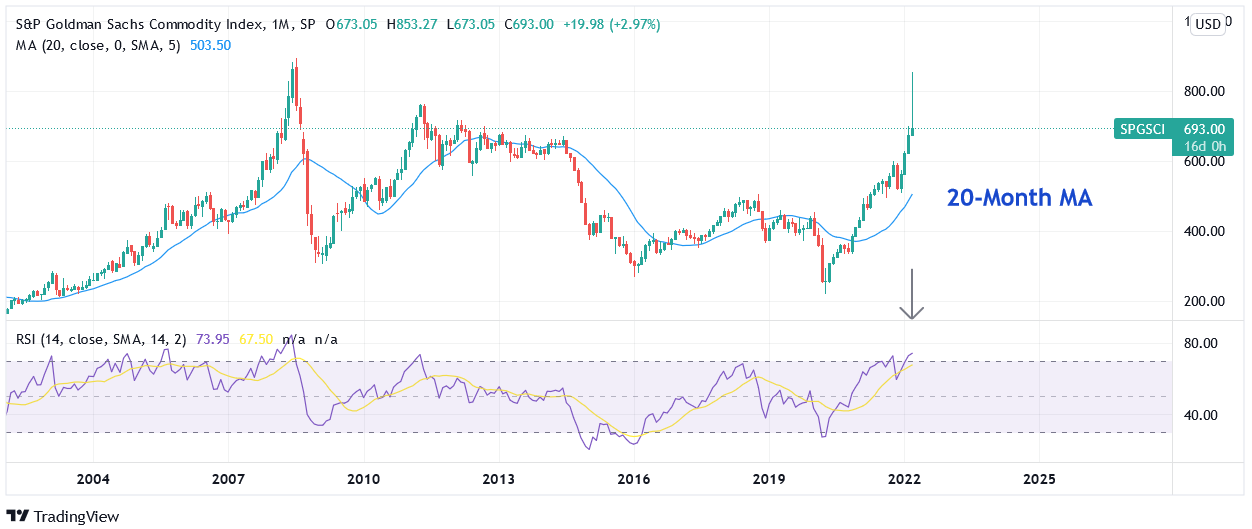
March 16, 2022, 9:01 AMWhile the PMs were the belle of the ball when the Russia-Ukraine conflict erupted, I warned that investors are often the most bearish at the bottom and the most bullish at the top. With the S&P Goldman Sachs Commodity Index (S&P GSCI) following in the footsteps of the ARK Innovation ETF, commodities' fervor has cooled materially in recent days.
For context, the S&P GSCI contains 24 commodities from all sectors: six energy products, five industrial metals, eight agricultural products, three livestock products, and two precious metals. However, energy accounts for roughly 54% of the index's movement.
More importantly, though, while the index declined by another 3.22% on Mar. 16 and helped diminish gold's sentiment, the S&P GSCI still remains materially disconnected from its 20-month moving average. Furthermore, the more than 150-point peak-to-trough decline has done little to reduce the overbought conditions showcased on its monthly RSI (~74).
As a result, there is plenty of room for further downside, and the PMs should suffer if the mean reversion continues.
Please see below:
To that point, with investors known for their herd mentality, I noted on Mar. 15 that speculators’ love affair with gold was bearish, not bullish. I wrote:
It’s clear that human nature never changes. If you analyze the chart below, you can see that non-commercial (speculative) futures traders were all-in on gold at the end of last week (the latest data available).
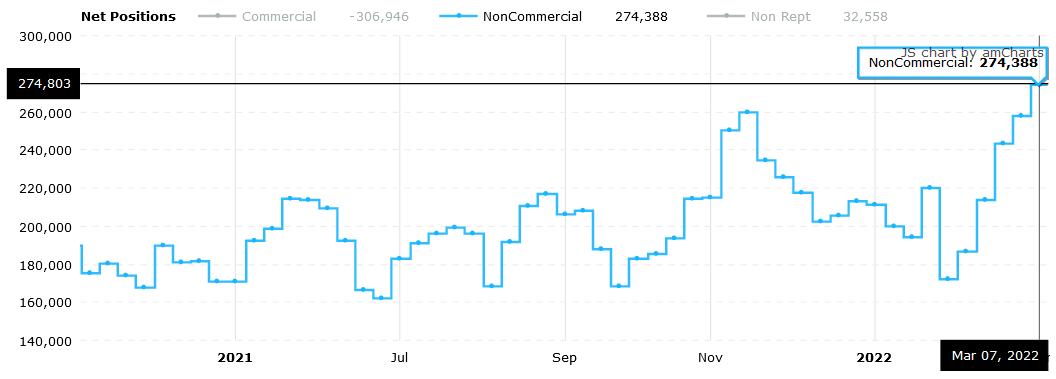 Source: COT report
Moreover, with speculative long positions increasing materially in recent weeks and the crowd often the most bullish at the top, it’s another contrarian indicator that supports lower gold prices over the medium term.
Please see below:
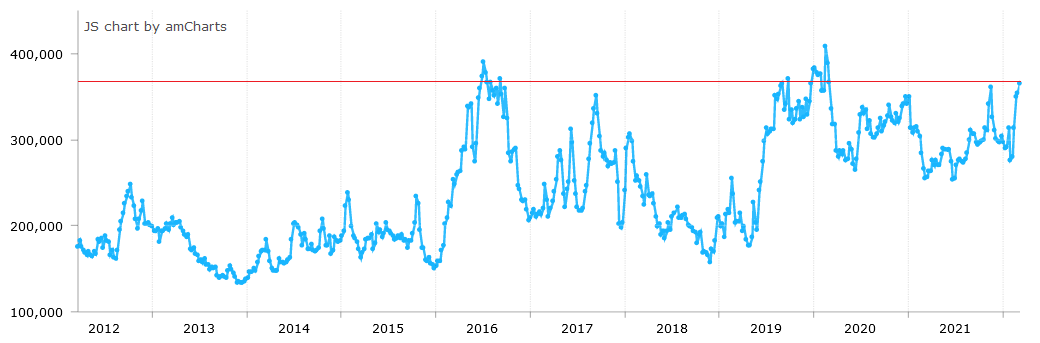 Source: COT report
The Sentiment Unwind
Likewise, with Bank of America releasing its latest Global Fund Managers Survey on Mar. 15, the net percentage of institutional investors overweight commodities is the highest in more than 16 years.
Please see below:
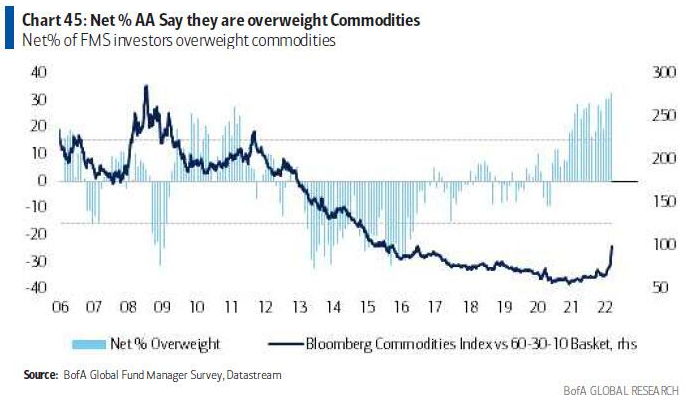
To explain, the dark blue line above tracks a variation of the Bloomberg Commodities Index, while the light blue bars above track the net percentage of respondents that are overweight on commodities. If you analyze the right side of the chart, you can see that allocations shot to new heights in the latest survey.
Moreover, with large dispersions often followed by large reversions, what’s popular today may not be so popular next week or next month. With price often a major driver of sentiment, the recent decline in the S&P GSCI could spark a positioning shift. If this occurs, the outcome is bearish for the PMs.
As further evidence, the Bank of America noted that long commodities are the most crowded trade on Wall Street.
Please see below:
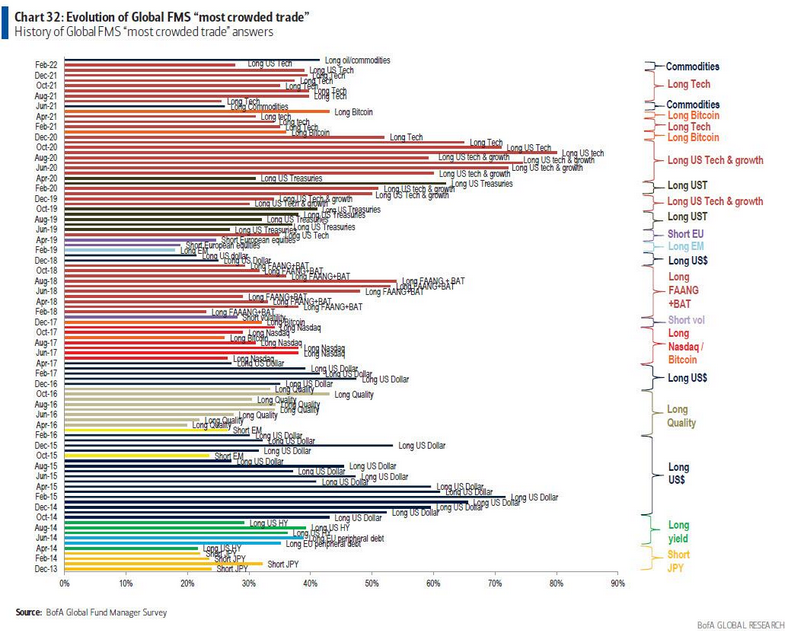
To explain, the various horizontal bars above track the most popular positions of institutional investors each month. If you analyze the dark blue bar at the top, you can see that long commodities have gained immense popularity.
However, please note the length of the horizontal red bars from Jun 20 to Oct 20. Notice anything interesting? Well, with long tech captivating investors during that period, they chased ever-higher prices. However, if you analyze the second bar from the top, you can see that long tech positioning is roughly half of what it was then. As a result, it indicates how quickly sentiment can shift.
For context, I wrote about the similarities between commodities and high-growth tech on Mar. 8:
The unabated optimism rivals what we saw with SPACs, IPOs, and the ARK Innovation ETF in 2020. Yet, this time is different, and $2,500 gold is on the horizon?
Please see below:
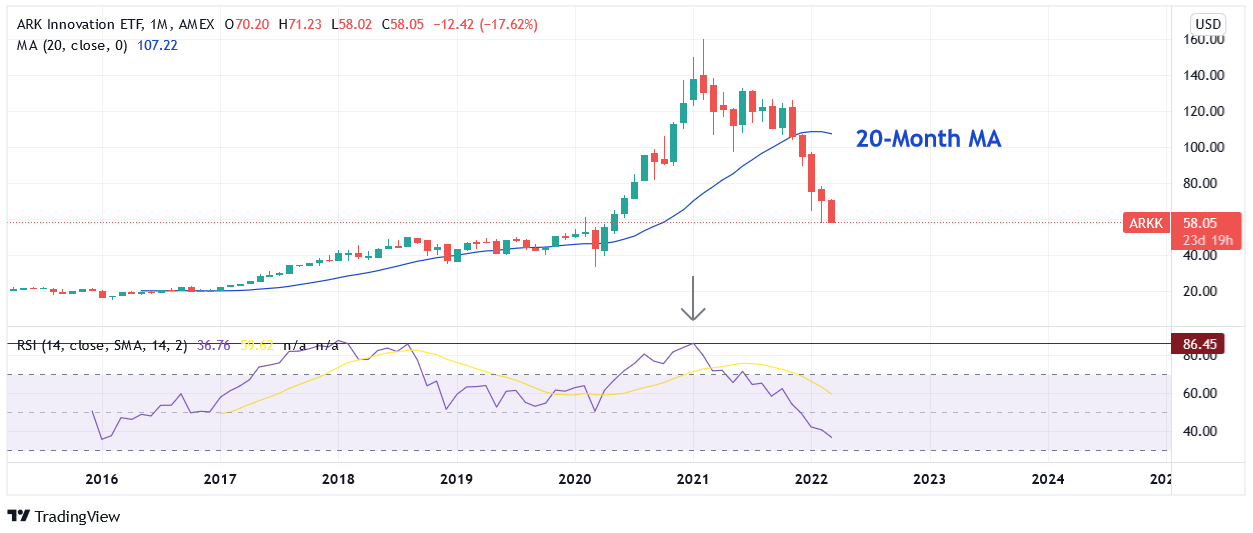
When its RSI mirrored the behavior and the ARK Innovation ETF outperformed its 20-month MA by more than 115% in 2020, an epic collapse eventually unfolded. As of the Mar. 7 close, the ETF had suffered a 64% peak-to-trough decline.
To that point, with sentiment as a powerful force, investors’ emotions often cloud their judgment. When this occurs, fundamentals are powerless to stop the momentum. As a result, that’s why financial markets often overshoot on the upside and the downside.
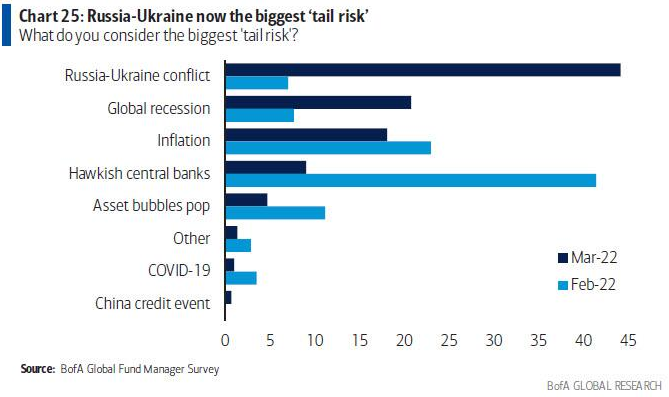
Moreover, with institutional investors’ heightened anxiety about the Russia-Ukraine conflict and the potential for a global recession impacting their decision-making, gold provides them comfort as a natural safe haven.
For example, if you analyze the chart below, you can see that fear over both developments rose to the top spots in March. However, with “hawkish central banks” going from big deal to no deal in a span of the month, it signals how quickly sentiment can shift.
Please see below:
Furthermore, with fear helping to underwrite the PMs’ recent ascent, the S&P 500’s relief rally on Mar. 15 did little to quell investors’ trepidation. As evidence, CNN’s Fear & Greed Index is still firmly in the red.
Please see below:
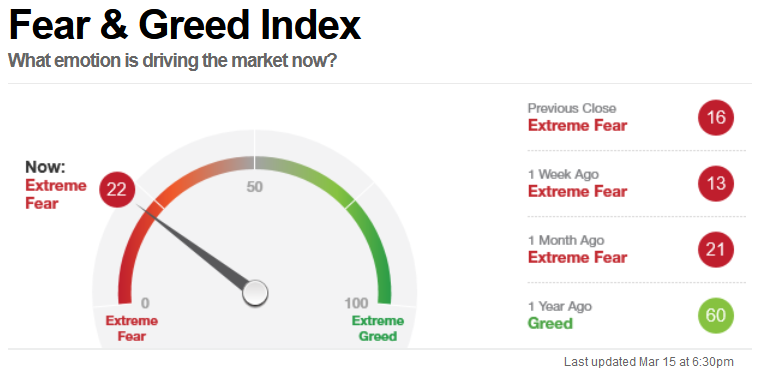 Source: CNN
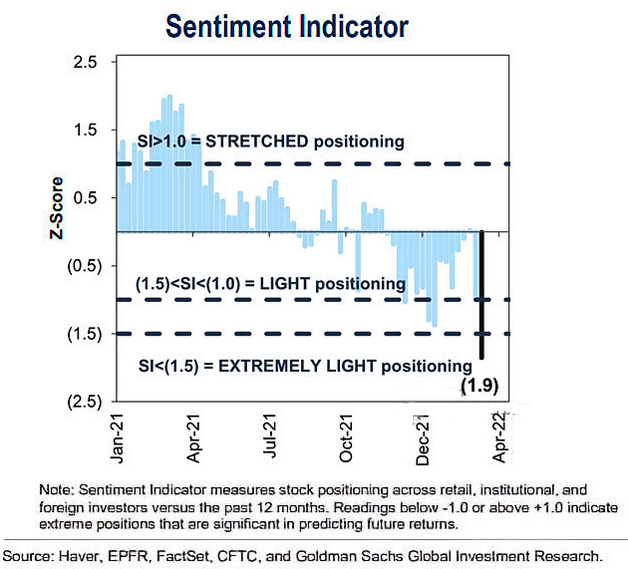
On top of that, Goldman Sachs’ sentiment indicator hit 1.9 standard deviations below the average on Mar. 14.
Please see below:
PMs to Fill the Void
To explain, Goldman Sachs considers z-scores of -1 or +1 to indicate “extreme” positioning. If you analyze the right side of the chart, you can see that the latest reading (the dark blue bar) is sharply negative. As a result, with skittish investors often flocking to gold during periods of uncertainty, a normalization of sentiment will likely hurt the PMs.
Expanding on that point, data from Deutsche Bank shows that systematic equity positioning is in the 7th percentile. For context, this metric tracks the positioning of algorithmic and quantitative investors. Moreover, if they’re not buying stocks or bonds, the PMs are strong candidates to fill the void.
Please see below:
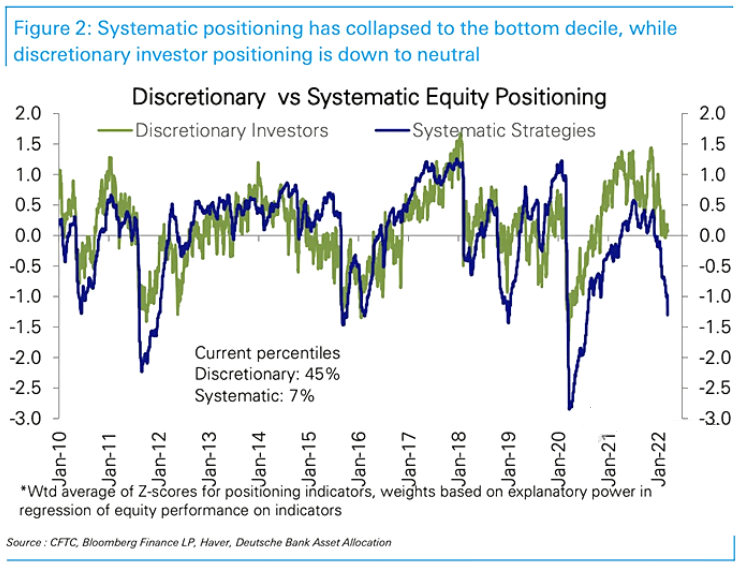
To explain, the green and blue lines above track discretionary and systematic investors’ equity positioning. If you analyze the right side of the chart, you can see that the latter has declined significantly. Moreover, with a reading in the 7th percentile implying that 93% of the time, systematic investors have more equity exposure, the void opened the door for more commodities investments. As a result, the PMs benefited from ‘the most crowded trade on Wall Street.’
Finally, the U.S. 10-Year Treasury yield rallied again on Mar. 15 and closed at another 2022 high of 2.15%. Moreover, with liquidity in the futures market continuing to deteriorate, more yield spikes could be on the horizon.
Please see below:
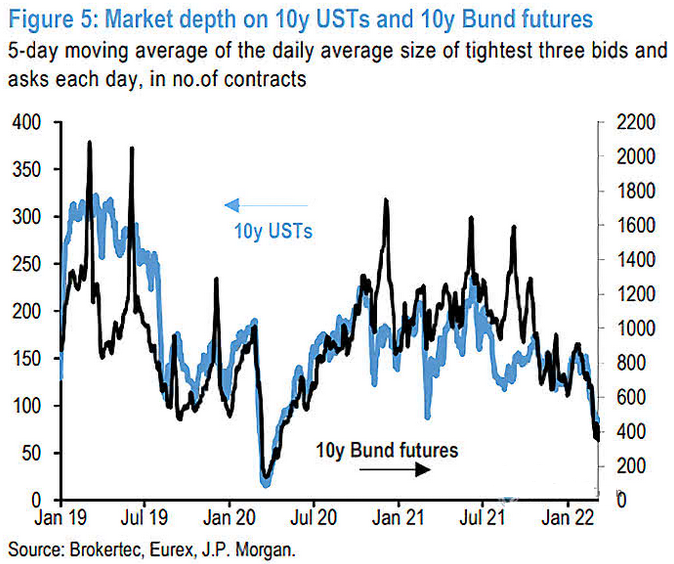
To explain, the black and blue lines above track the market depth for 10-Year Treasury and Bund (German bonds) futures. If you analyze the right side of the chart, you can see that the five-day moving average of the tightest bid-ask settlements continues to decline. As a result, a shallow market has resulted in more contracts being settled with wider bid-ask spreads.
In turn, this creates liquidity risk, as buyers may not be there when large sellers want to unwind 10-Year Treasury futures positions. Due to that, yields often spike when sellers outweigh buyers. As such, the more the blue line declines, the more it increases the chance of a taper-tantrum-like event.
The bottom line? While the Russia-Ukraine conflict allowed the PMs to ignore bearish domestic fundamentals, sentiment is starting to shift, and while the PMs retreat from their 2022 highs, the USD Index has barely budged. As a result, while the Russia-Ukraine drama helped elicit a bid for the greenback, its strong fundamentals are in place despite the conflict. Moreover, with U.S. Treasury yields seeking higher ground alongside the USD Index, it’s an extremely bearish sign for the PMs.
In conclusion, the PMs were mixed on Mar. 15, as mining stocks sidestepped the negativity. However, with their fundamental outlooks worsening and the Fed poised to raise interest rates today, larger drawdowns should occur over the next few months. Moreover, if Russia and Ukraine reach a resolution, the sentiment unwind could occur at a rapid pace.
Thank you for reading our free analysis today. Please note that the above is just a small fraction of the full analyses that our subscribers enjoy on a regular basis. They include multiple premium details such as the interim targets for gold and mining stocks that could be reached in the next few weeks. We invite you to subscribe now and read today’s issue right away.
Sincerely,
Przemyslaw Radomski, CFA
Founder, Editor-in-chief -
If History Rhymes, Gold and Silver Are Back on Slippery Slope
March 15, 2022, 8:42 AMIn line with predictions, gold is ceasing to benefit from war-fueled uncertainty. Meanwhile, silver faked another breakout. Could it be more bearish?
Last week’s powerful, huge-volume reversal in gold was likely to be followed by declines. It was – but that’s just the beginning.
Yesterday’s $24 decline might seem significant on a day-to-day basis, but compared to last week’s enormous reversal, it’s really tiny.
The modest extent of yesterday’s decline is by no means bullish – my emphasis on the small size of the decline so far should be viewed as an indication that much more is likely on the horizon. Besides, gold was down by about $20 in today’s pre-market trading.
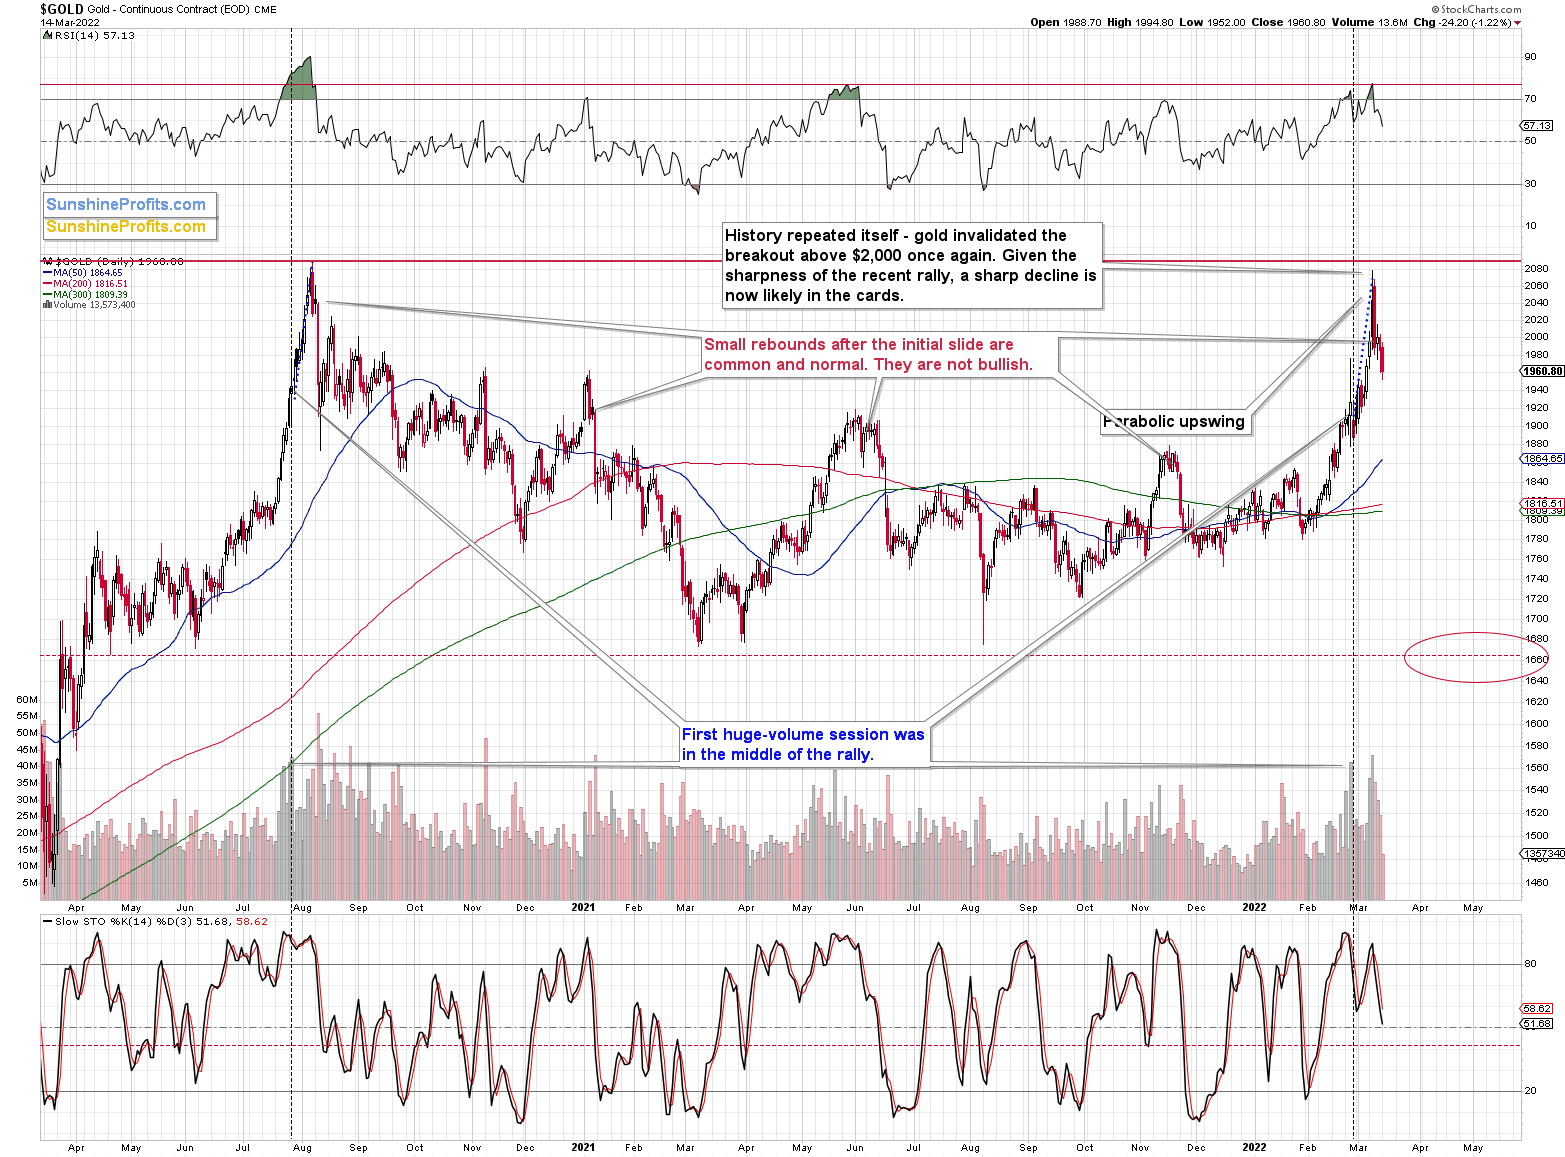
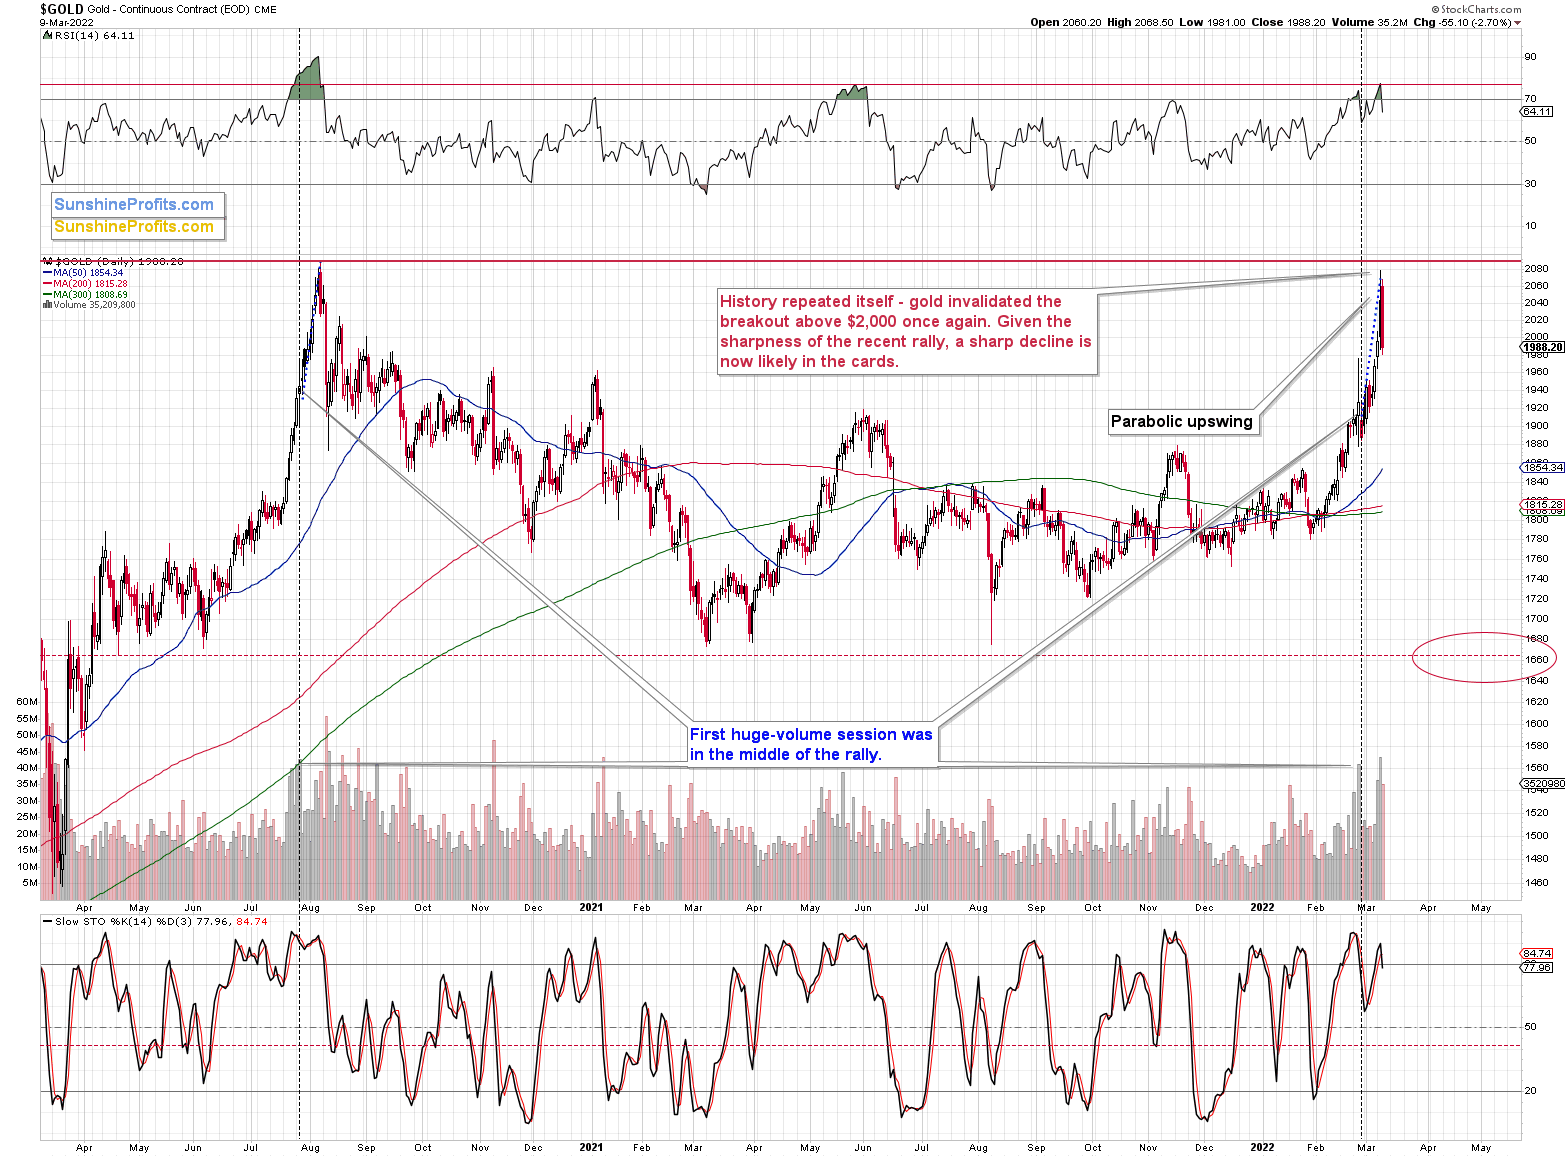
As I wrote yesterday, gold’s breakout above $2,000 was officially invalidated, and given the weekly reversal, it seems that the war-uncertainty-based rally is over.
The decisive move below 70 in the RSI indicator after it was trading above 70 clearly confirms that the top is already behind us. Just like it was in 2020 and 2021 when similar things happened, history appears to have rhymed.
On Friday, I wrote the following:
Gold’s move of $0.40 (yes, forty cents) above $2,000 is not important as the breakout above this level was just invalidated the previous day. Technically, this is another attempt to break above this level, which is likely to be invalidated based on what we see in today’s pre-market trading.
The fact that I would like to emphasize today is that this kind of small rebound after the initial slide is common and perfectly normal for gold. We saw exactly the same thing right after gold’s 2020 top and after its 2021 top, and also two more times in 2021 (as marked on the above chart).
This means that yesterday’s upswing is not particularly bullish. It’s a normal post-top reaction. Lower gold values are to be expected.
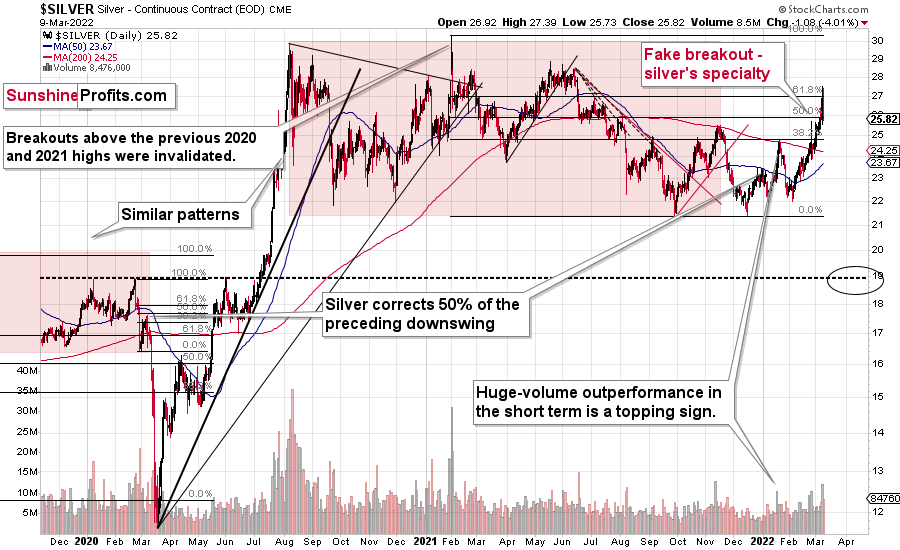
Silver declined yesterday, and it closed the day below its late-2021 high.
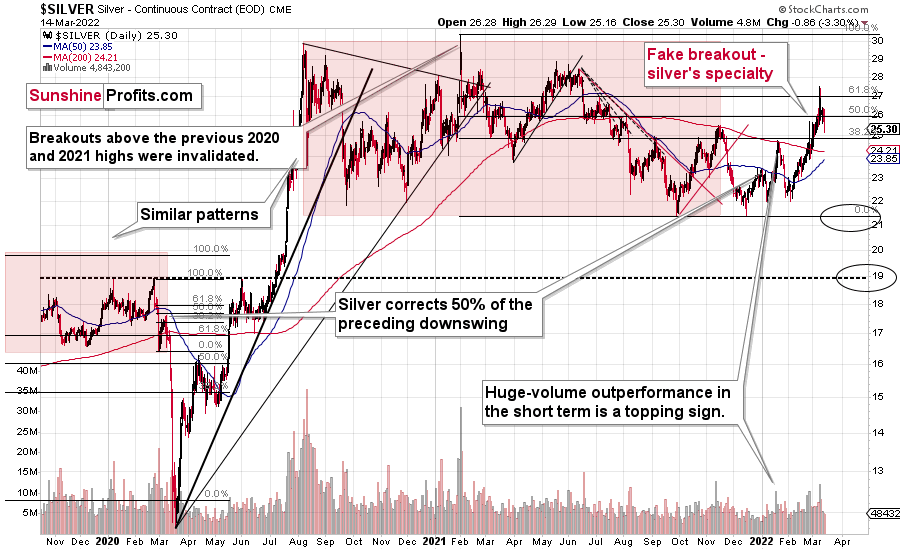
In other words, the breakout above this level was invalidated. This is a strong bearish confirmation from the white metal.
The white metal just invalidated the move above its 61.8% Fibonacci retracement.
That’s bearish on its own, but let’s keep in mind that it happened right after silver outperformed gold.
Last Tuesday, the GDXJ ETF was up by less than 1%, gold was up by 2.37%, and silver was up by 4.57%. Silver’s outperformance and miners’ underperformance is what we tend to see right at the tops. That’s exactly what it was – a top. Silver declined profoundly, and the attempt to break above its 61.8% Fibonacci retracement level will soon be just a distant (in terms of price) memory.
On a medium-term basis, silver was simply weak relative to gold, but we saw short-term outperformance. In short, that was and continues to be bearish.
As far as silver’s big picture is concerned, please note that it also provides us with a confirmation of the analogy between 2012 and now.
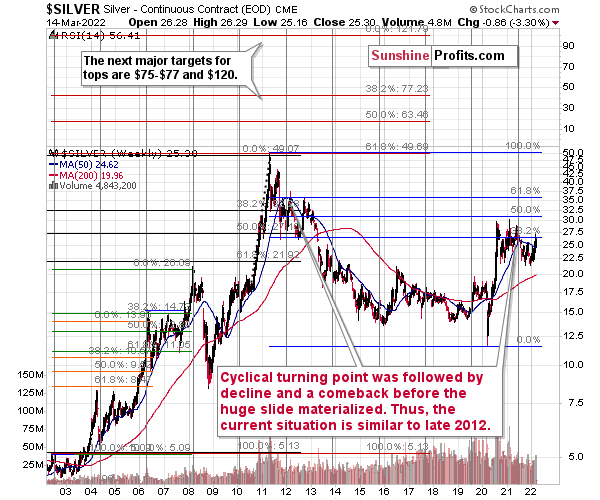
At the turn of the year in 2011/2012, there was a cyclical turning point in silver, and we saw a sizable decline in silver shortly thereafter. The same happened in 2021, after silver’s cyclical turning point.
Back in 2012, silver declined more or less to its previous lows and then rallied back up, but it didn’t reach its previous top. It more or less rallied to its 50-week moving average and then by about the same amount before topping.
Recently, we saw exactly the same thing. After the initial decline, silver bottomed close to its previous lows, and most recently it rallied to its 50-week moving average and then by about the same amount before topping – below the previous high.
Thus, the situation is just like what it was during the 2012 top in all three key components of the precious metals sector: gold, silver, and mining stocks.
We have a situation in the general stock market that points to an even quicker slide than what we saw in 2012-2013. If stocks slide sharply and significantly just like in 2008, then the same fate may await the precious metals sector – just like in 2008. In this case, silver and mining stocks (in particular, junior mining stocks) would be likely to fall in a spectacular manner.
All the above was confirmed by silver’s invalidation of its breakout above the late-2021 high. Not only has the medium-term outlook been bearish, but now the short-term outlook for silver is bearish too.
Thank you for reading our free analysis today. Please note that the above is just a small fraction of the full analyses that our subscribers enjoy on a regular basis. They include multiple premium details such as the interim targets for gold and mining stocks that could be reached in the next few weeks. We invite you to subscribe now and read today’s issue right away.
Sincerely,
Przemyslaw Radomski, CFA
Founder, Editor-in-chief -
The End of Gold’s War-Based Rally? Let the USDX Drop You a Hint
March 14, 2022, 9:47 AMFriday’s session was particularly interesting when we compare what happened in gold to what happened in the USD Index.
Gold invalidated its important breakout above $2,000, thus flashing a medium-term sell signal.
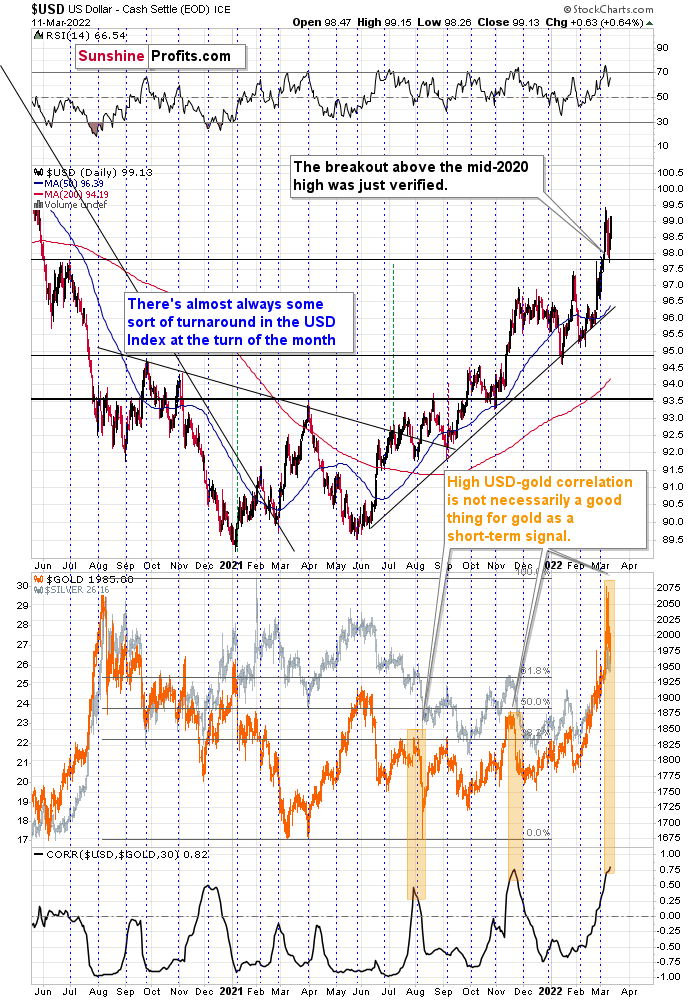
The USD Index, on the other hand, confirmed its breakout above its mid-2020 high by moving back to it and then rallying once again.
This major difference on the technical level tells us that the key driver behind rallies in both assets is starting to wane. The key driver was, of course, the fear and uncertainty regarding Russia’s invasion of Ukraine. I’ve been writing about both points for many days:
- Geopolitical events have only a temporary impact on gold prices .
- Based on the analogies to how gold performed after previous military interventions (Russia annexing Crimea, the U.S. invading Iraq, the U.S. invading Afghanistan), it was likely that the rally would be a short-term phenomenon that would be followed by a decline. In fact, based on the “oil factor,” the situation might be particularly similar to the U.S.’s invasion of Iraq. Back then, mining stocks gave away their war-tension-based gains rather quickly.
What we saw on Friday appears to be an indication that history is rhyming.
Also, please note that if one looks at the correlation between the USD Index and gold (lower part of the chart), high values tend to coincide with tops in gold, especially when the latter is after a short-term rally. The correlation just moved to the level that it reached when gold topped in late 2021, so we have yet another factor pointing to lower gold prices in the coming weeks.
Before moving to the fundamental part of the analysis, I would to like quote what I wrote after gold invalidated its breakout above $2,000 for the first time, as it applies today as well:
So much for gold’s move above $2,000. Congratulations on avoiding the mania – it was not easy. The volume readings show that many people were caught up in the “inevitable rally” in gold. You, however, kept focused on what’s most important in the medium term, and over this time frame, this approach is likely to prove most beneficial.
As gold tried to rally to new all-time highs, I sent out an intraday Gold & Silver Trading Alert, and in it, I emphasized the likely temporary nature of this move. I wrote the following:
Yes, the situation in Ukraine is critical.
However, the two key drivers of gold price continue to point to lower gold prices, and at the same time we know that geopolitical-event-based rallies don’t last and very likely to be reversed.
These two key drivers are:
- real interest rates;
- the USD Index.
The USD Index is already soaring, and real interest rates are likely to increase as the nominal interest rates are about to increase – and given the recent rally in prices they might increase more than most investors expect them to.
Consequently, while – given today’s rally – it might seem like there’s no stopping gold, silver, and mining stocks, please keep the above in mind. This rally is likely to be reversed, and when it reverses, junior gold miners are likely to decline in an epic manner, leading to epic profits for those who didn’t succumb the mania during the parabolic upswing.
Thank you for reading our free analysis today. Please note that the above is just a small fraction of the full analyses that our subscribers enjoy on a regular basis. They include multiple premium details such as the interim targets for gold and mining stocks that could be reached in the next few weeks. We invite you to subscribe now and read today’s issue right away.
Sincerely,
Przemyslaw Radomski, CFA
Founder, Editor-in-chief -
Collapse of Gold Miners Ahead – What Else Can History Tell Us?
March 11, 2022, 9:06 AMAvailable to premium subscribers only.
Thank you for reading our free analysis today. Please note that the above is just a small fraction of the full analyses that our subscribers enjoy on a regular basis. They include multiple premium details such as the interim targets for gold and mining stocks that could be reached in the next few weeks. We invite you to subscribe now and read today’s issue right away.
Sincerely,
Przemyslaw Radomski, CFA
Founder, Editor-in-chief -
Gold Fails Its All-Time Highs Rally: A Bearish Signal for Miners
March 10, 2022, 9:26 AMSo much for gold’s move above $2,000. Congratulations on avoiding the mania – it was not easy. The volume readings show that many people were caught up in the “inevitable rally” in gold. You, however, kept focused on what’s most important in the medium term, and over this time frame, this approach is likely to prove most beneficial.
As gold tried to rally to new all-time highs, I sent out an intraday Gold & Silver Trading Alert, and in it, I emphasized the likely temporary nature of this move. I wrote the following:
Yes, the situation in Ukraine is critical.
However, the two key drivers of gold price continue to point to lower gold prices, and at the same time we know that geopolitical-event-based rallies don’t last and very likely to be reversed.
These two key drivers are:
- real interest rates
- the USD Index
The USD Index is already soaring, and real interest rates are likely to increase as the nominal interest rates are about to increase – and given the recent rally in prices they might increase more than most investors expect them to.
Consequently, while – given today’s rally – it might seem like there’s no stopping gold, silver, and mining stocks, please keep the above in mind. This rally is likely to be reversed, and when it reverses, junior gold miners are likely to decline in an epic manner. And lead to epic profits in case of those, who were able not to follow the mania during the parabolic upswing.
The above remains up-to-date.
Let’s check what changed on the charts based on yesterday’s profound decline.
When I wrote yesterday’s analysis, gold was trading at about $2,020, and I wrote that, given the last few days’ volatility, it could be below $2,000 in a few hours. That’s exactly what happened next.
Taking a step back, please note that the previous breakouts above $2,000 were all invalidated sooner rather than later.
Gold tried to break above $2,000 several times:
- twice in August 2020;
- twice in September 2020 (once moving above it, once moving just near this level);
- once in November 2020 (moving near this level);
- once in January 2021 (moving near this level);
- once in February 2022 (moving near this level).
These attempts failed in each of the 7 cases mentioned above.
Yesterday, gold failed its eighth attempt. History rhymed, as it often does. Let’s keep in mind the specific similarity to the 2020 top that I described yesterday:
Gold topped at a similar price to its 2020 top, while the sharpest part of the rally started at about $1,800 (just like in 2020), and the entire rally started in the middle of the year at about $1,670.
In fact, even the moment where gold traded on huge volume for the first time during those rallies is similar. I marked that with blue dotted lines. We saw huge volume more or less in the middle of the final (sharpest) part of the upswing. The history tends to rhyme, and since it seems that the tensions have finally peaked (as I wrote in the opening part of today’s analysis) the same is quite likely for the gold price.
Gold’s big-volume reversal on Tuesday added to the decline’s credibility, making its continuation likely.
The dramatic sell signal was even clearer in the case of mining stocks; and yesterday’s invalidations of breakouts are just as telling.
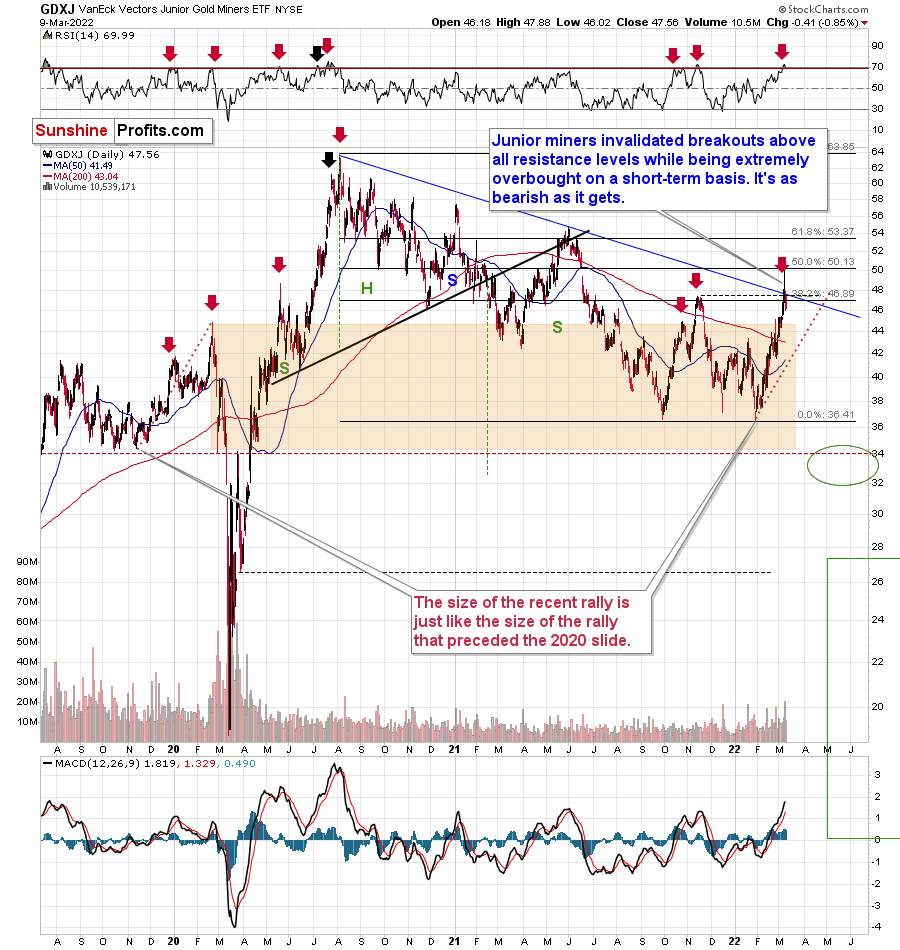
Yesterday, I commented on miners’ reversal in the following way:
While the junior miners (GDXJ ETF) closed higher yesterday, they were up only slightly. At one point of the session, the GDXJ was up from its previous close by 5.74%. However, it ended only 0.86% higher. Therefore, almost the entire daily rally in junior miners was invalidated.
Yesterday’s session was therefore a profound daily reversal – in candlestick pattern terms, it was a “shooting star reversal”. These patterns should be confirmed by high volume, and yesterday’s volume in the GDXJ was the highest volume not only this year, but it was actually highest volume that we’ve seen in this ETF since mid-2020. The top is most likely in.
If I didn’t have my short position in the GDXJ ETF that’s already significant (and in tune with how significant I want it to be), I would have entered or added to this position now.
(Of course, the above is not an investment advice, nor am I saying that should increase your position, but that’s exactly what my opinion is at the moment based on what we just saw.)
The above bearish signal turned into an extremely bearish one because of GDXJ’s invalidations of previous (small, but still) breakouts. Junior miners just closed visibly below their:
- 38.2% Fibonacci retracement level;
- declining (blue) resistance line;
- late-2021 top.
Invalidations of breakouts are bearish as they show that a given market’s strength was not real and that sellers were able to overwhelm the buyers.
While mining stocks underperformed gold in a rather extreme manner on Tuesday, silver outperformed it on the same day. This was a bearish indication, and indeed, it was followed by lower prices.
On Tuesday, the GDXJ ETF was up by less than 1%, gold was up by 2.37%, and silver was up by 4.57%. Silver’s outperformance and miners’ underperformance is what we tend to see right at the tops. That’s exactly what it was – a top. Silver declined profoundly, and the attempt to break above its 61.8% Fibonacci retracement level will soon be just a distant (in terms of price) memory.
On a medium-term basis, silver was simply weak relative to gold, but we saw short-term outperformance. In short, that was and continues to be bearish.
How high could silver go before declining? Given all that I wrote above, I think that silver’s top is already in. However, if it isn’t, I don’t think it would manage to move above $30.
All in all, it seems that due to the technical resistance in gold and mining stocks, the sizable – but likely temporary (like other geopolitical-event-based ones) – rally is likely to be reversed shortly. Then, as the situation in the general stock market deteriorates, junior miners will likely plunge in a spectacular manner.
Thank you for reading our free analysis today. Please note that the above is just a small fraction of the full analyses that our subscribers enjoy on a regular basis. They include multiple premium details such as the interim targets for gold and mining stocks that could be reached in the next few weeks. We invite you to subscribe now and read today’s issue right away.
Sincerely,
Przemyslaw Radomski, CFA
Founder, Editor-in-chief


Gold Investment News
Delivered To Your Inbox
Free Of Charge
Bonus: A week of free access to Gold & Silver StockPickers.
Gold Alerts
More-
Status
New 2024 Lows in Miners, New Highs in The USD Index
January 17, 2024, 12:19 PM -
Status
Soaring USD is SO Unsurprising – And SO Full of Implications
January 16, 2024, 8:40 AM -
Status
Rare Opportunity in Rare Earth Minerals?
January 15, 2024, 2:06 PM

