
tools spotlight

-
Will Higher Interest Rates Shake the Gold Market?
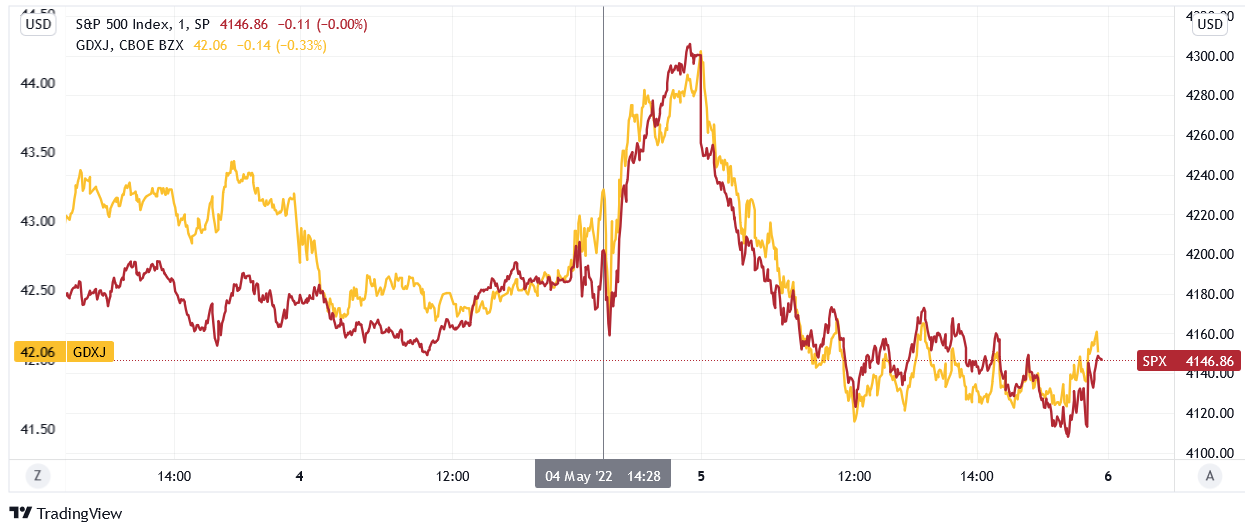
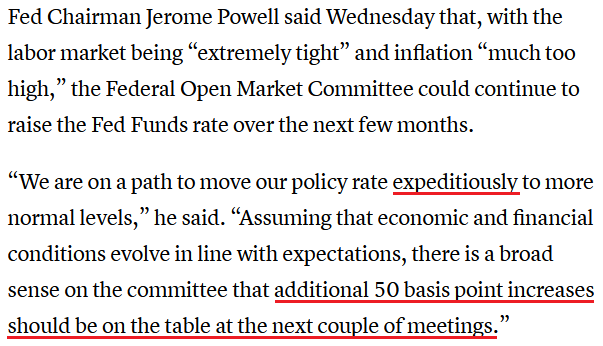
May 6, 2022, 10:08 AMWith the Fed the focus of investors’ attention this week, the central bank raised interest rates by 50 basis points. However, while market participants initially put on brave faces, optimism turned to pessimism as reality re-emerged. To explain, I wrote on May 5:
With investors hitching their wagons to the Fed’s horse on May 4, they still believe that Chairman Jerome Powell can accomplish the impossible. Therefore, it’s all about following the man who will lead you to prosperity.
To explain, the red line above tracks the one-minute movement of the S&P 500, while the gold line above tracks the one-minute movement of the GDXJ ETF. If you analyze the relationship, you can see that both sunk at the outset of Powell’s presser and then rallied into the close. As a result, a little bullish sentiment combined with some short-covering were the perfect ingredients for a sharp daily rally.
However, not only did the pair’s medium-term fundamentals not follow suit, they actually worsened. Therefore, while sentiment rules the day in the short term, their medium-term outlooks couldn’t be more treacherous.
Well, with investors’ panic attack turning the medium-term into one day, the S&P 500 and the GDXJ ETF gave back all of their misguided gains and then some.
Please see below:
However, the medium-term outlook remains unchanged and what I wrote on Apr. 27 still stands: while investors will likely remain in ‘buy the dip’ mode until the very end, lower highs and lower lows should confront the S&P 500 and the PMs over the next few months.
Remember, investors are always looking for the bottom. They speculate, hoping that every morsel of bullish news will turn the tide. On May 4, that optimism was underwritten by the relief that the Fed didn’t hike rates by 75 basis points.
However, it’s not about how much the Fed hikes at a given meeting; it’s about how long the rate hike cycle lasts and whether or not the Fed turns dovish. Therefore, with officials stuck between a rock (growth) and a hard place (inflation), bad news should continue to hammer the financial markets for the foreseeable future.
To explain, when analyzing Chairman Jerome Powell’s prediction of a soft landing, I wrote that this statement should go down as one of the most important quotes of 2022:
“I do expect that this will be very challenging; it’s not going to be easy; and it may well depend on events that are not in our control. But our job is to use our tools to try to achieve that outcome, and that’s what we’re going to do.”
As such, with Powell noting that a soft landing "may well depend on events that are not in our control," he's essentially telling you that the Fed is past the point of managing this outbreak. In reality, inflation is like cancer. Once it spreads, it reaches a point where too much damage has been done to save the patient.
Thus, this is where we are now. With the Fed's "blunt tools" poised to inflict serious damage on the U.S. economy, the undesirable trade-off of supporting growth versus curbing inflation has the Fed in a material bind. As a result, investors severely underestimate the challenges that will confront them over the next several months.
Therefore, what should Powell do? On the one hand, he could hammer home rate hikes, kill demand, eviscerate inflation, and push the U.S. economy into recession. On the other hand, he could stop hiking, support growth and let inflation rage.
However, investors don’t realize that both roads lead to the same destination. If Powell is serious about fighting inflation, the end result is pretty clear. If he performs a dovish 180, the S&P 500 and the PMs could bask in the short-term glory. Yet, the medium-term implications are even more bearish (for the stock market) if the second scenario unfolds.
Letting inflation rage will cripple long-term economic growth and push the U.S. economy into an even deeper recession (with a lag) than if Powell hikes the federal funds rate to 3.5%. As a result, investors don’t understand that what they cheered for on May 4 (the hope of a dovish Fed) will actually lead to the worst possible long-term outcome. Thus, whether it’s one day, one week, or one month of bullish optimism, the ghost of stimulus past should haunt investors for much of 2022.
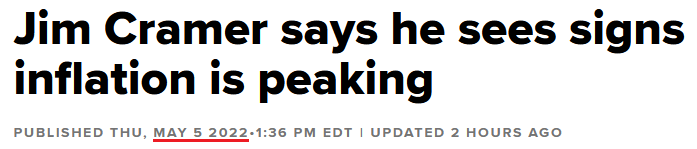
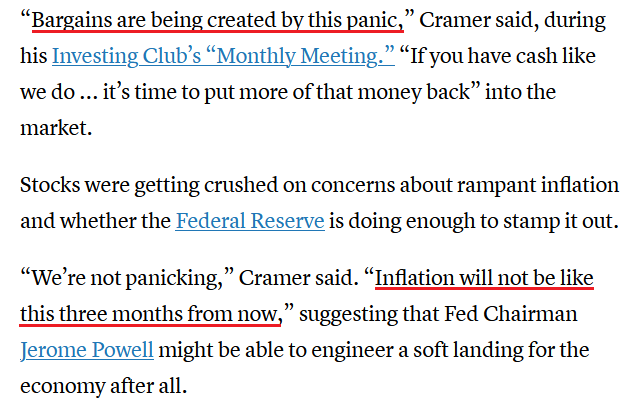
To that point, there is a third scenario; and with the bulls desperately searching for a medium-term catalyst, the new narrative from CNBC’s oracle looks like this:
 Source: CNBC
He said:
 Source: CNBC
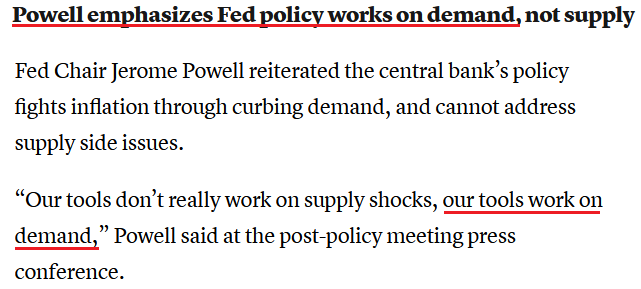
Therefore, when inflation is too high to expect a dovish pivot and the Fed’s “blunt tools” are too harsh to avoid collateral damage, the only bullish narrative left is to predict that inflation will subside on its own. However, while I’ve been warning since 2021 that the concept is laughable, desperate times call for desperate measures. Furthermore, even if inflation peaks on a year-over-year (YoY) basis, it’s still increasing month-over-month (MoM). As such, “the fool wonders; the wise man asks.”
So, let’s dig a little deeper than Cramer. On May 5, the U.S. Bureau of Labor Statistics (BLS) released its nonfarm business sector labor productivity report. An excerpt read:
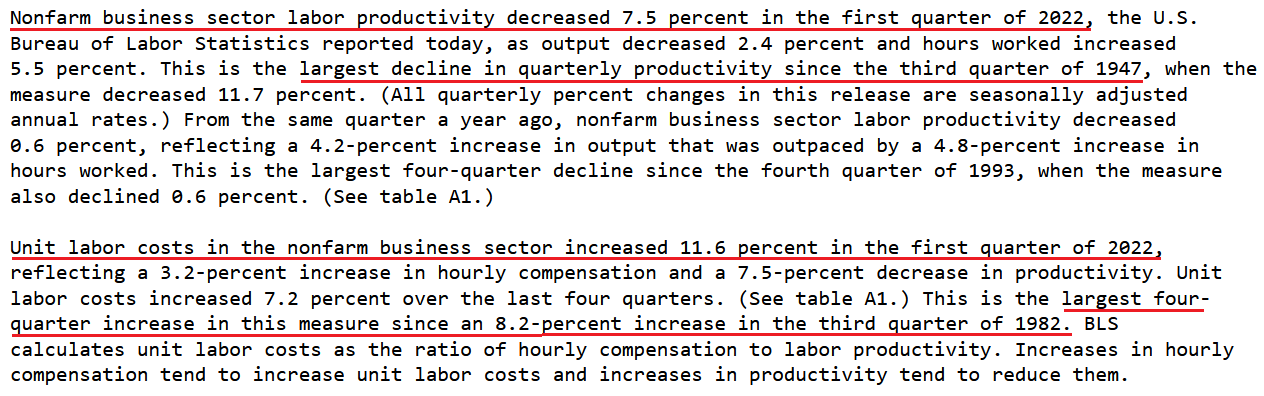 Source: BLS
Now, this is lagged data, so the future implications are less relevant than PMIs or business surveys. However, the results are still profound. For example, labor productivity measures output produced per hour. When productivity increases, employees produce more goods in the same amount of time, or the same amount of goods in less time. In a nutshell: they are more ‘productive.’
However, the important point is that productivity offsets wage inflation. When productivity increases, the number of goods one person creates increases, and even if that individual receives a wage increase, the labor cost per unit can remain constant or decline. As such, the company doesn’t need to pass the wage increase on to the consumer.
With productivity declining by 7.5% in Q1, U.S. employees are producing fewer goods in the same amount of time, or the same amount of goods in more time. As a result, unit labor costs have increased materially, which is extremely inflationary.
Second, the CNBC article stated: “Cramer said rising mortgage rates should cool the housing market,” and therefore, help reduce inflation. Now, I agree with the long-term implications of his thinking.
However, his uninformed analysis assumes that housing prices are reflected in the Consumer Price Index (CPI). In reality, shelter (rent inflation+) accounts for more than 30% of the headline CPI’s movement. Therefore, higher mortgage rates won’t impact rent inflation until several months down the road.
Case in point: Apartment List released its National Rent Report on Apr. 27. An excerpt read:
“Rent growth is continuing to pick up steam again, after a brief winter cooldown, with our national index up by 0.9 percent over the course of April. So far this year, rents are growing more slowly than they did in 2021, but faster than the growth we observed in the years immediately preceding the pandemic.”
Please see below:
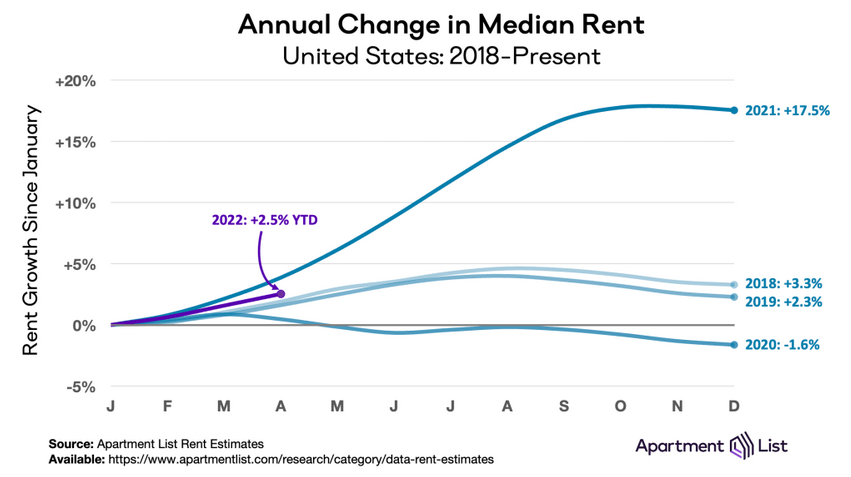
Furthermore, please consider that with median rents up by 2.5% YoY in four months, that annualizes to nearly 7.7% YoY for 2022. Likewise, a continuation of the current trend would result in 2022 YoY median rent inflation that’s 2.3x 2018 and 3.3x 2019’s figures. In addition, the spring and summer months are when peak pricing occurs. As a result, the data is extremely bullish for Fed policy.
The report added:
“In December 2021, rents fell in 61 of the nation’s 100 largest cities, the only month last year in which more than half of these cities saw a decline. This month, however, rents were up in 93 of the nation’s 100 largest cities (…).”
“As we enter the spring and summer months, rental activity is likely to pick up, and rent growth is likely to accelerate. Despite a recent cool-down, many American renters are likely to remain burdened throughout 2022 by historically high housing costs.”
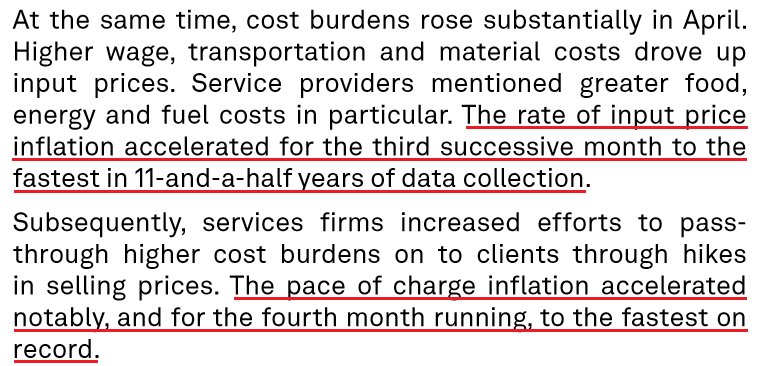
Finally, S&P Global released its U.S. Services PMI on May 4. The report revealed:
“U.S. service providers recorded a steep expansion in business activity during April, according to the latest PMI™ data. The rate of output growth eased to the slowest for three months but was sharp overall…. Demand conditions remained strong and sparked the fastest rise in employment for a year as backlogs mounted at a near-record pace.”
More importantly, though:
 Source: S&P Global
Moreover, the data mirrors the results from S&P Global’s U.S. Manufacturing PMI released on May 2:
 Source: S&P Global
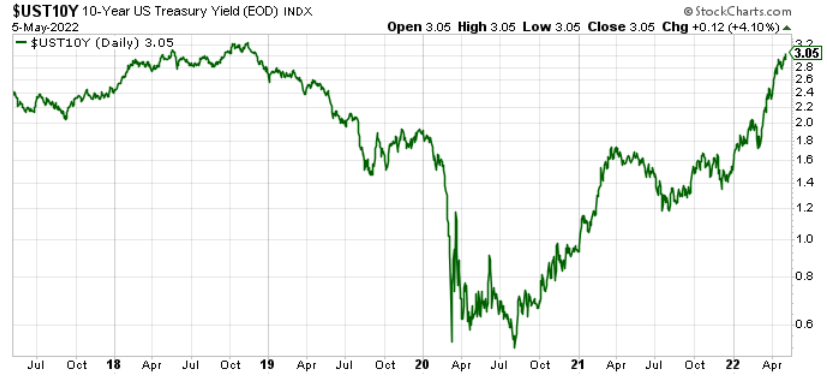
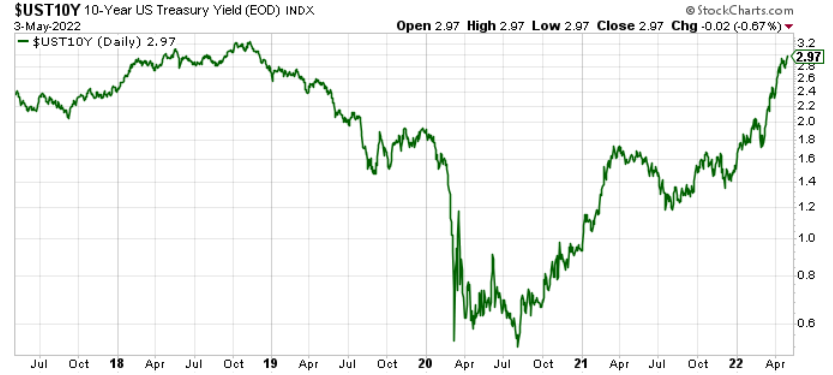
Also noteworthy, I wrote on May 4 that the U.S. 10-Year Treasury yield has continued its ascent, [and] while the Treasury benchmark eclipsed 3% intraday on May 3, a close above the key psychological level should occur sooner rather than later.
Well, sooner has arrived:
The bottom line? While it's surprising how CNBC personalities will say things without doing their homework, the Fed's reality check still has room to run. Moreover, I warned on Mar. 28 that investors' confidence would eventually cower. I wrote:
The PMs and the general stock market remain in la-la land. Despite repeated warnings from Fed officials and a rout in the bond market, both asset classes continue to ignore the potential ramifications. However, with the medium term likely to elicit a profound shift in sentiment, the Fed’s war on inflation should send shockwaves across the financial markets.
As a result, while investors slowly realize the implications of the Fed’s catch-22, plenty of downside is needed before the medium-term effects are accurately priced in.
In conclusion, the PMs were mixed on May 5, as mining stocks suffered the brunt of the damage. However, with the Fed on a hawkish warpath and the medium-term outlooks bullish for the USD Index and real yields, the PMs should confront more selling pressure before long-term buying opportunities emerge. Please note that a short-term buying opportunity may present itself if certain technical developments materialize in the coming days.
What to Watch for Next Week
With more U.S. economic data releases next week, the most important are as follows:
- May 9: The Conference Board Employment Trends Index (ETI)
With employment making up one-half of the Fed’s dual mandate, continued strength in the U.S. labor market could add more fuel to the hawkish fire.
- May 10: NFIB Small Business Optimism Index
With small businesses having a material impact on U.S. employment and inflation, it will be interesting to see if employers continue to increase staff and raise prices.
- May 11: Consumer Price Index (CPI)
Although it’s lagged data, outperformance and underperformance often move markets. As a result, the CPI will likely be the most watched data point next week.
- May 12: Producer Price Index (PPI)
With the PPI often leading the CPI, the former is an important component of the inflation story.
- May 13: University of Michigan Consumer Sentiment Index
With consumers dealing with rising mortgage rates and unrelenting inflation, it will be interesting to see how sentiment is holding up.
All in all, economic data releases impact the PMs because they impact monetary policy. Moreover, if we continue to see higher employment and inflation, the Fed should keep its foot on the hawkish accelerator. If that occurs, the outcome is profoundly bearish for the PMs.
Thank you for reading our free analysis today. Please note that the above is just a small fraction of the full analyses that our subscribers enjoy on a regular basis. They include multiple premium details such as the interim targets for gold and mining stocks that could be reached in the next few weeks. We invite you to subscribe now and read today’s issue right away.
Sincerely,
Przemyslaw Radomski, CFA
Founder, Editor-in-chief -
Is It Worth Going Through Fire and Water for the Central Bank?
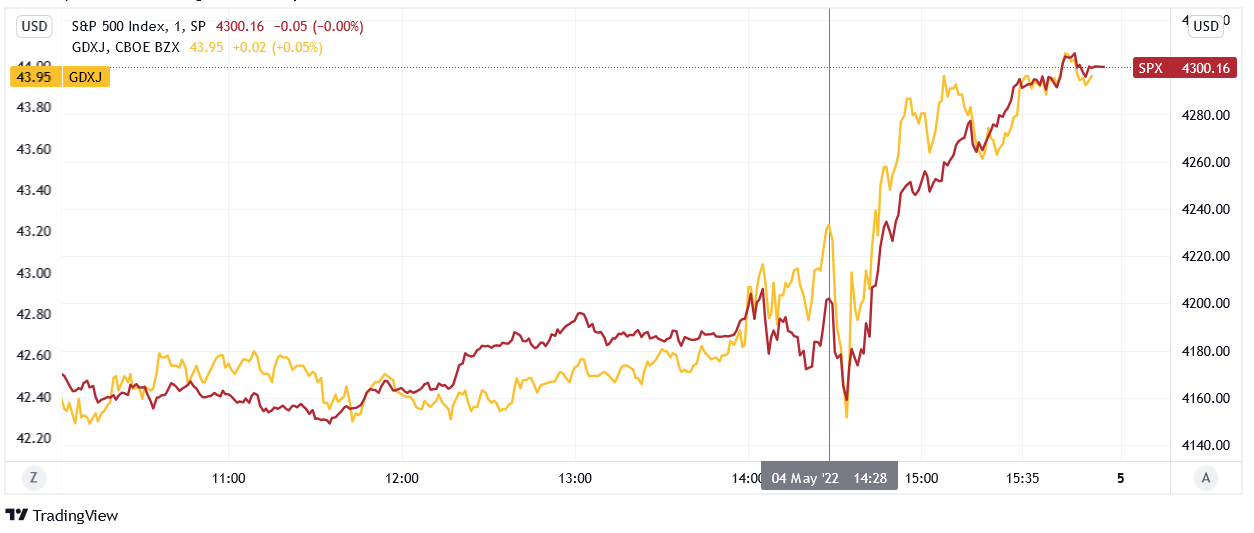
May 5, 2022, 9:03 AMWith investors hitching their wagons to the Fed’s horse on May 4, they still believe that Chairman Jerome Powell can accomplish the impossible. Therefore, it’s all about following the man who will lead you to prosperity. However, while market participants’ faith in the Fed is profoundly short-sighted, I noted on Apr. 27 that pledging allegiance is how investors operate. I wrote:
“The PMs were mixed on Apr. 26, as mining stocks continued their material underperformance. Moreover, while investors will likely remain in ‘buy the dip’ mode until the very end, lower highs and lower lows should confront the S&P 500 and gold over the next few months. As a result, the medium-term outlook for the GDXJ ETF is profoundly bearish.”
Thus, while hope is not a strategy, it was clearly a popular opinion on May 4.
Please see below:
To explain, the red line above tracks the one-minute movement of the S&P 500, while the gold line above tracks the one-minute movement of the GDXJ ETF. If you analyze the relationship, you can see that both sank at the outset of Powell’s presser and then rallied into the close. As a result, a little bullish sentiment combined with some short-covering were the perfect ingredients for a sharp daily rally.
However, not only did the pair’s medium-term fundamentals not follow suit, they actually worsened. Therefore, while sentiment rules the day in the short term, their medium-term outlooks couldn’t be more treacherous.
To explain, the FOMC hiked interest rates by 50 basis points on May 4. Moreover, like I have been warning throughout the technical sections of the daily Gold & Silver Trading Alerts, we witnessed a ‘sell the rumor, buy the fact’ event. However, with the Fed increasingly hawked up, investors’ misguided optimism should evaporate over the next few months. An excerpt from the FOMC statement read:
“The Committee seeks to achieve maximum employment and inflation at the rate of 2 percent over the longer run. With appropriate firming in the stance of monetary policy, the Committee expects inflation to return to its 2 percent objective and the labor market to remain strong.”
“In support of these goals, the Committee decided to raise the target range for the federal funds rate to 3/4 to 1 percent and anticipates that ongoing increases in the target range will be appropriate. In addition, the Committee decided to begin reducing its holdings of Treasury securities and agency debt and agency mortgage-backed securities on June 1.”
As a result, while investors hear what they want to hear, the reality is that hawkish fireworks should light up the financial markets this summer.
Please see below:
 Source: CNBC
In addition, Powell said: “We have both the tools we need and the resolve it will take to restore price stability on behalf of American families and businesses.”
What are these “tools” he speaks of?
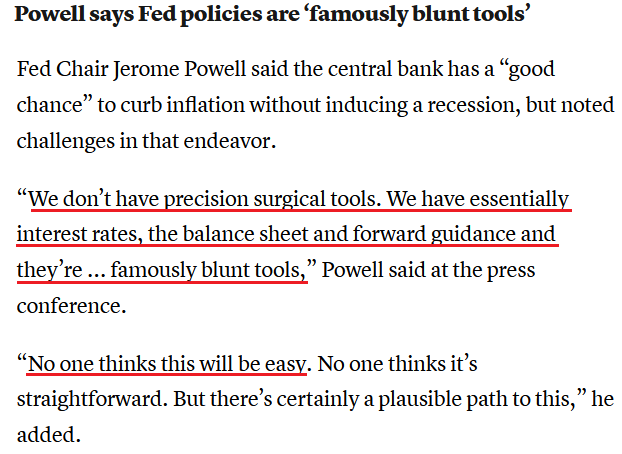 Source: CNBC
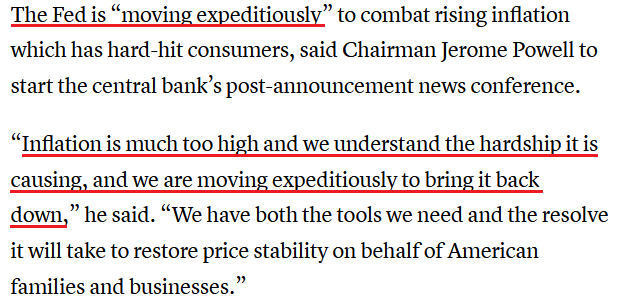
Thus, with Powell admitting that “blunt tools” are the only mechanism to curb inflation, the Fed’s pathway to lower prices should result in plenty of collateral damage. As a result, while the price action on May 4 suggests that normalization will be easy, the sentiment shift should be profound when reality sets in. To that point, I wrote on Apr. 6:
Please remember that the Fed needs to slow the U.S. economy to calm inflation, and rising asset prices are mutually exclusive to this goal. Therefore, officials should keep hammering the financial markets until investors finally get the message.
Moreover, with the Fed in inflation-fighting mode and reformed doves warning that the U.S. economy “could teeter” as the drama unfolds, the reality is that there is no easy solution to the Fed’s problem. To calm inflation, it has to kill demand. And as that occurs, investors should suffer a severe crisis of confidence.
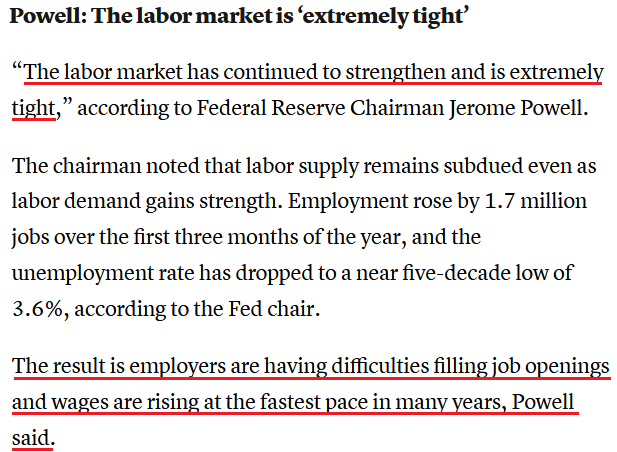
Furthermore, Powell made the point for me on May 4:
 Source: CNBC
Also noteworthy, when asked about curbing inflation without impairing the U.S. economy, Powell responded: “I would say I think we have a good chance to have a soft or softish landing, or outcome if you will. It doesn’t seem to be anywhere close to a downturn. The economy is strong and is well-positioned to handle tighter monetary policy.”
For context, referencing a “softish landing” completely lacks confidence, but it’s Powell’s way of recognizing reality without spooking the financial markets. Moreover, as one of the most important quotes of the press conference, he added:
“I do expect that this will be very challenging; it’s not going to be easy; and it may well depend on events that are not in our control. But our job is to use our tools to try to achieve that outcome, and that’s what we’re going to do.”
As such, with Powell noting that a soft landing "may well depend on events that are not in [their] control," he's essentially telling you that the Fed is past the point of managing this outbreak. In reality, inflation is like cancer. Once it spreads, it reaches a point where too much damage has been done to save the patient.
Thus, this is where we are now. With the Fed's "blunt tools" poised to inflict serious damage on the U.S. economy, the undesirable trade-off of supporting growth versus curbing inflation has the Fed in a material bind. As a result, investors severely underestimate the challenges that will confront them over the next several months.
To that point, remember what I wrote on Apr. 26?
The Federal National Mortgage Association (Fannie Mae) – a U.S. government-sponsored enterprise – released its Economic and Housing Outlook report on Apr. 19. An excerpt read:
“Our updated forecast includes an expectation of a modest recession in the latter half of 2023 (…).”
“While a ‘soft landing’ for the economy is possible, which is where inflation subsides without economic contraction, historically such an outcome is an exception, not the norm. With the most recent inflation readings at levels not seen since the early 1980s and wage growth exceeding that which is consistent with a 2-percent inflation objective, we believe the odds of a soft landing are even lower.”
Please see below:
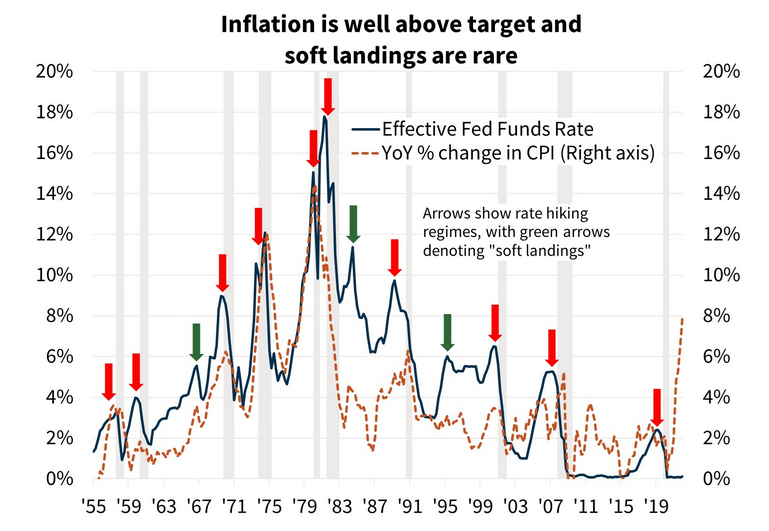 Source: Fannie Mae
To explain, the green line above tracks the U.S. federal funds rate, while the dashed brown line above tracks the YoY percentage change in the headline Consumer Price Index (CPI). More importantly, the red arrows above depict hard landings, while the green arrows above depict soft landings. As such, the odds are not in the Fed’s favor.
Even more revealing, if you analyze the green arrows near 67, 83, and 95, you can see that the YoY inflation (the dotted brown line) was no more than ~4.5%. As a result, all of the soft landings occurred alongside manageable inflation, not a headline CPI at 8.6%.
Won’t Go Down Without a Fight
Therefore, while history highlights the Fed’s ineptness at handling crises, history also highlights how investors follow the central bank off the cliff. Moreover, while Powell can convince the consensus that “a soft or softish landing” should materialize, please remember that “the fool wonders, the wise man asks.”
To explain, remember what I wrote on Nov. 4 following the FOMC meeting?
With Fed Chairman Jerome Powell still searching for his inflationary shooting star, the FOMC chief isn’t ready to label inflation as problematic. “I don’t think that we’re behind the curve,” he said. “I actually believe that policy is well-positioned to address the range of plausible outcomes, and that’s what we need to do.”
And now?
 Source: CNBC
Likewise, remember what he said about the U.S. labor market and wage inflation? I wrote on Nov. 4:
The reality is: while Powell has taken the path of least resistance to help calm inflation (the taper), his inability to understand the realities on the ground leaves plenty of room for hawkish shifts in the coming months (interest rate hikes).
For example, Powell said during his press conference that “the inflation that we’re seeing is really not due to a tight labor market. It’s due to bottlenecks and it’s due to shortages and it’s due to very strong demand meeting those (…). We don’t see troubling increases in wages, and we don’t expect those to emerge.”
And now?
 Source: CNBC
As such, investors are either unaware of how wrong Powell has been, or they simply don't care. However, the comments in italics were made only six months ago. Either way, Fed officials' inability to see the forest through the trees should have drastic implications over the next several months. As evidence, when the "transitory" camp was brimming with confidence, I wrote on Apr. 30, 2021:
With Powell changing his tune from not seeing any “unwelcome” inflation on Jan. 14 to “we are likely to see upward pressure on prices, but [it] will be temporary” on Apr. 28, can you guess where this story is headed next?
Thus, the situation is unchanged. With Powell predicting that the impossible is achievable, his assertion of “a soft or softish landing” is laughable. Therefore, can you guess where this story is headed next?
Finally, it’s important to distinguish between where we are now and where we are likely headed. Regarding the latter, the “soft landing” crowd will likely be the 2023 version of the “transitory” crowd from 2021/2022. Regarding the former, the U.S. economy remains on solid footing RIGHT NOW. However, the dynamic only adds further fuel to the hawkish fire.
For example, Statistics Canada released its latest international merchandise trade update on May. 4. Now, the data is important because more than 77% of Canadian exports were sent to the U.S. in March. Therefore, the two economies are increasingly intertwined.
To that point, with exports to the U.S. hitting an all-time high of CA $49.234 billion, the data highlights how demand conditions in the U.S. remain resilient. As a result, the Fed’s “blunt tools” still have plenty of work to do.
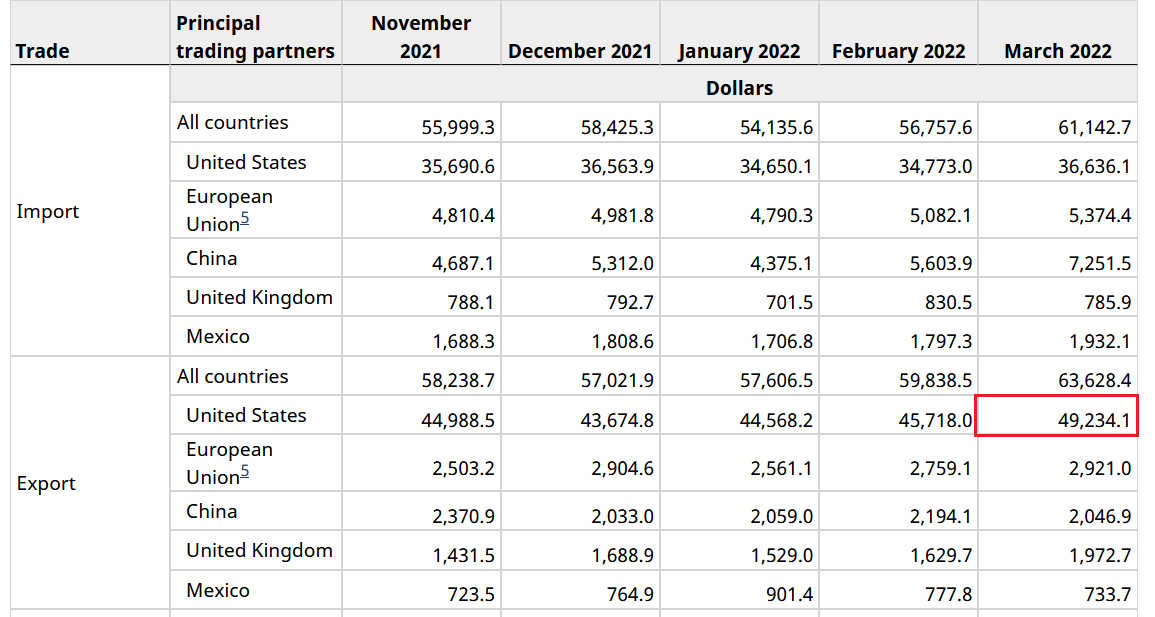 Source: Statcan
The bottom line? It’s interesting how investors can repeat the same mistakes over and over again. Despite being burned by the Fed during the dot-com bubble and the global financial crisis (GFC), investors remain loyal followers. Moreover, even though the central bank’s inflation and labor market forecasts have been way off, investors’ confidence in Powell remains unwavering. As a result, while ‘fool me twice’ should have been enough, a third rendition will likely emerge over the medium term.
In conclusion, the PMs were mixed on May 4, as gold and silver didn’t participate in the bullish stampede. However, with investors severely underestimating the impact of seven to 12 rate hikes over nine months, the liquidity drain should materially depress the performances of the PMs and the S&P 500 as the drama unfolds.
Thank you for reading our free analysis today. Please note that the above is just a small fraction of the full analyses that our subscribers enjoy on a regular basis. They include multiple premium details such as the interim targets for gold and mining stocks that could be reached in the next few weeks. We invite you to subscribe now and read today’s issue right away.
Sincerely,
Przemyslaw Radomski, CFA
Founder, Editor-in-chief -
Brace, Gold Bulls - The Fed Is Going to Keep Its Hawkish Word
May 4, 2022, 9:21 AMWith the US economy still on fire and inflation galloping, the Fed has to react firmly. What will happen to gold after the dovish stance changes?
It’s a decision day for the Fed, as a 50 basis point rate hike is likely a done deal. Moreover, while the PMs may record a short-term relief rally, their medium-term fundamentals continue to deteriorate.
For example, I’ve been warning for some time that higher interest rates would manifest amid rampant inflation, and – surprise, surprise – the U.S. 10-Year Treasury yield has continued its ascent. Furthermore, while the Treasury benchmark eclipsed 3% intraday on May 3, a close above the key psychological level should occur sooner rather than later.
Please see below:
To explain why, I wrote on Apr. 20:
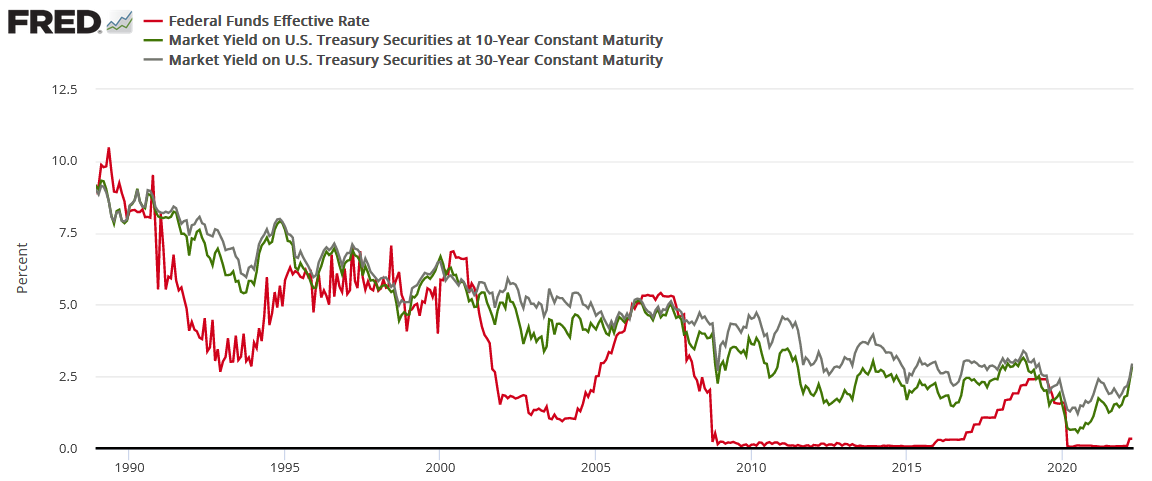
The red line above tracks the U.S. federal funds rate, while the green and gray lines above track the U.S. 10-Year and 30-Year Treasury yields. If you analyze the connection, you can see that the latter two often take their orders from the former. In a nutshell: when the Fed raises interest rates, it takes several hikes of 0.25% before long-term yields rollover. For example:
- In 2018, the U.S. 10-Year Treasury yield peaked after ~9 rate hikes.
- In 2006, the U.S. 10-Year Treasury yield peaked after ~17 rate hikes.
- In 2000, the U.S. 10-Year Treasury yield peaked after ~7 rate hikes.
- In 1994, the U.S. 10-Year Treasury yield peaked after ~12 rate hikes.
Thus, with modern history showcasing that the U.S. 10-Year Treasury yield doesn't peak until the Fed is well within its rate hike cycle, please remember that the Fed has only hiked once. Therefore, with seven rate hikes as the minimum to elicit a peak over the last ~28 years, the U.S. 10-Year Treasury yield should have room to run, and this is bullish for real yields and bearish for gold.
Speaking of real yields, with nominal interest rates rising and breakeven inflation rates falling, the U.S. 10-Year real yield closed at 0.18% on May 2 and 0.15% on May 3. As a result, the PMs confront a fundamental time bomb that should blow up their performance over the next few months.
Please see below:
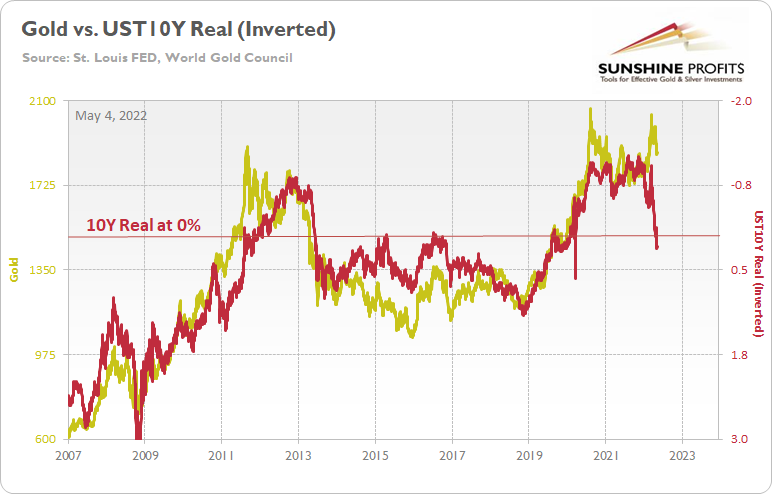
To explain, the gold line above tracks the price tallied by the World Gold Council, while the red line above tracks the inverted U.S. 10-Year real yield. For context, inverted means that the latter's scale is flipped upside down and that a rising red line represents a falling U.S. 10-Year real yield, while a falling red line represents a rising U.S. 10-Year real yield.
For more context, I wrote on Apr. 11:
If you analyze the left side of the chart, you can see that the U.S. 10-Year real yield soared and gold plunged during the global financial crisis (GFC). However, when the Fed launched QE and the U.S. 10-Year real yield sank to an all-time low, gold hit a new all-time high along the way.
Furthermore, the current situation is a spitting image. When Fed Chairman Jerome Powell performed a dovish pivot in late 2018, the U.S. 10-Year real yield suffered. Then, when the Fed fired its liquidity bazooka in March 2020, it pushed the metric to another all-time low. And surprise, surprise, gold hit another all-time high.
However, with the Fed normalizing policy, the U.S. 10-Year real yield has surged in recent weeks. Moreover, the Fed needs to push the metric above 0% to curb inflation.
Thus, it's likely only a matter of time until the milestone is achieved. In addition, a U.S. 10-Year real yield of 0% implies a gold price of $1,500, and while the current narrative suggests otherwise, is this time really different?
To that point, while gold has suffered in recent days, the current price is still well above its medium-trend-based value. Likewise, since the GDXJ ETF is much more volatile than the yellow metal, and therefore, should decline even more, epic drawdowns should materialize if (once) the two lines reconnect (not necessarily in the immediate aftermath of the rate hike, as PMs could rally based on the move-on-the-rumor-reverse-on-the-fact tendency).
For example, while these events take time to unfold, history shows that the “this time is different” crowd ends up losing more than just their pride. I first highlighted the epic divergence between the U.S. 10-Year Treasury yield and the U.S. 10-Year breakeven inflation rate on May 11, 2021. I wrote:
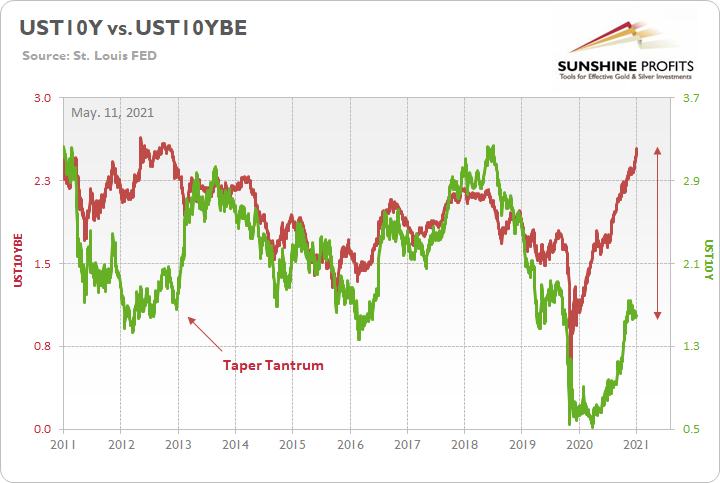
To explain, the green line above tracks the U.S. 10-Year Treasury yield, while the red line above tracks the U.S. 10-Year breakeven inflation rate. If you analyze the left side of the chart, you can see that when the bond market finally snapped in 2013, the U.S. 10-Year Treasury yield’s surge was fast and furious. More importantly, though, if you analyze the right side of the chart, you can see that today’s gap makes 2013 look like an appetizer. As a result, with material divergences often reversing in violent fashion, it’s only a matter of time until the next earthquake erupts.
Therefore, while the fundamental thesis didn’t materialize overnight, the two lines eventually reconnected; the U.S. 10-Year Treasury yield surpassed the U.S. 10-Year breakeven inflation rate, and the U.S. 10-Year real yield turned positive.
However, now it’s the gap between gold and the U.S. 10-Year real yield that makes 2011 look like an appetizer, and the same outcome should occur. As a result, the prospect is profoundly bearish for the PMs.
From Negative to Positive
Conversely, with bonds oversold and the stock market nearing a breaking point, investors continue to ask: “Where is the Fed put?” For context, put options are like insurance contracts, and they protect investors when drawdowns occur. In a nutshell: investors expect the Fed to step in, turn dovish, and save stock market investors from their poor valuation decisions.
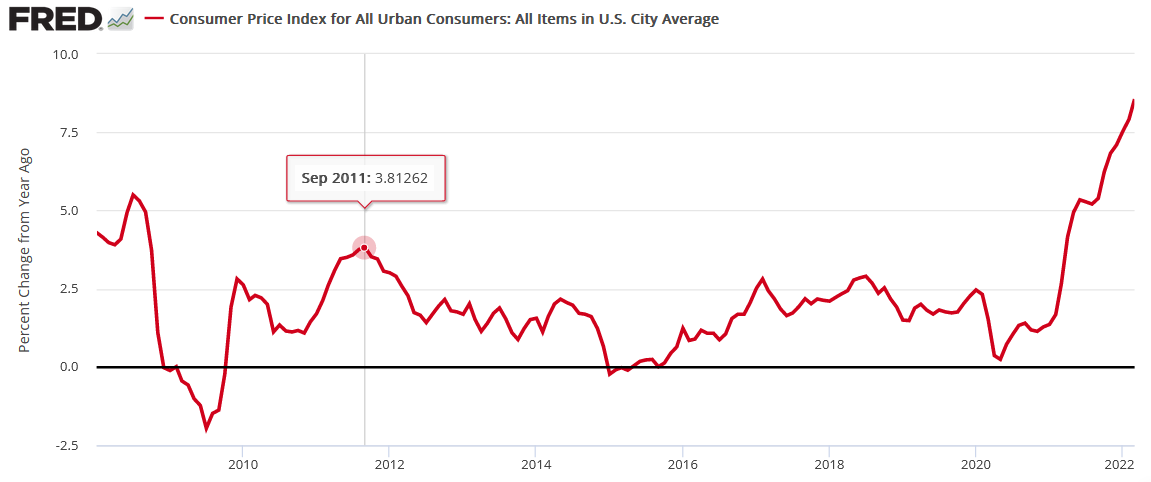
However, the prospect is far-fetched, and here is why. Following the global financial crisis (GFC), the Fed ran to the rescue whenever the stock market threw a tantrum. As such, investors with short memories assume that the post-GFC script is the right analog. Yet, they fail to realize that the year-over-year (YoY) percentage change in the headline Consumer Price Index (CPI) peaked at 3.81% in September 2011. Thus, the Fed could ease without worrying about stoking inflation.
Conversely, with the headline CPI at ~8.6% YoY now, the game has completely changed.
Please see below:
Second, the other half of the Fed’s dual mandate is maximum employment. With U.S. job openings hitting an all-time high of 11.549 million on May 3 (March results), the data is extremely bullish for Fed policy. For context, the consensus estimate was 11 million.
 Source: Investing.com
More importantly, though, another resilient report means that there are now 5.597 million more job openings in the U.S. than citizens unemployed, also an all-time high.
Please see below:
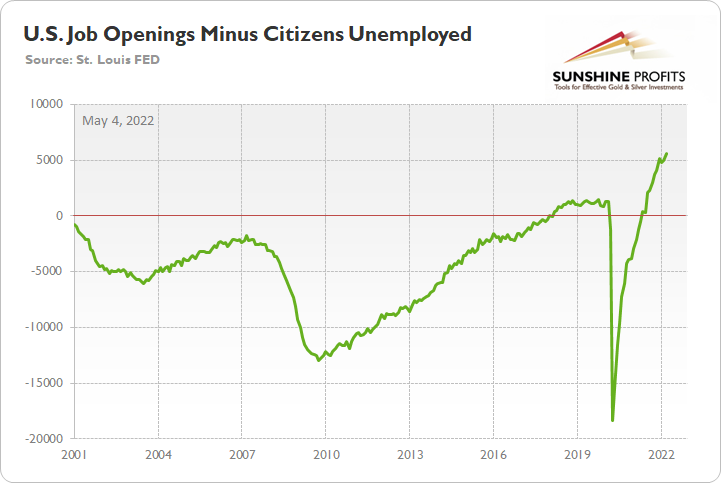
To explain, the green line above subtracts the number of unemployed U.S. citizens from the number of U.S. job openings. If you analyze the right side of the chart, you can see that the epic collapse has completely reversed and the green line is at a record high. Thus, with more jobs available than people looking for work, the economic environment supports normalization by the Fed.
Again, please consider the CPI data above with the job openings spread post-GFC. The period had well-anchored inflation and unemployed citizens outnumbered job openings until 2018. That’s nothing like the current environment. Furthermore, can you notice how the spread’s outperformance helped spur the Fed’s most recent rate hike cycle?
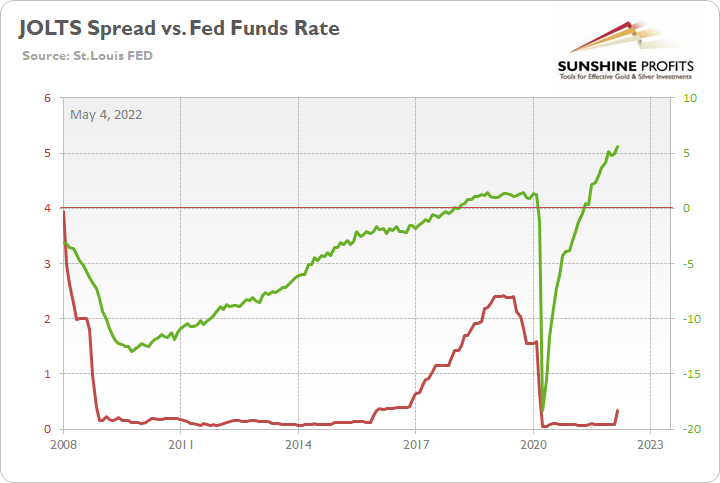
To explain, the green line above tracks the job openings spread, while the red line above tracks the U.S. federal funds rate. If you analyze the relationship, you can see that the spread’s move toward neutral was a hawkish indicator.
Likewise, with the spread positive and at an all-time high, the data alone justifies several rate hikes. However, as mentioned, we also have a YoY headline CPI that’s at its highest level since the 1980s. Thus, if investors assume the Fed lacks the ammunition to follow through with its hawkish promises, they should suffer the same fate as the “transitory” camp did in 2021/2022.
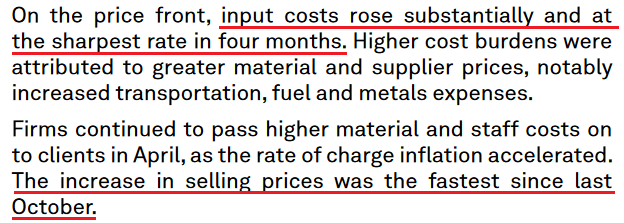
Finally, S&P Global released its U.S. Manufacturing PMI on May 2. The report revealed:
“Operating conditions improved markedly across the U.S. manufacturing sector, according to April PMI data from S&P Global…. New orders increased at a marked pace at the start of the second quarter, and at a rate broadly in line with that seen in March. Companies reported stronger demand conditions, with some noting that new sales expanded despite
substantial rises in prices. Meanwhile, new export orders grew at the fastest rate for
almost a year.”Also noteworthy:
“Manufacturers recorded a solid rise in employment in April. Workforce numbers grew following greater production requirements and in response to staff leaving voluntarily. Some firms also stated that job creation was linked to the filling of long-held vacancies. Labor
shortages continued to be mentioned as a weight on growth, however.”More importantly, though:
Source: S&P GlobalThe bottom line? While investors continue to pray for a dovish pivot, they’re likely in for a rude awakening. The U.S. labor market remains abnormally hot, and the latest PMI data shows that inflation is still accelerating. Moreover, while real yields have turned positive, they have done little to cool a U.S. economy that’s flooded with too much stimulus. As a result, with a hawkish Fed poised to push the U.S. 10-Year real yield even higher over the medium term, the PMs should suffer mightily as the drama unfolds.
In conclusion, the PMs rallied on May 3, as sentiment doesn’t die easily. However, while the technical backdrop could support a short-term rally, the PMs’ medium-term technicals and fundamentals are profoundly bearish. Therefore, investors’ optimism should turn to pessimism over the next few months.
Thank you for reading our free analysis today. Please note that the above is just a small fraction of the full analyses that our subscribers enjoy on a regular basis. They include multiple premium details such as the interim targets for gold and mining stocks that could be reached in the next few weeks. We invite you to subscribe now and read today’s issue right away.
Sincerely,
Przemyslaw Radomski, CFA
Founder, Editor-in-chief -
Precious Metals: We’re Almost There, Let’s Adjust Targets
May 3, 2022, 2:24 AMAvailable to premium subscribers only.
Thank you for reading our free analysis today. Please note that the above is just a small fraction of the full analyses that our subscribers enjoy on a regular basis. They include multiple premium details such as the interim targets for gold and mining stocks that could be reached in the next few weeks. We invite you to subscribe now and read today’s issue right away.
Sincerely,
Przemyslaw Radomski, CFA
Founder, Editor-in-chief -
Gold’s Pause is Over
May 2, 2022, 3:17 AMAvailable to premium subscribers only.
Thank you for reading our free analysis today. Please note that the above is just a small fraction of the full analyses that our subscribers enjoy on a regular basis. They include multiple premium details such as the interim targets for gold and mining stocks that could be reached in the next few weeks. We invite you to subscribe now and read today’s issue right away.
Sincerely,
Przemyslaw Radomski, CFA
Founder, Editor-in-chief


Gold Investment News
Delivered To Your Inbox
Free Of Charge
Bonus: A week of free access to Gold & Silver StockPickers.
Gold Alerts
More-
Status
New 2024 Lows in Miners, New Highs in The USD Index
January 17, 2024, 12:19 PM -
Status
Soaring USD is SO Unsurprising – And SO Full of Implications
January 16, 2024, 8:40 AM -
Status
Rare Opportunity in Rare Earth Minerals?
January 15, 2024, 2:06 PM

