

Briefly: in our opinion, full (300% of the regular position size) speculative short positions in junior mining stocks are justified from the risk/reward point of view at the moment of publishing this Alert.
The back-and-forth movement in both gold and miners continues. However, as GDXJ keeps trading below its rising support line, the breakout below it becomes confirmed, and the movements that we saw at the same time in gold and the USD Index suggest that the former is ready to slide once the latter rallies. Let’s take a closer look, starting with the GDXJ.
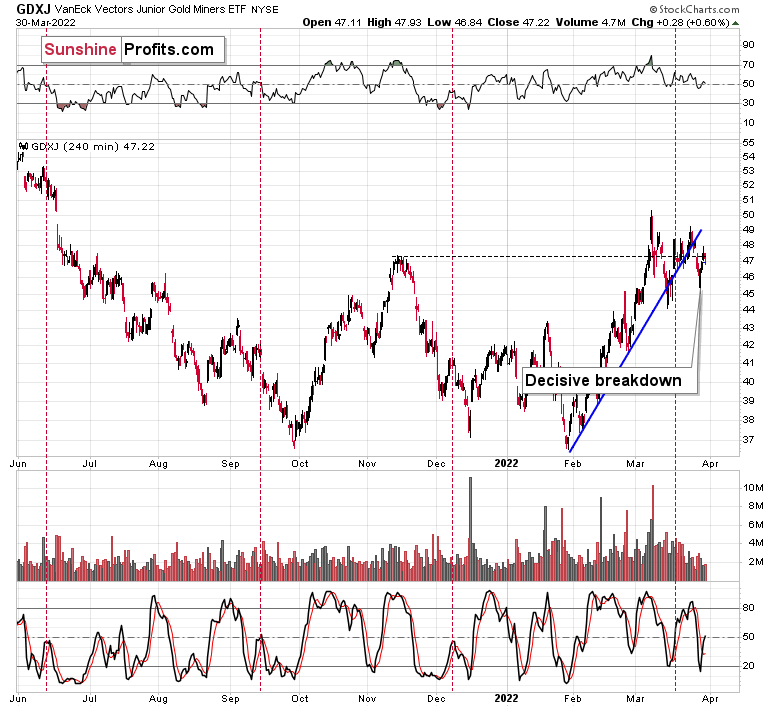
Yesterday’s move in the ETF was rather insignificant, and that’s precisely what makes it… significant.
What I mean is that insignificant moves after a breakdown are a perfect way for the market to take a breather before declining further. In other words, the previous breakdown makes yesterday’s irrelevant price action relevant and bearish.
Consequently, my yesterday’s comments on the above chart remain up-to-date:
Yesterday’s breakdown below the rising support line was not invalidated.
We saw a move higher on volume that was not strong, which suggests that yesterday’s session was not a true reversal. Low volume suggests that it was a correction, and the fact that junior miners have just broken below their rising support line means that it makes perfect sense for them to correct now.
Consequently, yesterday’s action wasn’t really bullish for junior miners when we take the context into account. Speaking of context, let’s not forget about yesterday’s action in the USD Index.
The USD Index declined significantly yesterday, which means that gold, silver, and mining stocks “should have” rallied. After all, based on the USD’s decline, their prices (quoted in USD terms) became lower for non-USD buyers. So, the fact that silver and gold were practically flat yesterday is actually bearish for them, because it means they underperformed. Gold miners moved higher, but given that the USD Index declined visibly and the general stock market rallied, it would be natural for miners to rally more than they did. Taking all this into account, miners were not really strong yesterday.
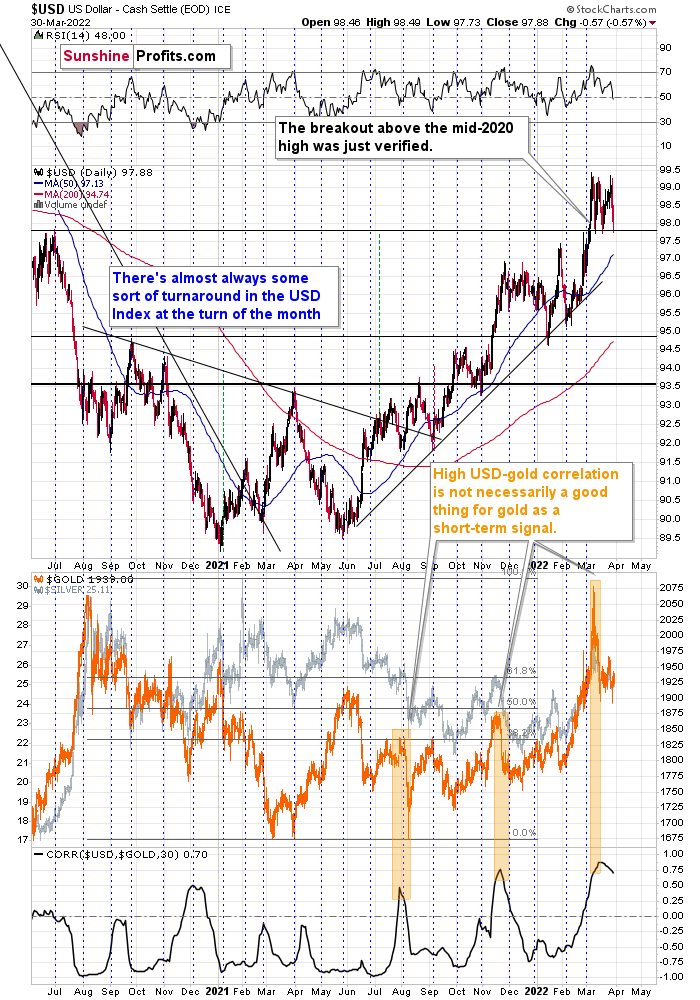
If we focus on the USD Index alone, we’ll see that yesterday’s decline was absolutely inconsequential with regard to changing the outlook for the USDX. It simply continues to consolidate after a breakout above the mid-2020 highs. Breakout + consolidation = increasing chances of rallies’ continuation. A big wave up in the USD Index is likely just around the corner, and the precious metal sector is likely to decline when it materializes.
As the war-based premiums in gold and the USD appear to be waning, a high-interest-rate-driven rally in the USD is likely to trigger declines in gold. The correlation between these two assets has started to decline. When that happened during the last two cases (marked with orange), gold plummeted profoundly shortly thereafter.
What happened after we posted the above?
The USD Index had declined, and gold had rallied (yesterday), and then (today) the USD Index moved back up by just a little while gold declined strongly.
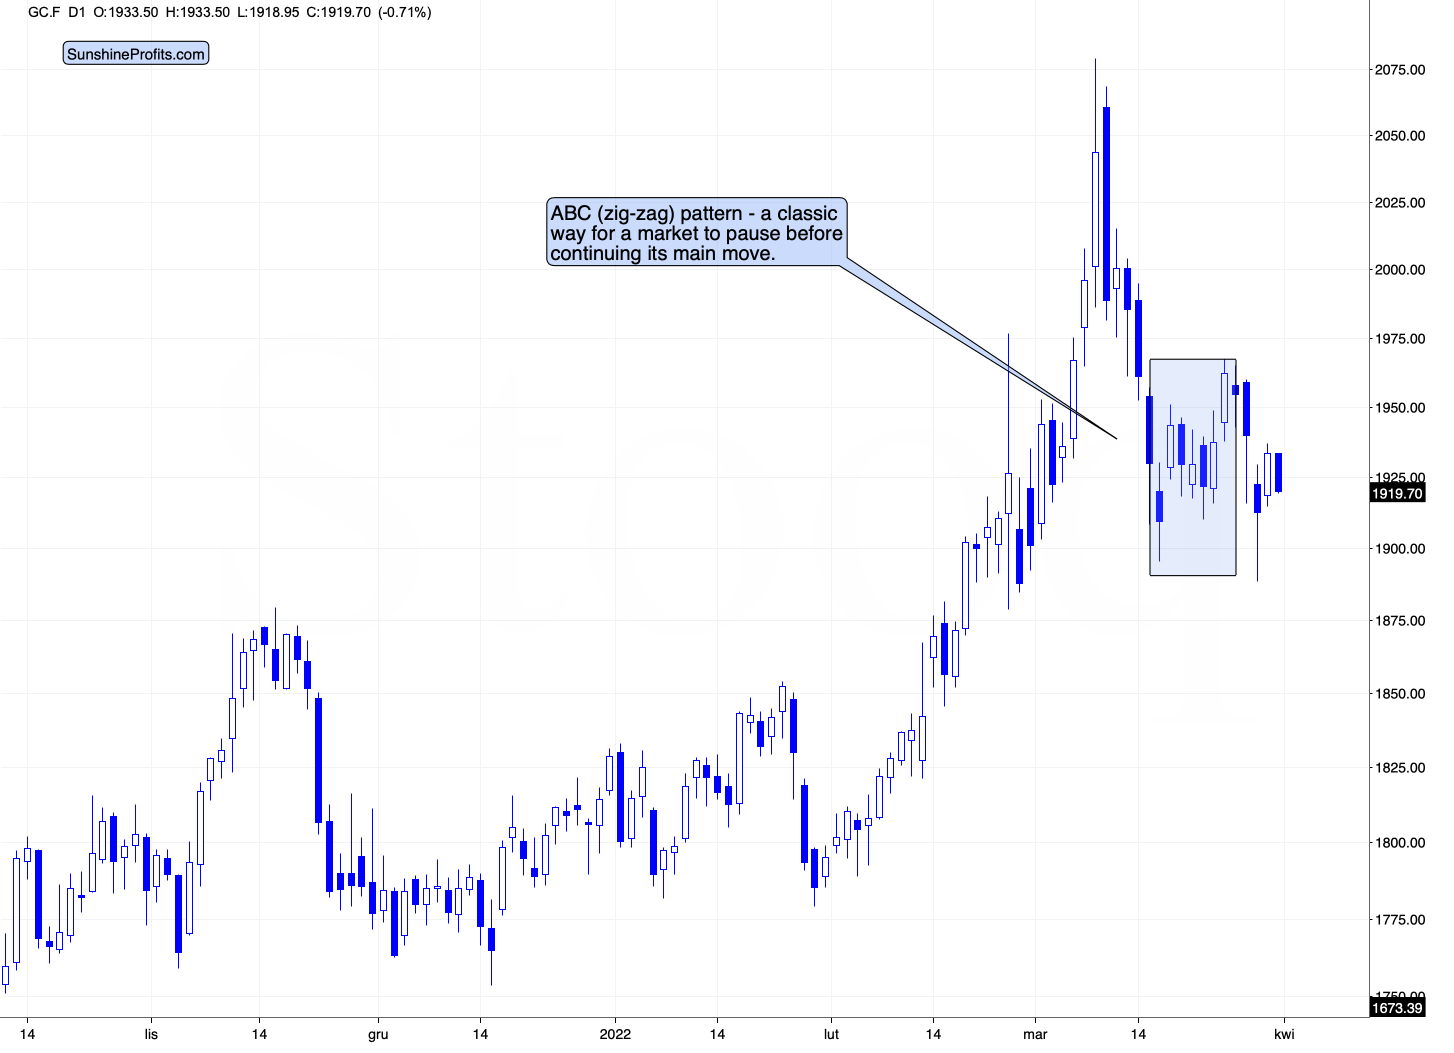
Gold is once again in a situation where it magnifies the USD’s bearish indications while largely ignoring the USD’s bullish indications.
This is a perfectly bearish sign for the short term, because it means that if the USD Index moves back and forth, then gold will most likely continue its downtrend, declining when the USD is up, and pausing when it’s down.
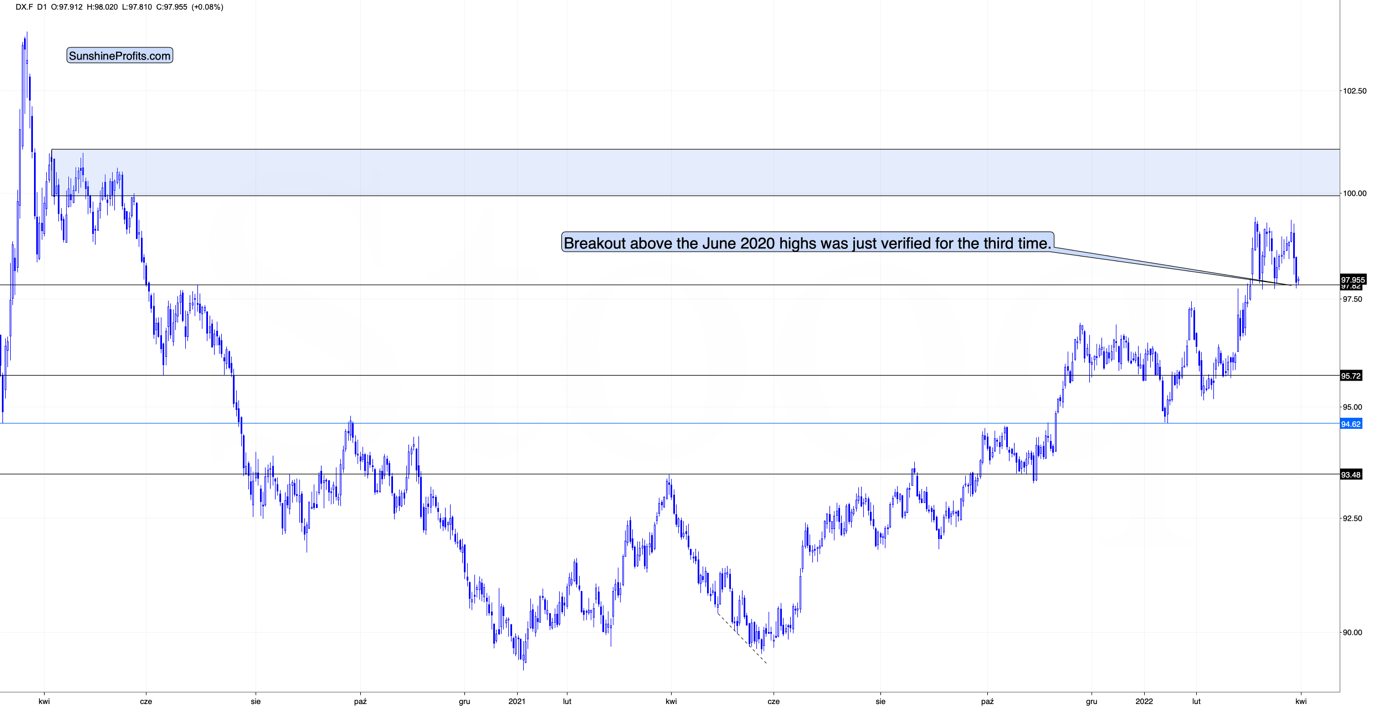
However, the USD Index is not likely to continue to move back and forth for long – quite the opposite. The USD Index has just verified its breakout above the mid-2020 high for the third time (without moving below it; the strong support held!), which means that it’s now very likely that it will simply continue its uptrend.
Based on how gold is now reacting to USDX’s movement, the uptrend in the USD Index would be likely to trigger significant declines in gold. This would be likely to translate into lower silver and mining stock prices.
All in all, technicals favor a decline in the precious metals sector sooner rather than later.
Having said that, let’s take a look at the markets from a more fundamental point of view.
Supply and Demand
With more Russia-Ukraine drama eliciting a bid for WTI, gold reprised its recent role of following crude higher. However, while the headline-driven market remains extremely volatile, the PMs’ domestic fundamental outlooks continue to worsen.
To explain, there is a misnomer in the financial markets that inflation is a supply-side phenomenon. In a nutshell: COVID-19 restrictions, labor shortages, and manufacturing disruptions are the reasons for inflation’s reign. As such, when these issues are no longer present, inflation will normalize and the U.S. economy will enjoy a “soft landing.”
However, investors’ faith in the narrative will likely lead to plenty of pain over the medium term. For example, I’ve noted for some time that the U.S. economy remains in a healthy position. With U.S. consumers flush with cash and a red hot labor market helping to bloat their wallets, their propensity to spend keeps economic data elevated. Likewise, while most investors assumed that consumer spending and inflation would fall off a cliff when enhanced unemployment benefits ended in September, the reality is that neither will die easy.
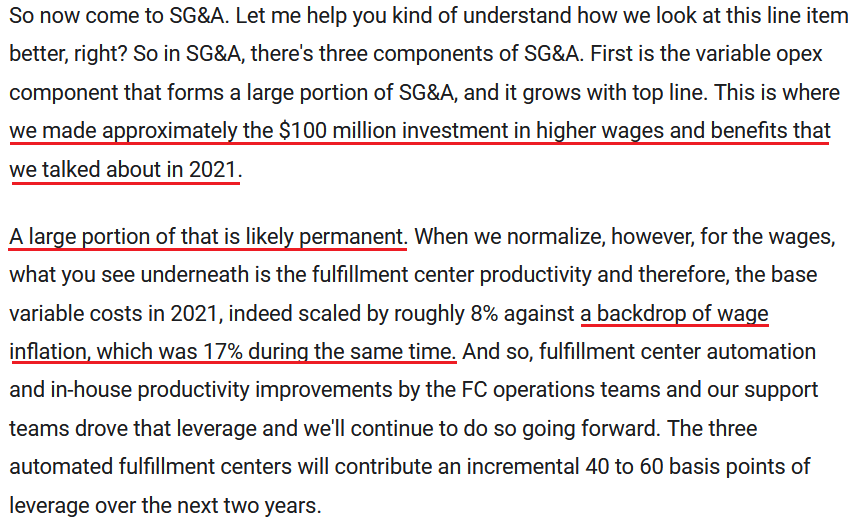
Please see below:
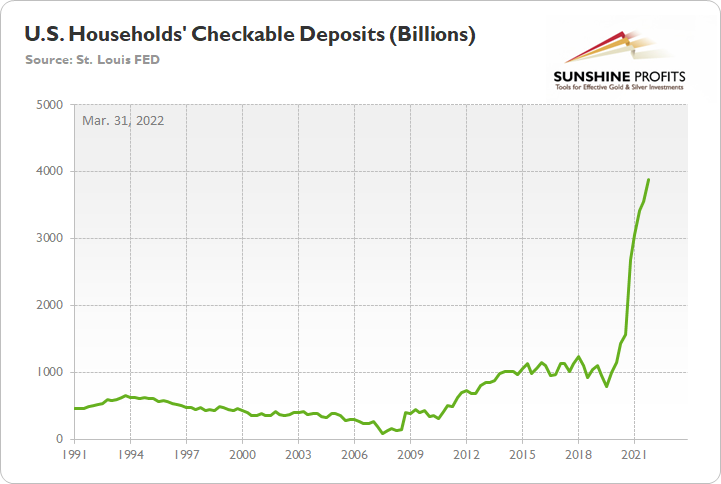
To explain, the green line above tracks U.S. households’ checkable deposits (data released on Mar. 10). For context, it’s the amount of money that U.S. households have in their checking accounts and/or demand deposit accounts.
If you analyze the vertical ascent on the right side of the chart, you can see that U.S. households have nearly $3.89 trillion in their checking accounts. For context, this is 288% more than Q4 2019 (pre-COVID-19). As a result, investors misunderstand the amount of demand that’s driving inflation.
As evidence, I noted on Mar. 28 that corporations are still sounding the alarm. I wrote:
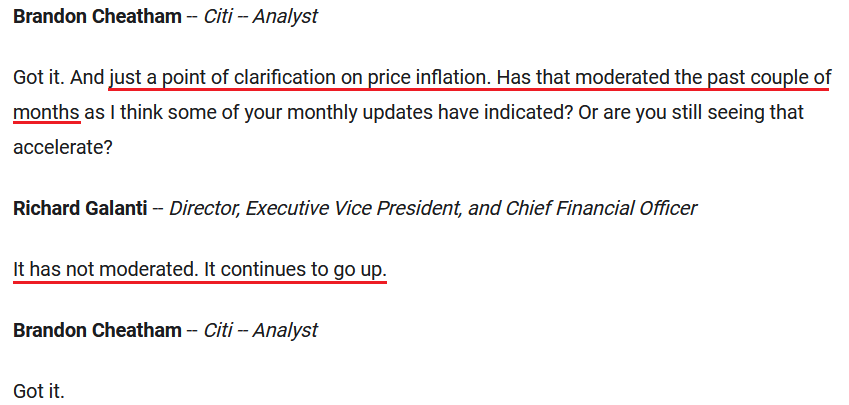
Costco released its second-quarter earnings on Mar. 3. Regarding inflation, CFO Richard Galanti said, “For the first quarter, I mentioned that we estimated, at that time, overall price inflation to have been in the 4.5% to 5% range. For the second quarter and talking with senior merchants, estimated overall price inflation was in the 6% range.
Has the situation improved?
 Source: Costco/The Motley Fool
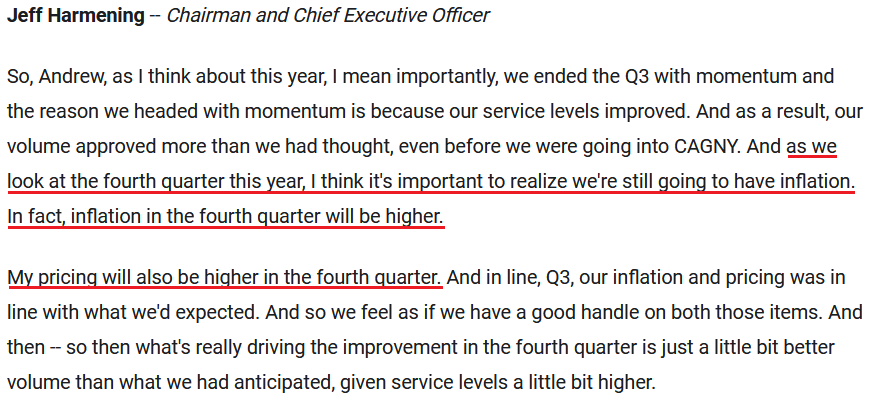
Singing a similar tune, General Mills released its third-quarter earnings on Mar. 23. CEO Jeff Harmening said:
 Source: General Mills/The Motley Fool
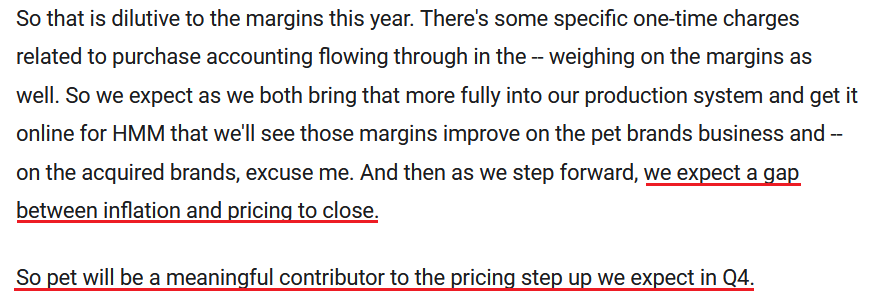
Moreover, the latter also provided some color on pet food inflation. When asked about the company’s pet profit margins, Harmening said:
“In terms of elasticity, the pet category is relatively inelastic. Even in recessionary periods, it's relatively inelastic. And you asked about pack sizes, one of the things we've seen is that demand has been so strong in the pet category, and we anticipate going forward.”
For context, “inelastic” means that demand remains relatively constant when General Mills raises prices. Normally, higher prices should result in less demand. However, with consumers still willing to pay up for desired goods, investors are misreading the stickiness of inflation.
Please see below:
 Source: General Mills/The Motley Fool
Supporting the claim, Chewy released its fourth-quarter earnings on Mar. 29. For context, the American online retailer sells more than 100,000 pet food and pet-related products. Moreover, while he didn't provide any specifics, CEO Sumit Singh said: "If you look at Q1 so far, prices lead cost by low single digits."
In addition:
 Source: Chewy/The Motley Fool
Supporting that claim, Chewy’s situation aligns with what Dave & Buster’s CFO Michael Quartieri said on Mar. 28:
 Source: Dave & Buster’s/The Motley Fool
Moreover, Micron also noted the inflationary pressures this week. For example, CBO Sumit Sadana highlighted sticky inflation during the company’s second-quarter earnings call on Mar. 29. For context, Micron manufactures chips for PCs, data centers, smartphones, game consoles, cars, and other computing devices.
Please see below:
 Source: Micron/Seeking Alpha
On top of that, Restoration Hardware (RH) CEO Gary Friedman vented his frustrations during the company’s fourth-quarter earnings call on Mar. 29. He said:
“Janet Yellen, not too many weeks ago, when [inflation] was 4% or 5%, said it was going to 2%. And two weeks later, it went to 7.5%, and now it's 7.9%. And we've got Jerome Powell saying that they waited too long. And now we're going to have two years of interest rate increases.”
“I just wonder if anybody at the Fed has picked up the phone and called a business person and said, hey, what do you think is happening with inflation? How's ocean rates? How is this? How is that? I mean, I think, I don't think anybody really understands what's coming from an inflation point of view, because either businesses are going to make a lot less money, or they're going to raise their prices.”
“And I don't think anybody really understands how high prices are going to go everywhere, in restaurants, in cars and everything. I think it's going to outrun the consumer, and I think we're going to be in some tricky space.”
He continued:
“Everybody thinks supply chains are getting better. I don't think we've gotten better at all. I mean it is what it is. I mean, product is on the water for a long time, getting ships into port. It's taken a long time. We've got generally about five extra weeks in our supply chain right now. That's a lot of time. It's a lot of money. And that's the average.”
As a result:
 Source: Restoration Hardware/Seeking Alpha
He also weighed in on the U.S. housing market, and with RH curating furniture, lighting, textiles, rugs, bathware, and other home décor products, he has valuable insight.
“I don't want to scare people. I'm just trying to tell you, I mean, you can see the numbers that we see. The last time houses had multiple bids like this, the last time prices went up like this, there wasn't a great other side to it.”
To that point, with the Fed caught between a rock and a hard place, how do officials reduce inflation without cracking the housing market?
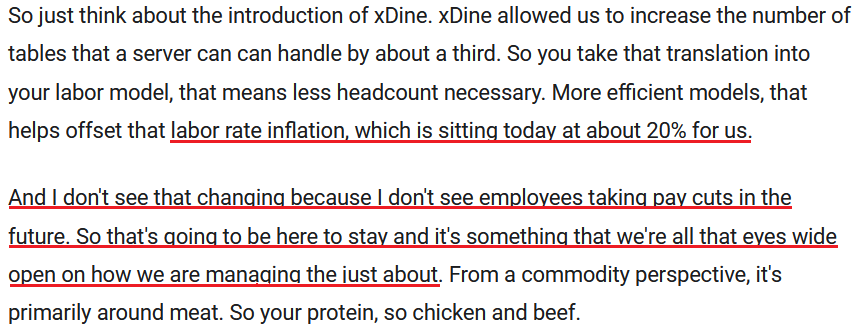
Please see below:
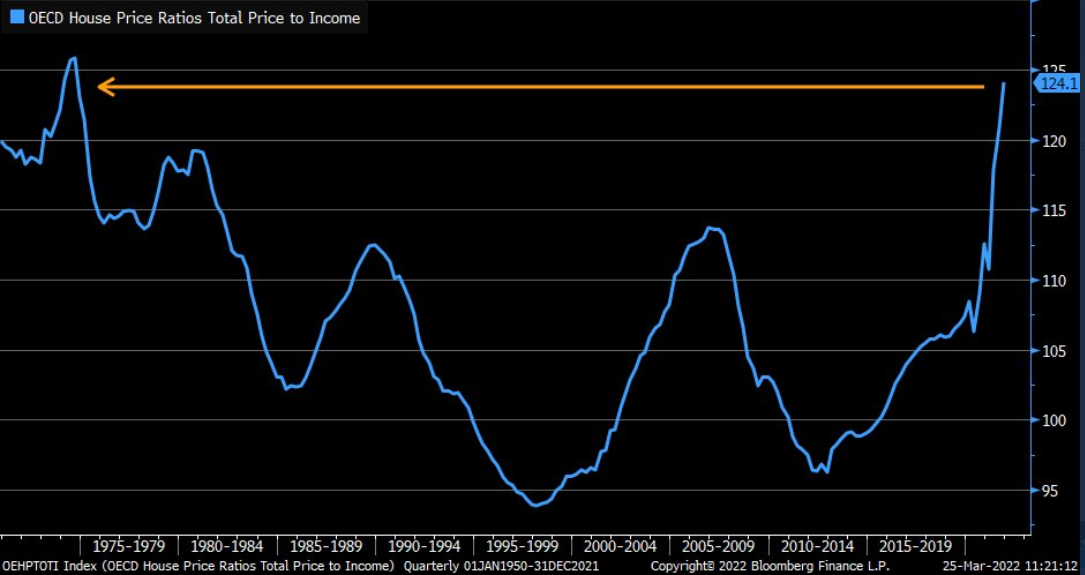
To explain, the blue line above tracks the Organisation for Economic Co-operation and Development’s (OECD) aggregate measure of home prices as a percentage of owners’ income. In a nutshell: when the blue line is rising, it means that home prices are increasing at a faster pace than incomes.
Moreover, if you analyze the right side of the chart, you can see that homeowners’ price-to-income ratio is near the highs set in the 1970s. For context, this is a global metric and is not confined to the U.S. However, with consumers having less income to service their mortgage debt than in any period since the 1970s, does it seem like this will end well?
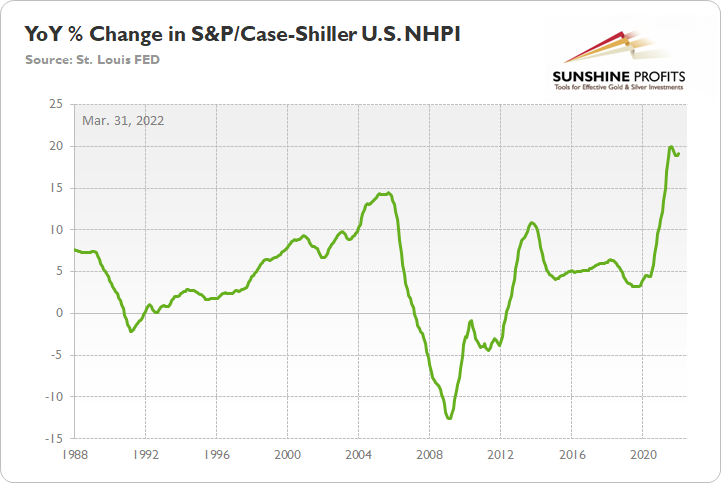
To that point, the S&P/Case-Shiller U.S. National Home Price Index (NHPI) increased by 19.2% year-over-year (YoY) on Mar. 29. For context, the consensus estimate was 18.4%. As a result, housing prices remain red hot at a time when the Fed needs to drop the hawkish hammer.
Please see below:
Continuing the theme, the Dallas Fed released its Texas Service Sector Outlook Survey on Mar. 29. The report revealed:
“March saw continued upward pressure on wages and prices. The wages and benefits index rose from 34.7 to 36.5, with 37 percent of respondents noting a rise in labor compensation costs compared with February. The selling prices index rose from 29.9 to 33.9, while the input prices index surged from 51.2 to 59.2. Both readings are record highs for the surveys going back to 2007.”
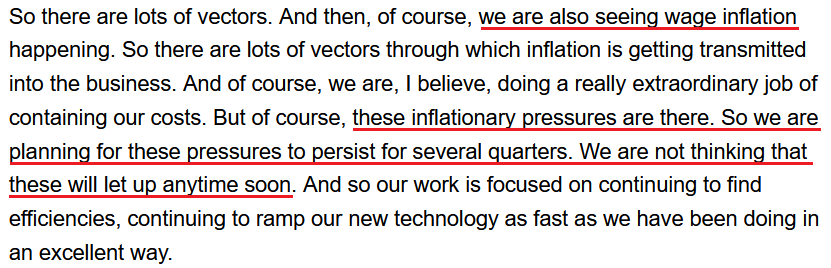
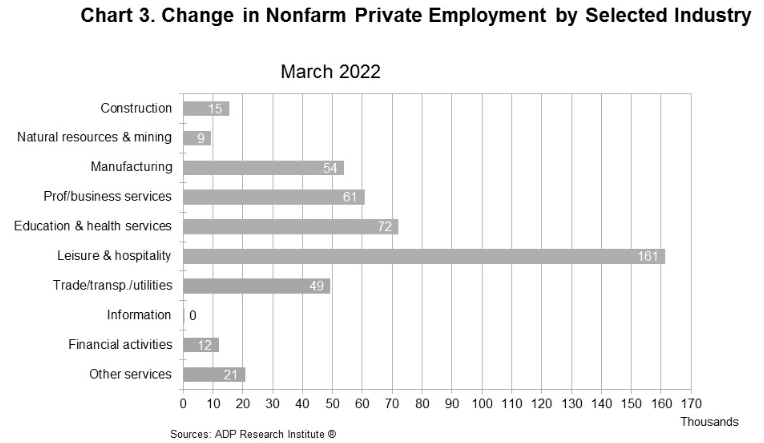
Moreover, ADP released its National Employment Report on Mar. 30. With private payrolls coming in at 455,000 versus 400,000 expected, ADP Chief Economist Nela Richardson said:
“Job growth was broad-based across sectors in March, contributing to the nearly 1.5 million jobs added for the first quarter in 2022. Businesses are hiring, specifically among the service providers which had the most ground to make up due to early pandemic losses. However, a tight labor supply remains an obstacle for continued growth in consumer-facing industries.”
Please see below:
The bottom line? Investors are miscalculating the resiliency of inflation. With supply-chain disruptions primarily blamed for the recent surge, market participants don’t realize that a severe shock to demand is needed to cool the pricing pressures. Moreover, with the U.S. labor market on fire and robust wage growth akin to pouring gasoline, how can the Fed expect inflation to calm when consumers remain flush with cash?
Moreover, the housing market is the canary in the coal mine. Robust wages, all-time high checkable deposits, and record employment opportunities allow buyers to service their mortgage debt with little worry. However, to reduce inflation, the Fed needs to flip the script. This means fewer employment opportunities, lower wages, and eventually, lower checkable deposits. As such, the probability of normalizing inflation without causing a recession is likely slim to none.
In conclusion, the PMs increased on Mar. 30, as rallies in crude are still sparking rallies in the metals. However, investors are making fatal fundamental mistakes. The risk-reward in risk assets is extremely poor, as the Fed’s margin for error may be at an all-time low. As a result, if the Fed calms inflation without causing material drawdowns of the S&P 500 and the PMs, it would be like hitting a hole in one at the golf course.
Overview of the Upcoming Part of the Decline
- It seems to me that the corrective upswing is now over or very close to being over , and that gold, silver, and mining stocks are now likely to continue their medium-term decline.
- It seems that the first (bigger) stop for gold will be close to its previous 2021 lows, slightly below $1,800 . Then it will likely correct a bit, but it’s unclear if I want to exit or reverse the current short position based on that – it depends on the number and the nature of the bullish indications that we get at that time.
- After the above-mentioned correction, we’re likely to see a powerful slide, perhaps close to the 2020 low ($1,450 - $1,500).
- If we see a situation where miners slide in a meaningful and volatile way while silver doesn’t (it just declines moderately), I plan to – once again – switch from short positions in miners to short positions in silver. At this time, it’s too early to say at what price levels this could take place, and if we get this kind of opportunity at all – perhaps with gold close to $1,600.
- I plan to exit all remaining short positions once gold shows substantial strength relative to the USD Index while the latter is still rallying. This may be the case with gold close to $1,350 - $1,400. I expect silver to fall the hardest in the final part of the move. This moment (when gold performs very strongly against the rallying USD and miners are strong relative to gold after its substantial decline) is likely to be the best entry point for long-term investments, in my view. This can also happen with gold close to $1,375, but at the moment it’s too early to say with certainty.
- As a confirmation for the above, I will use the (upcoming or perhaps we have already seen it?) top in the general stock market as the starting point for the three-month countdown. The reason is that after the 1929 top, gold miners declined for about three months after the general stock market started to slide. We also saw some confirmations of this theory based on the analogy to 2008. All in all, the precious metals sector is likely to bottom about three months after the general stock market tops.
- The above is based on the information available today, and it might change in the following days/weeks.
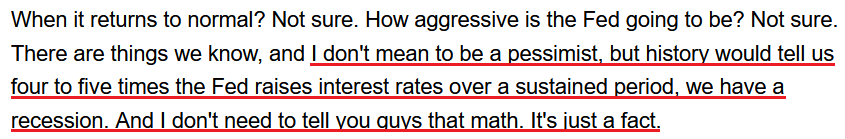
You will find my general overview of the outlook for gold on the chart below:
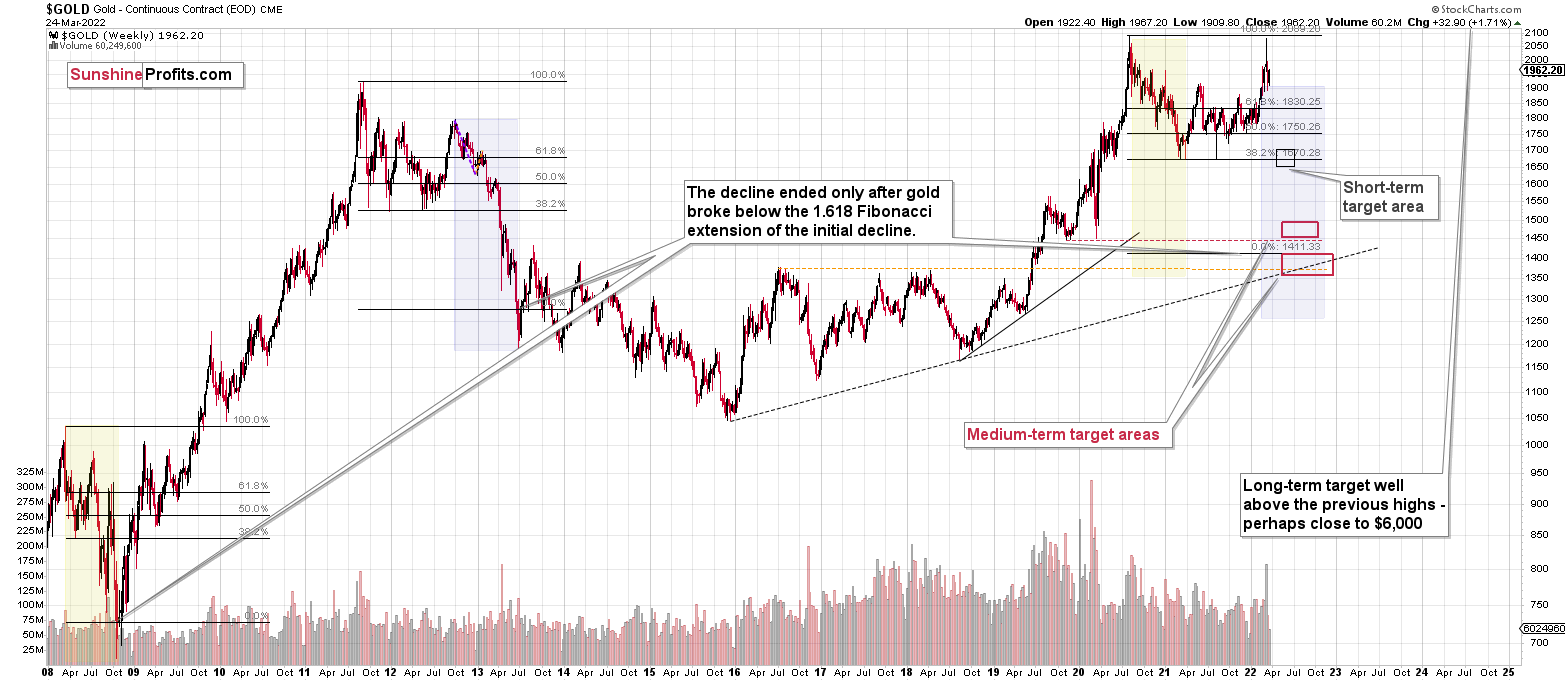
Please note that the above timing details are relatively broad and “for general overview only” – so that you know more or less what I think and how volatile I think the moves are likely to be – on an approximate basis. These time targets are not binding or clear enough for me to think that they should be used for purchasing options, warrants or similar instruments.
Summary
Summing up, despite the recent rally in gold, the outlook for junior mining stocks remains exactly as I described previously.
Crude oil’s extreme outperformance, the stock market’s weakness, and critical medium-term resistance levels reached by gold (all-time high!) and junior mining stocks, all indicate that the tops are at hand or have just formed. The huge-volume reversals in gold and (especially) mining stocks, along with silver’s short-term outperformance, all point to lower precious metals prices in the following days/weeks. It seems that the top is in.
Investing and trading are difficult. If it was easy, most people would be making money – and they’re not. Right now, it’s most difficult to ignore the urge to “run for cover” if you physically don’t have to. The markets move on “buy the rumor and sell the fact.” This repeats over and over again in many (all?) markets, and we have direct analogies to similar situations in gold itself. Junior miners are likely to decline the most, also based on the massive declines that are likely to take place (in fact, they have already started) in the stock markets.
From the medium-term point of view, the two key long-term factors remain the analogy to 2013 in gold and the broad head and shoulders pattern in the HUI Index. They both suggest much lower prices ahead.
It seems that our profits from short positions are going to become truly epic in the coming months.
After the sell-off (that takes gold to about $1,350-$1,500), I expect the precious metals to rally significantly. The final part of the decline might take as little as 1-5 weeks, so it's important to stay alert to any changes.
Most importantly, please stay healthy and safe. We made a lot of money last March and this March, and it seems that we’re about to make much more in the upcoming decline, but you have to be healthy to enjoy the results.
As always, we'll keep you - our subscribers - informed.
To summarize:
Trading capital (supplementary part of the portfolio; our opinion): Full speculative short positions (300% of the full position) in junior mining stocks are justified from the risk to reward point of view with the following binding exit profit-take price levels:
Mining stocks (price levels for the GDXJ ETF): binding profit-take exit price: $34.63; stop-loss: none (the volatility is too big to justify a stop-loss order in case of this particular trade)
Alternatively, if one seeks leverage, we’re providing the binding profit-take levels for the JDST (2x leveraged) and GDXD (3x leveraged – which is not suggested for most traders/investors due to the significant leverage). The binding profit-take level for the JDST: $14.98; stop-loss for the JDST: none (the volatility is too big to justify a SL order in case of this particular trade); binding profit-take level for the GDXD: $25.48; stop-loss for the GDXD: none (the volatility is too big to justify a SL order in case of this particular trade).
For-your-information targets (our opinion; we continue to think that mining stocks are the preferred way of taking advantage of the upcoming price move, but if for whatever reason one wants / has to use silver or gold for this trade, we are providing the details anyway.):
Silver futures downside profit-take exit price: $19.12
SLV profit-take exit price: $17.72
ZSL profit-take exit price: $38.28
Gold futures downside profit-take exit price: $1,683
HGD.TO – alternative (Canadian) inverse 2x leveraged gold stocks ETF – the upside profit-take exit price: $11.79
HZD.TO – alternative (Canadian) inverse 2x leveraged silver ETF – the upside profit-take exit price: $29.48
Long-term capital (core part of the portfolio; our opinion): No positions (in other words: cash
Insurance capital (core part of the portfolio; our opinion): Full position
Whether you already subscribed or not, we encourage you to find out how to make the most of our alerts and read our replies to the most common alert-and-gold-trading-related-questions.
Please note that we describe the situation for the day that the alert is posted in the trading section. In other words, if we are writing about a speculative position, it means that it is up-to-date on the day it was posted. We are also featuring the initial target prices to decide whether keeping a position on a given day is in tune with your approach (some moves are too small for medium-term traders, and some might appear too big for day-traders).
Additionally, you might want to read why our stop-loss orders are usually relatively far from the current price.
Please note that a full position doesn't mean using all of the capital for a given trade. You will find details on our thoughts on gold portfolio structuring in the Key Insights section on our website.
As a reminder - "initial target price" means exactly that - an "initial" one. It's not a price level at which we suggest closing positions. If this becomes the case (like it did in the previous trade), we will refer to these levels as levels of exit orders (exactly as we've done previously). Stop-loss levels, however, are naturally not "initial", but something that, in our opinion, might be entered as an order.
Since it is impossible to synchronize target prices and stop-loss levels for all the ETFs and ETNs with the main markets that we provide these levels for (gold, silver and mining stocks - the GDX ETF), the stop-loss levels and target prices for other ETNs and ETF (among other: UGL, GLL, AGQ, ZSL, NUGT, DUST, JNUG, JDST) are provided as supplementary, and not as "final". This means that if a stop-loss or a target level is reached for any of the "additional instruments" (GLL for instance), but not for the "main instrument" (gold in this case), we will view positions in both gold and GLL as still open and the stop-loss for GLL would have to be moved lower. On the other hand, if gold moves to a stop-loss level but GLL doesn't, then we will view both positions (in gold and GLL) as closed. In other words, since it's not possible to be 100% certain that each related instrument moves to a given level when the underlying instrument does, we can't provide levels that would be binding. The levels that we do provide are our best estimate of the levels that will correspond to the levels in the underlying assets, but it will be the underlying assets that one will need to focus on regarding the signs pointing to closing a given position or keeping it open. We might adjust the levels in the "additional instruments" without adjusting the levels in the "main instruments", which will simply mean that we have improved our estimation of these levels, not that we changed our outlook on the markets. We are already working on a tool that would update these levels daily for the most popular ETFs, ETNs and individual mining stocks.
Our preferred ways to invest in and to trade gold along with the reasoning can be found in the how to buy gold section. Furthermore, our preferred ETFs and ETNs can be found in our Gold & Silver ETF Ranking.
As a reminder, Gold & Silver Trading Alerts are posted before or on each trading day (we usually post them before the opening bell, but we don't promise doing that each day). If there's anything urgent, we will send you an additional small alert before posting the main one.
Thank you.
Przemyslaw Radomski, CFA
Founder, Editor-in-chief

