
tools spotlight

-
Silver’s Signature Trick: Soaring, Although It Means No Good
September 13, 2022, 9:58 AMSilver had one of its highest gains this year, while gold played the second fiddle. Does that make any difference to what awaits precious metals in the medium term?
Did you see the huge daily rally in silver? Some (inexperienced) traders will say it’s bullish, but based on over a decade of experience with the precious metals sector, I know that it’s rarely bullish when silver soars while gold doesn’t. That’s exactly what we saw yesterday.
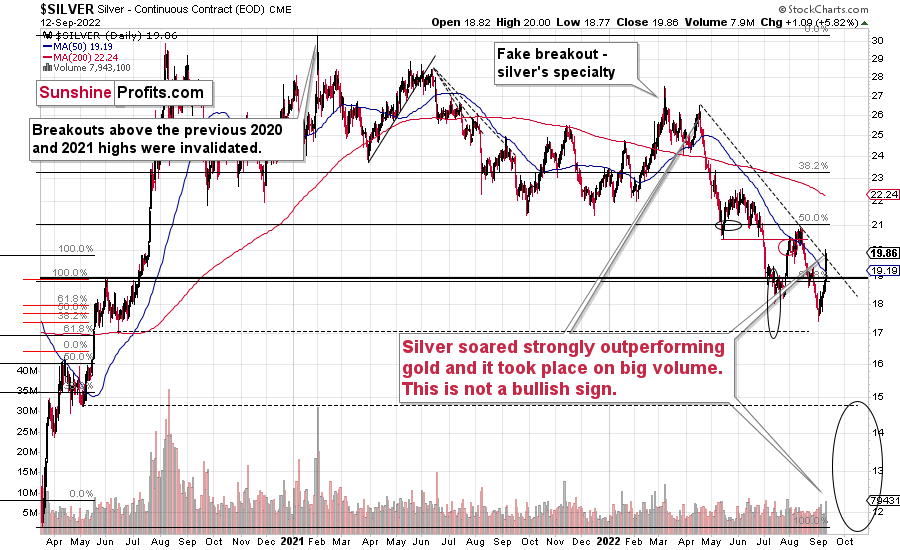
Silver prices jumped by almost 6% during a single session. The volume was one of the biggest that we’ve seen this year, and biggest that we’ve seen since the beginning of August. Silver stopped at its declining, medium-term resistance line, but even if it moved slightly above it, it wouldn’t really matter, as the white metal is known for fake breakouts (“fakeouts”) right before bigger declines.
Since – based on the analogy to what we saw in 2013 – the precious metals market is likely right before a huge slide, the recent price action in silver is even less bullish. In fact, it perfectly fits this extremely bearish medium-term narrative.
Now, huge daily run-ups in silver are suspicious on their own, but it’s particularly so when they are taking place along with a lack of analogous action in gold.
Gold was up by less than 1% yesterday, so it’s clearly the case that silver is outperforming gold on a very short-term basis.
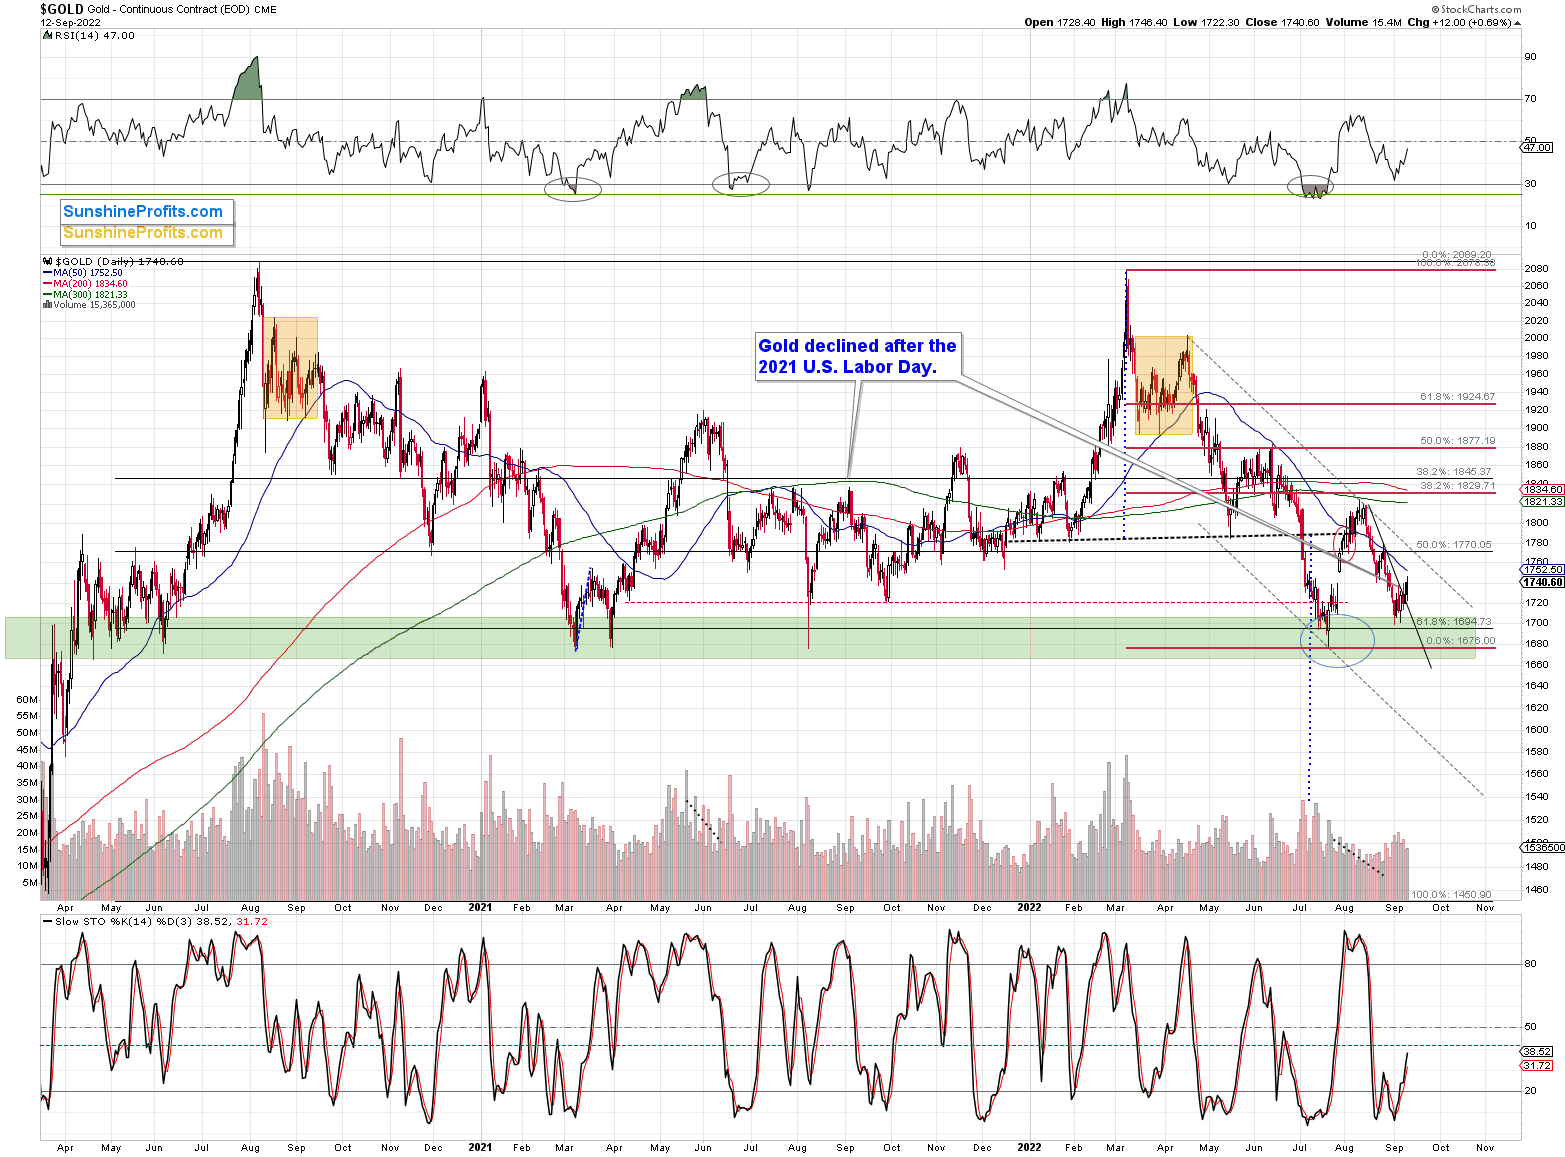
In the case of the flagship precious metal, nothing really changed yesterday. It moved higher by $12 yesterday, but compared to what the USD Index did, it was “small potatoes.”
In yesterday’s analysis, I wrote the following about the USD Index’s short-term performance:
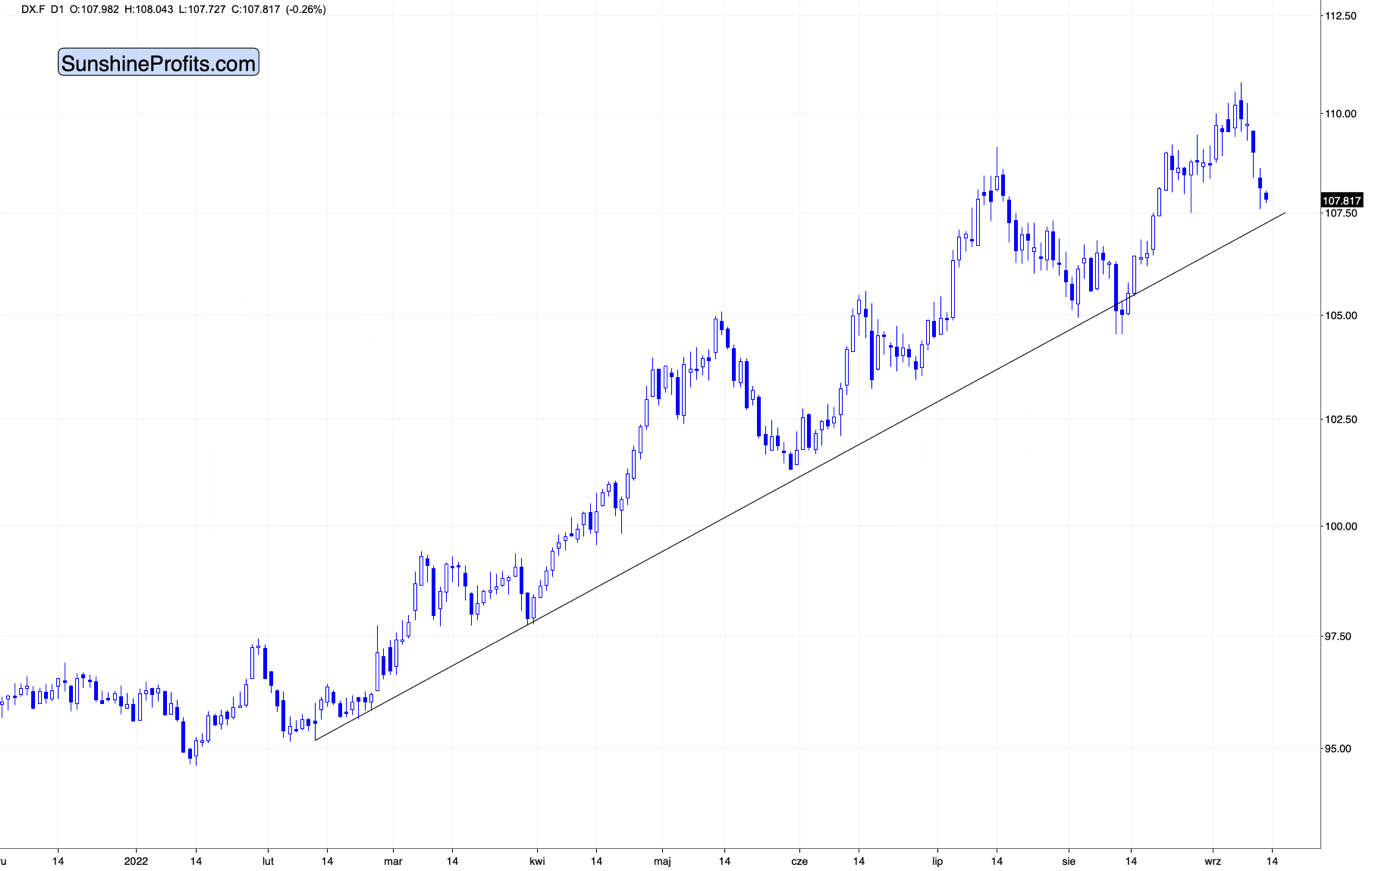
From the short-term point of view, the USD Index declined substantially today (likely the safe-haven demand decline based on the counter-offensive in Ukraine, which suggests that the war might be close to its end, and Russia could be on the losing side thereof), and it’s about to reach its rising support line.
This line kept the declines in check for months, so it’s quite likely that it will stop the declining prices also this time.
While the USD Index declined substantially in today’s pre-market trading (about 1.2%), did gold’s price rally substantially?
No. It’s up by just 0.38% so far today. (And silver’s price is up by over 1.6%, which means that it’s outperforming gold on an immediate-term basis – something that we often see right before bigger declines.)
So, we have a situation where gold doesn’t really want to rally based on the USD’s decline, and that’s bearish for gold, especially since the support for the USD Index appears to be just around the corner.
Also, regardless of the immediate-term effects on forex prices, please consider the following. If the situation in Ukraine stabilizes and things get back to the way they were before, at least in terms of borders (or Ukraine claims Crimea back), it means undoing a lot of what happened based on those changes in the past, right? And gold rallied in response to both events – the invasion of Crimea and the invasion of the rest of Ukraine. So, it could decline as things stabilize – mainly because the safe-haven demand wanes.
While gold prices moved higher after I wrote the above, they didn’t move substantially higher, but silver did . Overall, based on the relative valuations, the indications got more bearish during the session.
What about junior mining stocks?
They moved higher as they were practically forced to by rallying gold, but please note that they ended the day only 2% higher, which is very little compared to silver’s almost 6% rally.
Plus, please note that junior miners reversed some of their earlier gains before the end of the session.
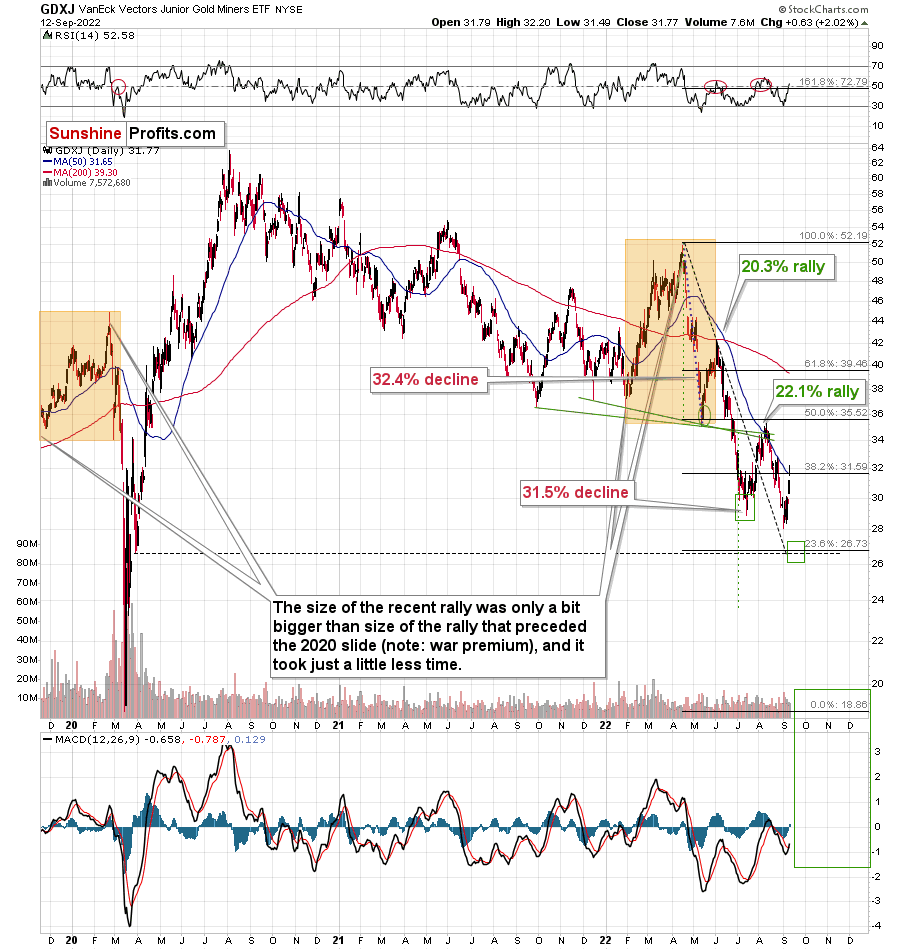
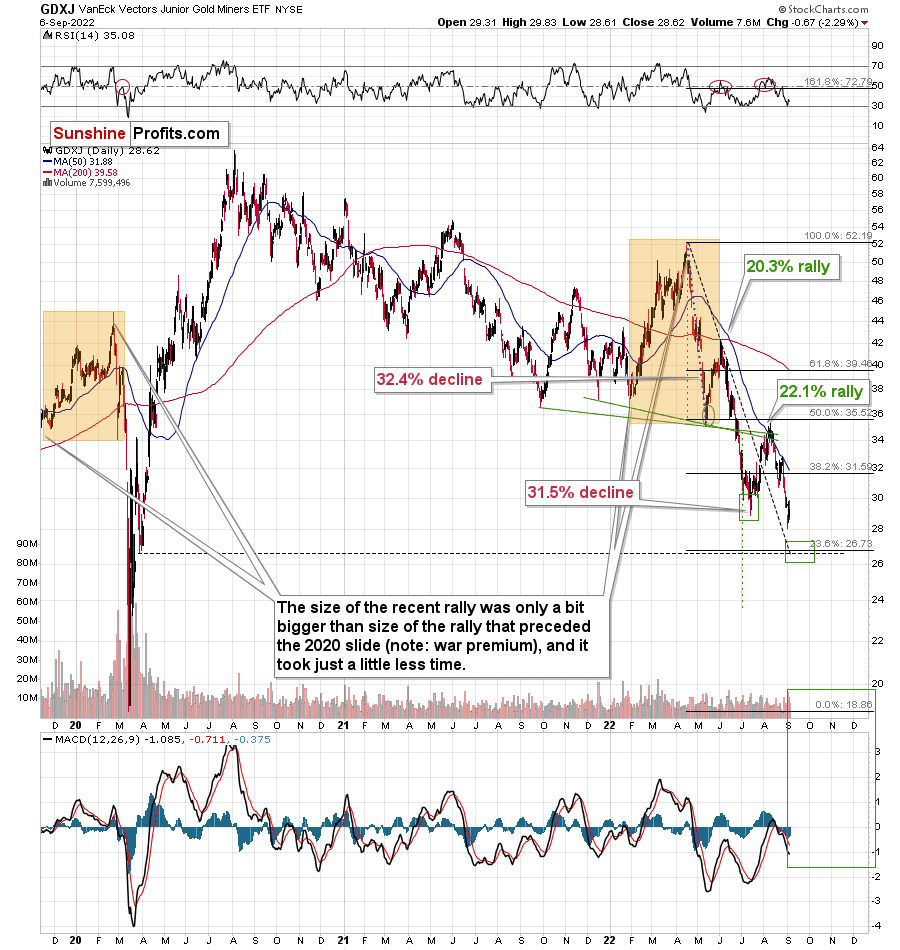
Interestingly, the GDXJ just approached its 50-day moving average, which means the end of previous counter-trend rallies ever since the April 2022 top.
This ~$4 rally fits the final counter-trend rally that we saw in 2013.
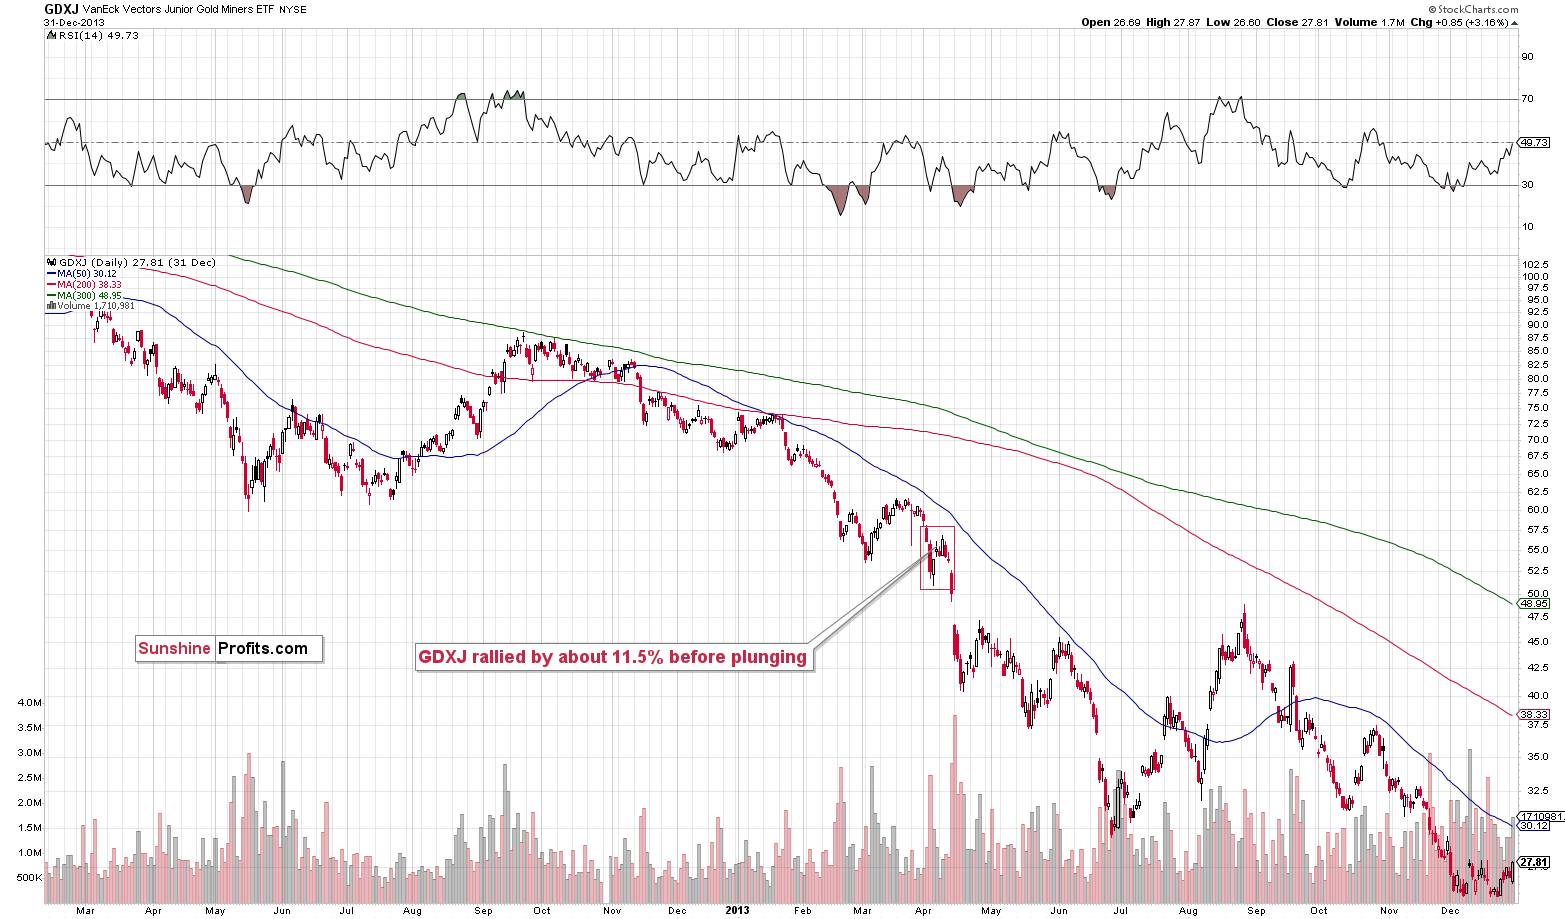
The GDXJ rallied by about 14.7% from its recent low.
Back in 2013, the GDXJ rallied by about 11.5% before plunging.
This time, the corrective rally is bigger, but please note that the decline that we saw beforehand was sharper than what we saw in 2013. Consequently, a bigger bounce is normal.
It’s even more interesting to compare the rally to the previous price movement. In both bases, the GDXJ corrected about half of the preceding short-term rally, and it moved above the most recent short-term low. This is exactly what we saw recently.
This is yet another indication that what we’re seeing right now is a part of a bigger pattern that’s very bearish.
One might focus on the last few days on a stand-alone basis and claim that “the rally is bullish”, but in my opinion, this narrow focus might be very costly.
Thank you for reading our free analysis today. Please note that the above is just a small fraction of the full analyses that our subscribers enjoy on a regular basis. They include multiple premium details such as the interim targets for gold and mining stocks that could be reached in the next few weeks. We invite you to subscribe now and read today’s issue right away.
Sincerely,
Przemyslaw Radomski, CFA
Founder, Editor-in-chief -
The USD Fell on Ukraine’s Success News. How Did Gold React?
September 12, 2022, 9:22 AMUkraine's military successes in the war with Russia had a negative impact on the dollar. At the same time, gold didn’t benefit as much as it could.
Looking at an individual tree (daily session) is exciting. Especially if the tree (profits on a trade) is growing day by day. However, it is looking at what the forest (the broad perspective, general trends) does that makes one’s portfolio grow over time.
While I provided a lot of context in Friday’s flagship analysis, in today’s analysis, I will focus on two key long-term developments that are extremely important but that don’t get enough emphasis.
The first one is in gold stocks, and the second is in the USD Index.
Starting with the latter, the key thing is that the USD Index is after a breakout above the previous highs, and while it just invalidated the short-term breakout, it continues to trade in a mirror-like pattern to what happened in 2002 and 2003.
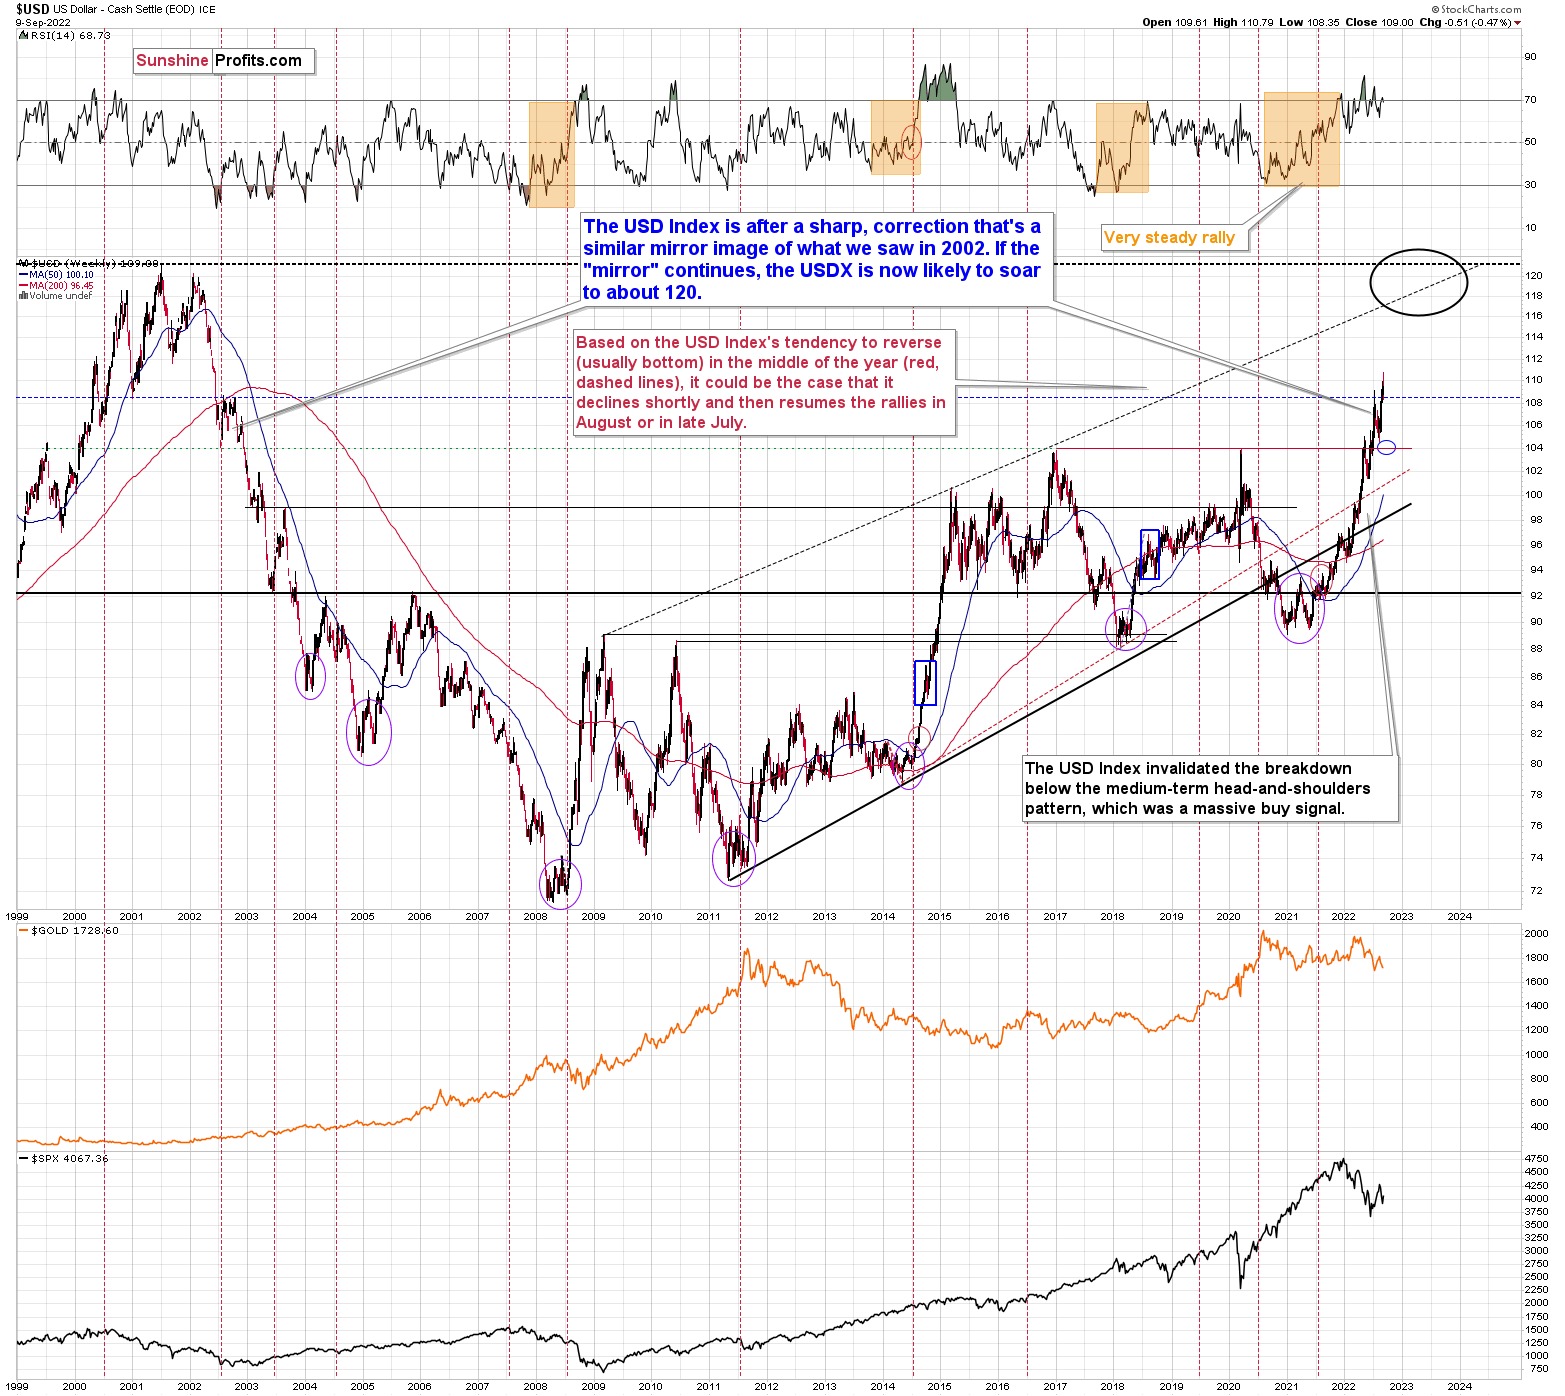
Back then, the corrective pause took quite a while before the movement continued. Due to sharply rising interest rates, it doesn’t have to be the case this time . However, even if the USD Index once again moves to the 104-105 area, the medium-term outlook will still remain very bullish.
Is it likely to happen?
Not necessarily.
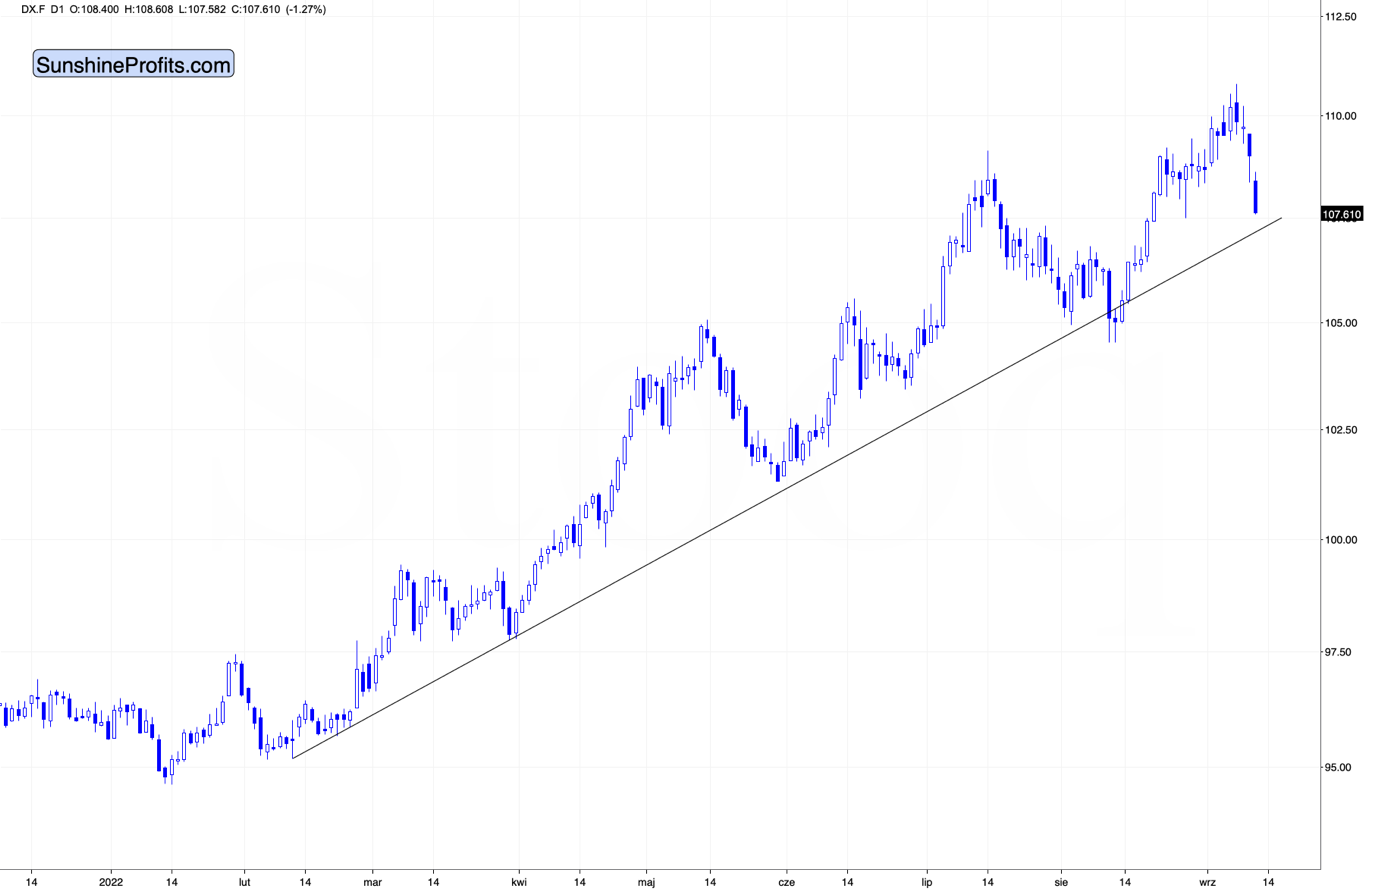
From the short-term point of view, the USD Index declined substantially today (likely the safe-haven demand decline based on the counter-offensive in Ukraine, which suggests that the war might be close to its end, and Russia could be on the losing side thereof), and it’s about to reach its rising support line.
This line kept the declines in check for months, so it’s quite likely that it will stop the declining prices also this time.
While the USD Index declined substantially in today’s pre-market trading (about 1.2%), did gold’s price rally substantially?
No. It’s up by just 0.38% so far today. (And silver’s price is up by over 1.6%, which means that it’s outperforming gold on an immediate-term basis – something that we often see right before bigger declines.)
So, we have a situation where gold doesn’t really want to rally based on the USD’s decline, and that’s bearish for gold, especially since the support for the USD Index appears to be just around the corner.
Also, regardless of the immediate-term effects on forex prices, please consider the following. If the situation in Ukraine stabilizes and things get back to the way they were before, at least in terms of borders (or Ukraine claims Crimea back), it means undoing a lot of what happened based on those changes in the past, right? And gold rallied in response to both events – the invasion of Crimea and the invasion of the rest of Ukraine. So, it could decline as things stabilize – mainly because the safe-haven demand wanes.
The second big thing that I want to feature today is the situation in the HUI Index. I like to analyze this index as it’s been trading for a long time, and therefore it’s able to provide a lot of context to the most recent price moves.
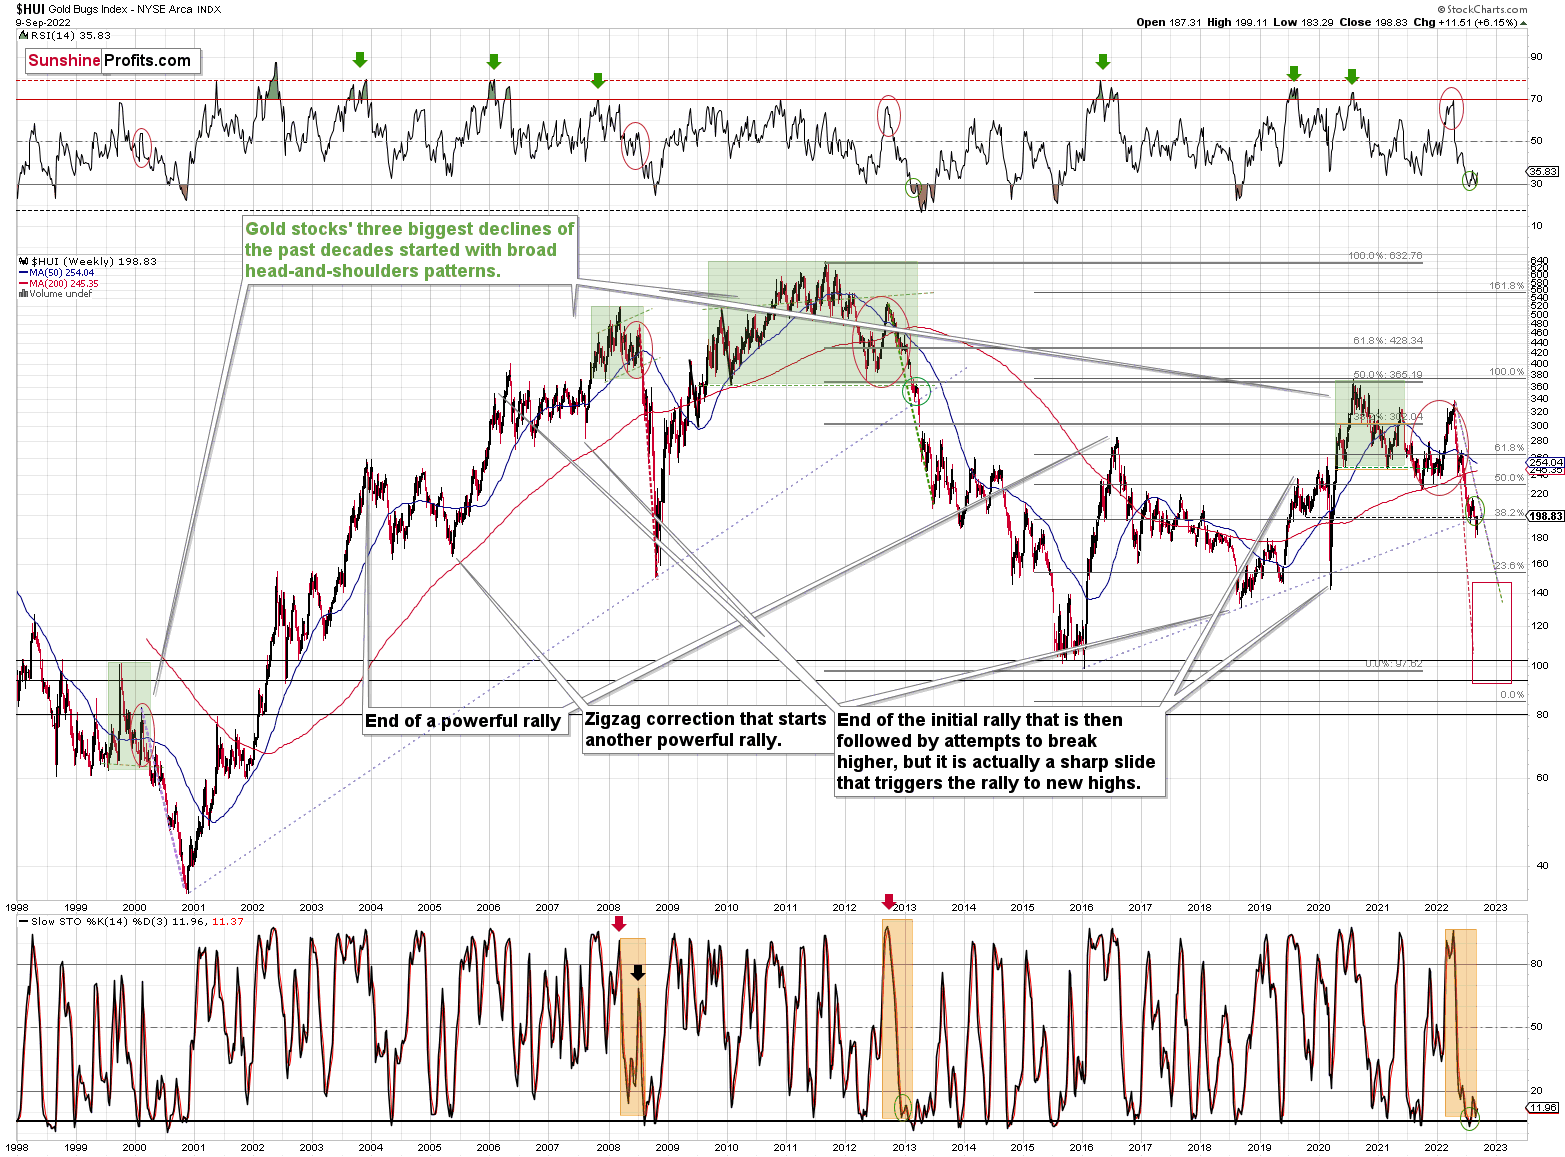
In this case, what I would like to emphasize is that the key breakdown is below the rising long-term support line that’s based on the 2016 and 2018 lows.
Back in 2020, the breakdown below this line was quickly invalidated. This time, it’s the opposite. The breakdown was confirmed.
The very recent move higher simply means that gold stocks are verifying the breakdown. Nothing more.
It is the huge decline that we saw this year that is what is really going on, and by focusing on just the last several trading days, one might completely miss the perspective. The big deal about gold stocks right now is that they are in a medium-term decline, not that they bounced recently.
As far as gold itself is concerned, it continues to correct from approximately its previous lows, which is exactly what we saw in 2013 right before the biggest part of the slide. I was there. I remember what the overall feeling among the investors back then was. The narrative was “the bottom is in, the rally will now surely resume, it’s a no-brainer”. Then gold plunged.
Nothing from what we saw recently (including today) invalidated this analogy. The outlook remains extremely bearish.
Thank you for reading our free analysis today. Please note that the above is just a small fraction of the full analyses that our subscribers enjoy on a regular basis. They include multiple premium details such as the interim targets for gold and mining stocks that could be reached in the next few weeks. We invite you to subscribe now and read today’s issue right away.
Sincerely,
Przemyslaw Radomski, CFA
Founder, Editor-in-chief -
The Medium-Term Downtrend Can Resume Anytime in the Gold Market
September 9, 2022, 5:23 AMAvailable to premium subscribers only.
Thank you for reading our free analysis today. Please note that the above is just a small fraction of the full analyses that our subscribers enjoy on a regular basis. They include multiple premium details such as the interim targets for gold and mining stocks that could be reached in the next few weeks. We invite you to subscribe now and read today’s issue right away.
Sincerely,
Przemyslaw Radomski, CFA
Founder, Editor-in-chief -
No Invalidation, Just Verification - Why Did the GDXJ Rally?
September 8, 2022, 8:12 AMThere was some growth seen in gold and mining stocks that could make investors feel optimistic. Does this upward move change anything in the medium-term bearish perspective, though?
The precious metals sector moved higher yesterday, so you might be wondering if anything changed, and if so, what would that be.
In short, practically nothing changed. The only thing that really changed is that the probability of seeing a bigger rebound from ~$27 in the GDXJ ETF decreased because of yesterday’s rally and last few days’ correction in general.
Why would that be?
Because markets correct when they get ahead of themselves in a given move. They rally or (like in this case) decline too far too fast. When they do, the force that has been pushing them in a given direction is temporarily gone, while the other side of the market gets the upper hand.
Then the test comes. Were these “new” price levels accidental? Or is this a new reality? Depending on that, people will either wait it out or act – buy or sell. The test can take place in all sorts of ways. The most obvious one is simply “time”. After a price moves below some key levels and remains there for an extended period of time, becomes obvious that the move was not an accident and that prices are actually staying there – perhaps for good and perhaps simply for much longer than just a few days.
Another way for markets to check if something is temporary or if it’s here to stay is through the verification of moves above or below certain levels. If these corrective moves bounce from the previous support and it proves to now be a resistance, it becomes clear that “things have changed.”
Why are markets measuring this at all? Because ultimately, whether something is expensive or cheap depends on what one compares it to. Context is king, right?
This can be discussed on many levels, but to simplify, one way to answer this question is to check if it’s above or below certain thresholds – support / resistance levels like Fibonacci retracements, previous highs/lows, moving averages. Indicators are also useful here.
However, the key thing is that if one stops viewing gold as “being at the bottom of a trading channel” and starts viewing it as “being after a breakdown below the previous lows,” the perspective changes. In the first case, gold seems like a good buy as it’s cheap relative to the trading channel, while in the second one, gold seems expensive as who knows how low it could fall if the previous lows just failed to hold.
Why am I writing all this? To explain why the recent price action actually made it less likely for PMs to rebound after an additional short-term decline (with GDXJ at about $27).
Since gold, silver, and mining stocks are correcting right now, it means that the verification – the shift in perception of the current price levels – is already taking place. Thus, if the markets “accept” the current levels as the new base, a move to “just” $1,680 in gold or $27 in the GDXJ might not be extreme enough to trigger a visible rebound.
This means that the markets could move much lower without a more visible pause in the meantime. This would imply at least a $100 decline in gold and a possible slide to the 2020 lows in mining stocks in the absence of a more visible correction in the meantime. Of course, I’ll keep my eyes open, and I’ll report to my subscribers accordingly.
For now, let’s take a look at the shape of the most recent upswing in the GDXJ.
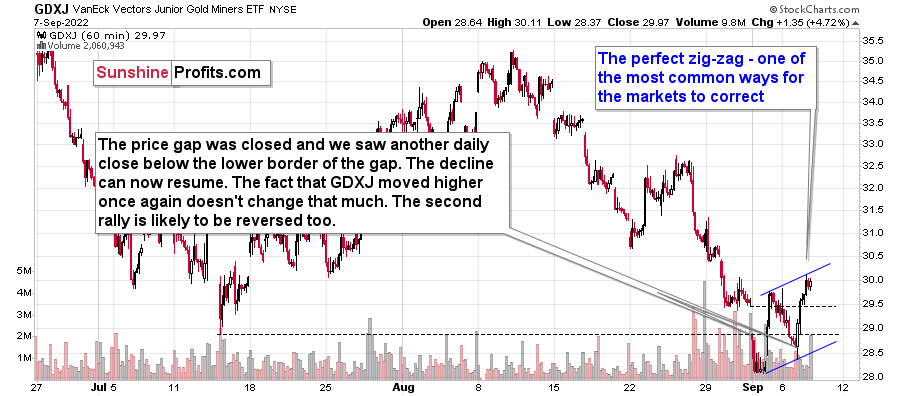
In short, it’s a perfect flag pattern. That’s the most classic way for the markets to correct after a bigger move. The sizes of the two immediate-term rallies are practically identical, making the pattern so perfect.
While the above chart might give the impression that the GDXJ invalidated the breakdown below its July lows, it’s not really the case. You see, it’s the daily closing price that really matters here.

Yesterday’s (Sep. 7) daily closing price was $29.97, and the lowest daily close in July was $30.02.
There was no invalidation – just verification of the breakdown, which has so far been successful.
We saw the same thing in the senior mining stocks – the GDX ETF. No invalidation, just verification.
This means that the medium-term outlook remains very, very bearish.
Oh, and by the way, seeing a correction here is not that odd because of the seasonality present in the USD Index.
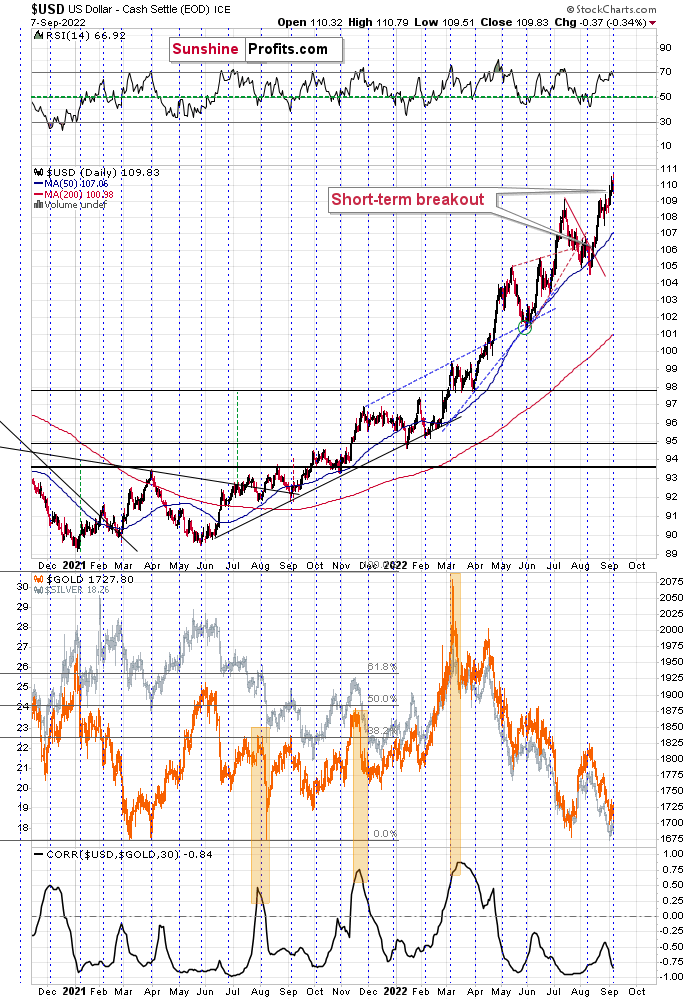
The USD Index tends to reverse (even if just for a short while) close to the turn of the month.
It recently moved to new highs, so it’s perfectly normal that we see a move back to the previously broken levels. Given the above, it’s perfectly normal that we see it now.
Since the precious metals’ prices are negatively correlated with the USD Index, the correction in the former is likely linked to the correction in the latter.
All in all, it seems that the current correction in mining stocks is quite normal, and it doesn’t invalidate the extremely bearish outlook for the medium term at all.
Thank you for reading our free analysis today. Please note that the above is just a small fraction of the full analyses that our subscribers enjoy on a regular basis. They include multiple premium details such as the interim targets for gold and mining stocks that could be reached in the next few weeks. We invite you to subscribe now and read today’s issue right away.
Sincerely,
Przemyslaw Radomski, CFA
Founder, Editor-in-chief -
Reversals in Gold and Silver Are More Bearish Than Declines
September 7, 2022, 9:03 AMGold’s fall after US Labor Day is not the only thing that happened in the precious metals market. Other events paint the near future in bearish colors.
As Predicted
In yesterday’s analysis, I explained how extremely likely it was for gold to decline after U.S. Labor Day, and that’s exactly what happened – gold declined. Not only that – it actually reversed its early gains before moving lower, and we saw the same thing in silver and mining stocks, and the reversal is more bearish than a small decline, as it indicates that the very brief rally is likely already over.
Let’s take a look at what happened recently, starting with gold.
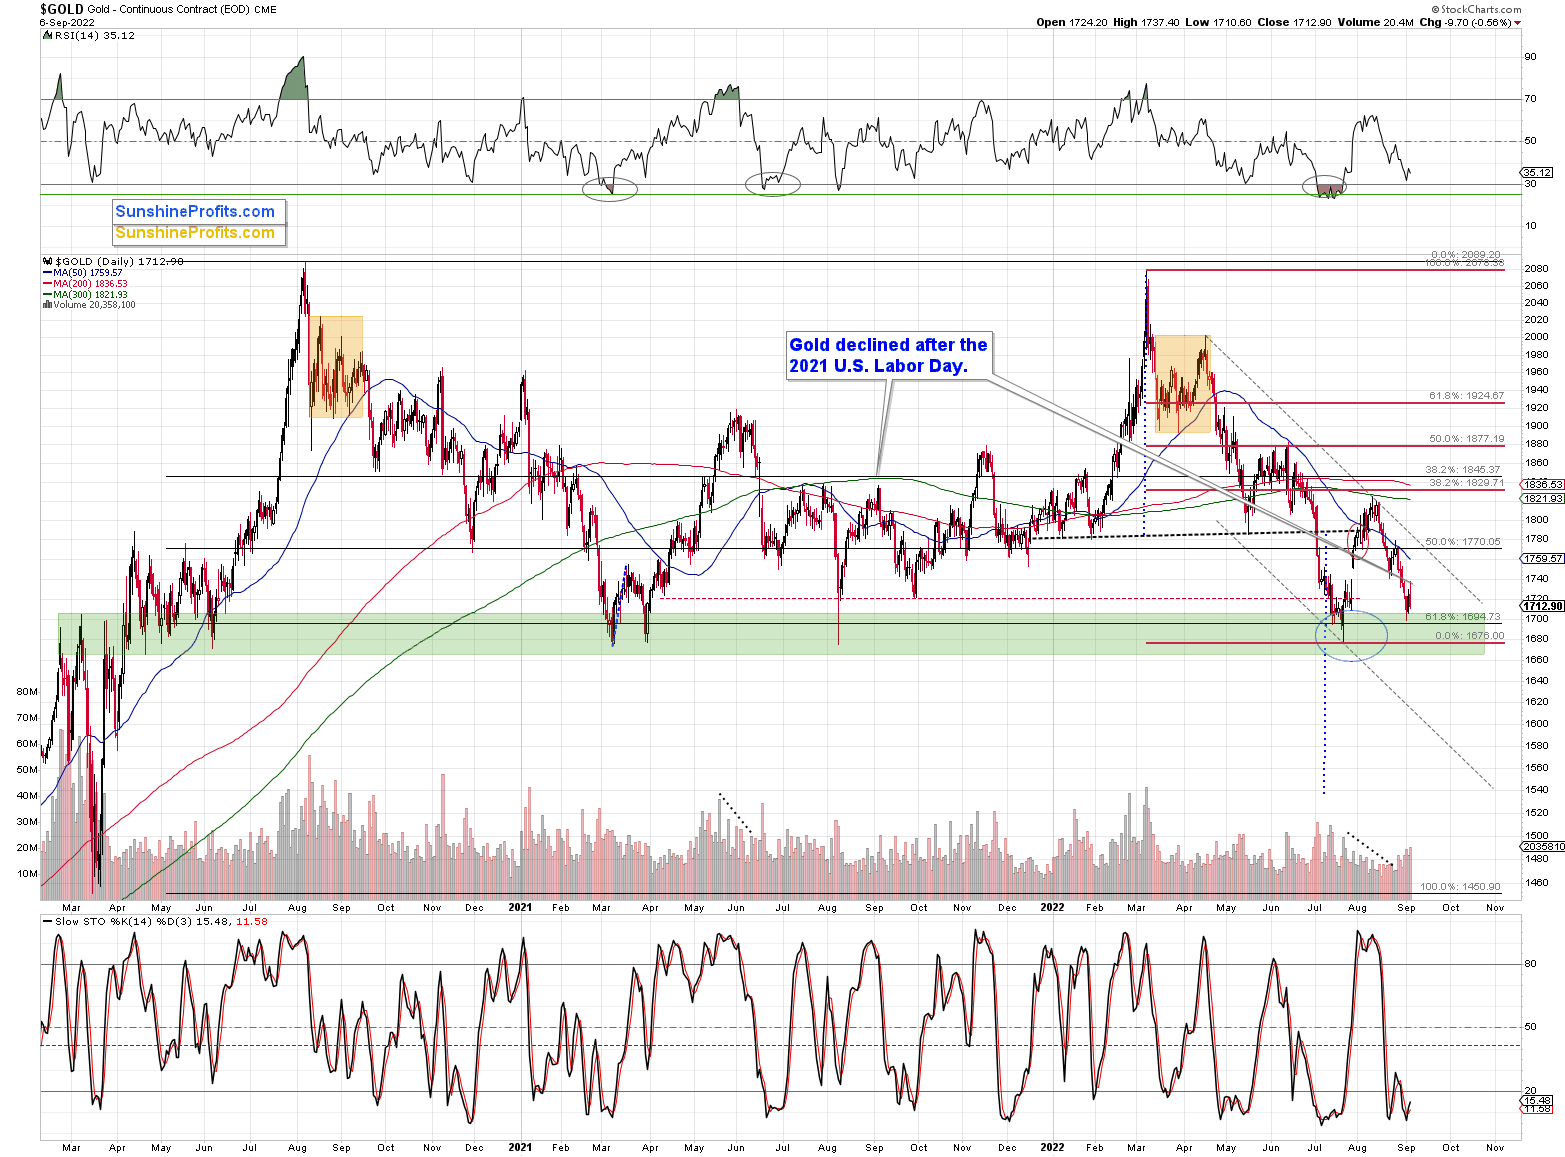
As I wrote above, gold reversed and declined yesterday. However, it also did something else – it declined on volume that was relatively big after a daily upswing that took place on relatively low volume.
The volume readings confirm the bearish nature of the recent back-and-forth trading.
The medium-term downtrend simply remains intact.
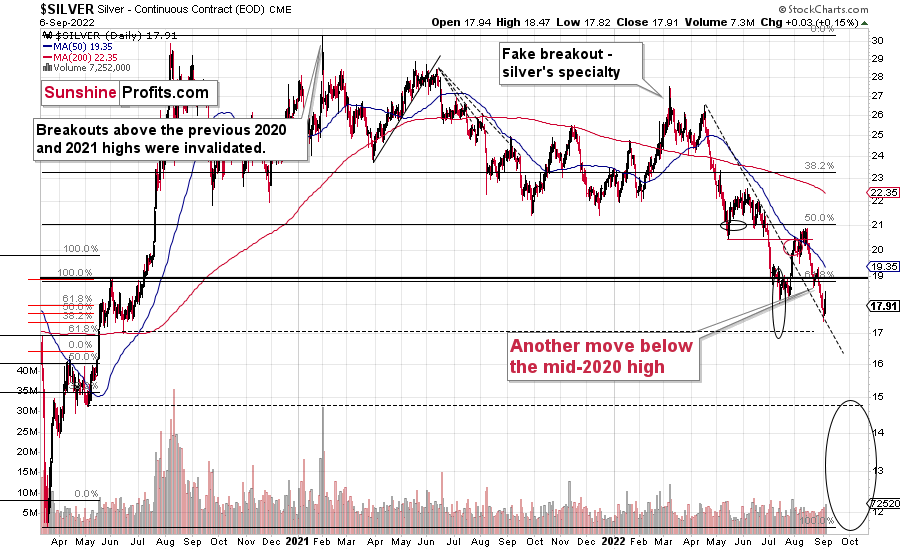
Silver did something similar.
The white metal moved up to $18.47 on an intraday basis, but then declined and ended the day only $0.03 higher. This means that it declined by $0.44 before the closing bell, Aad it closed below the July lows. The breakdown below them was therefore just verified. This is bearish.
What about junior miners? They declined more visibly, ending the session 2.29% lower, thus further increasing our profits from short positions in them. The GDX was down by 1.47%, and the HUI Index by 1.08%.
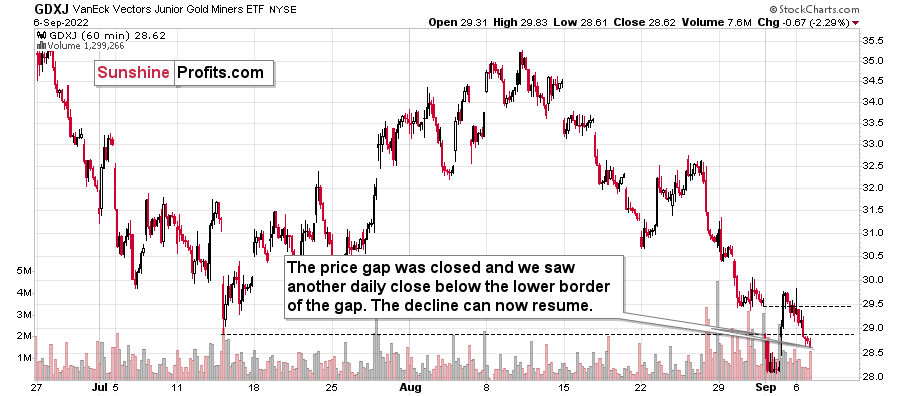
Let’s zoom in – the chart below is based on hourly candlesticks.
What's Up With Gold Stocks?
In yesterday’s analysis, I commented on the good technical reason why the GDXJ ETF has moved higher recently:
The GDXJ moved higher and briefly moved above the previous trading day’s closing price and its intraday low. Then, the GDXJ moved back down and closed below those levels.
The important extra detail here is that Thursday’s session started with a price gap. It’s important because prices tend to “want” to close the price gap before continuing with their current trend. “Closing the gap” means temporarily moving to the levels and actually trading where there was no trading before (thus, the gap). That’s exactly what we saw on Friday.
What we haven’t seen on Friday is an invalidation of the breakdown below the July lows in closing price terms. Consequently, the breakdown was not invalidated but verified.
This is not a bullish price action, but something bearish and quite normal. Consequently, the outlook remains bearish.
Indeed, the value of the GDXJ ETF declined yesterday as well. What’s particularly interesting is that while closing below the lower border of the price gap, the GDXJ also closed below the intraday low of July. This means that the breakdown below those lows just became even more believable.
This, together with reversals seen in gold and silver, paints a very bearish picture for the following weeks – and quite likely also for the following days.
Thank you for reading our free analysis today. Please note that the above is just a small fraction of the full analyses that our subscribers enjoy on a regular basis. They include multiple premium details such as the interim targets for gold and mining stocks that could be reached in the next few weeks. We invite you to subscribe now and read today’s issue right away.
Sincerely,
Przemyslaw Radomski, CFA
Founder, Editor-in-chief


Gold Investment News
Delivered To Your Inbox
Free Of Charge
Bonus: A week of free access to Gold & Silver StockPickers.
Gold Alerts
More-
Status
New 2024 Lows in Miners, New Highs in The USD Index
January 17, 2024, 12:19 PM -
Status
Soaring USD is SO Unsurprising – And SO Full of Implications
January 16, 2024, 8:40 AM -
Status
Rare Opportunity in Rare Earth Minerals?
January 15, 2024, 2:06 PM

