
tools spotlight

-
Will the Fed’s Rate Hike Delay the Fall in the Gold Market?
September 20, 2022, 9:13 AMWhile the 2013 analogy remains valid, the expected decline in gold stocks will probably be delayed. It depends on the decision of the US central bank.
If you read my yesterday’s and/or Friday’s analyses, you know that the markets expect the rates to be increased by at least 0.75% this week. As they are increased by 0.75%, some market participants are likely to be surprised, and the overall implications could be bullish for the stock market and for other markets (including junior miners).
The above could be preceded by a powerful slide. The thing is that this huge slide has not happened so far this week. This means that perhaps the markets want to react in a different way. Please remember that no matter how well-researched a given forecast is, there’s no guarantee that it will be realized. It’s best to keep one’s eyes open and adjust the forecast frequently, based on new information.
In the current situation, the “new information” is that the decline in precious metals and stocks is not materializing this week.
This suggests that the markets might want to react differently than I described them in my recent analyses.
So, I’ve been thinking if there’s a way for the situation to develop in line with 2013 that doesn’t involve immediate decline, but at the same time makes sense in light of the upcoming rate hike.
I found such a scenario.
First of all, history doesn’t have to repeat itself to the letter, but rather it can rhyme. So, while the decline materialized immediately after similar price patterns in 2013, a 1 or 2 week of delay doesn’t change much, if anything, in the case of the analogy.
Second, I think I focused too much on the stock market’s performance in connection with the midterm elections in the US. Voters are most concerned with inflation. Period.
Consequently, instead of some kind of dovish message from the Fed, we could get a hawkish one in order to make people think that the powers that be are pushing hard to fight inflation.
In fact, if the stock market declines now, before the elections, but the powers that be can brag about some inflationary success, it could be framed as a situation in which “the people” are most important and “the wealthy” are made to help “the people.” After all, stocks are mostly owned by the wealthy, and inflation is a concern for everyone (but many research papers point to lower-income families being hit hardest).
So, actually, it might make sense to now hit hard on inflation at the stock market’s expense.
The third and final point here is that the markets sometimes wait before a certain announcement before they get back to their original trends. We’ve seen this numerous times in the precious metals market. In this case, sometimes it doesn’t even matter what the news is – the key thing is that the tension and uncertainty regarding the news is gone once it’s announced.
Combining all the above provides us with a scenario in which not much happens until Wednesday’s rate hike announcement, and then, regardless of the initial reaction, the big decline in the precious metals market continues. And yes, the “initial reaction” could mean that we’d get a 1-2 day (or so) rally.
Let’s check how this fits the GDXJ’s and gold’s charts.
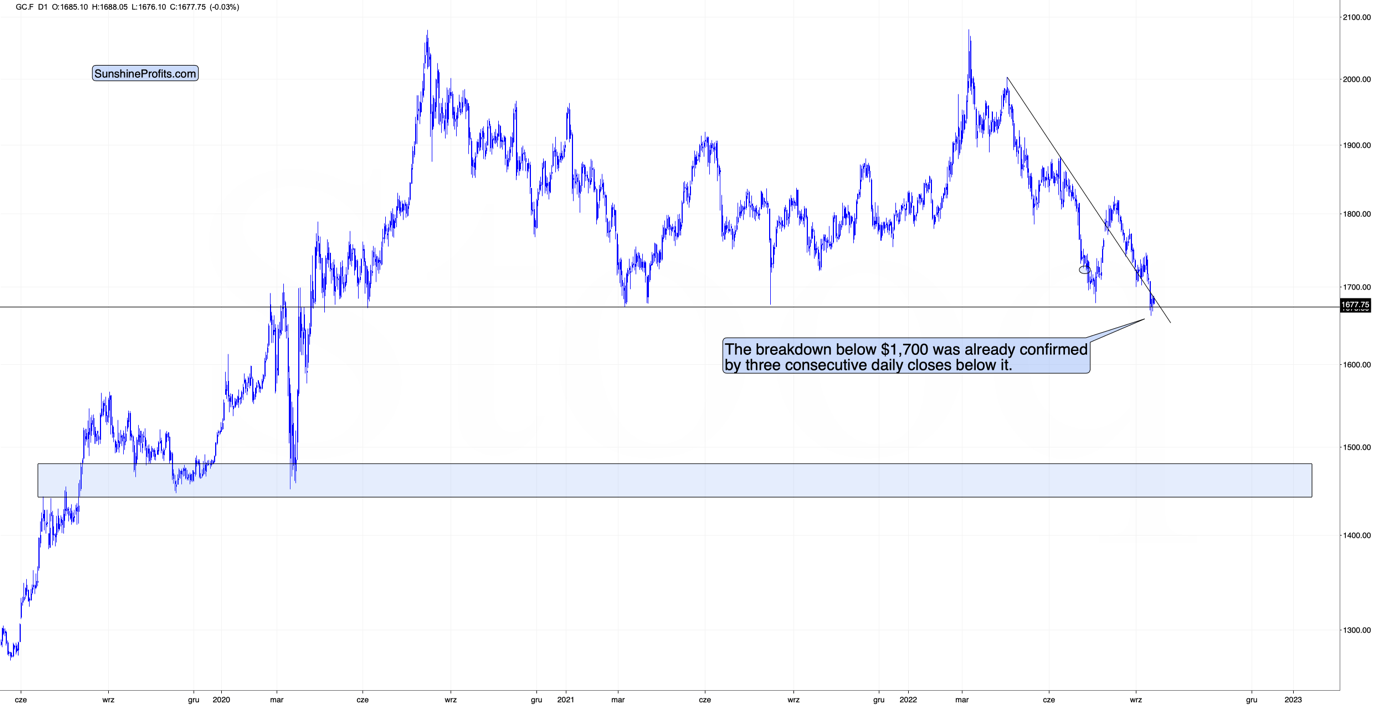
Gold is consolidating below $1,700. It closed below this level for three consecutive trading days, and we saw a weekly close below this level. This has not happened previously. Each attempt to break back below this level (since 2020) was quickly invalidated.
This time is already different.
Technically, this is extremely bearish.
So, why doesn’t gold slide from here? Probably due to the uncertainty surrounding the interest rate hike.
While gold prices are consolidating below their previous lows, the GDXJ is not below the early-September lows, which might appear bullish. However, is it?
The early-September low is not the only reference point out there. The lows through which gold broke are the 2021 lows. The GDXJ ETF is trading many dollars below those analogical lows. It’s not strong relative to gold, even though the last couple of days might indicate this.
The thing is that the GDXJ simply rallied substantially in the first half of September, likely due to the stock market’s rally. Thus, it resumed the decline from a relatively high price level (about $32).
Stocks are not below their early-September low at this moment, so it’s not that odd to see junior miners there as well.
While the stocks-juniors link might have had a positive impact on GDXJ’s prices recently, it’s likely to make them decline more in the future. Remember how stocks plunged in 2008? Or in 2020? And in what manner were they destroyed?
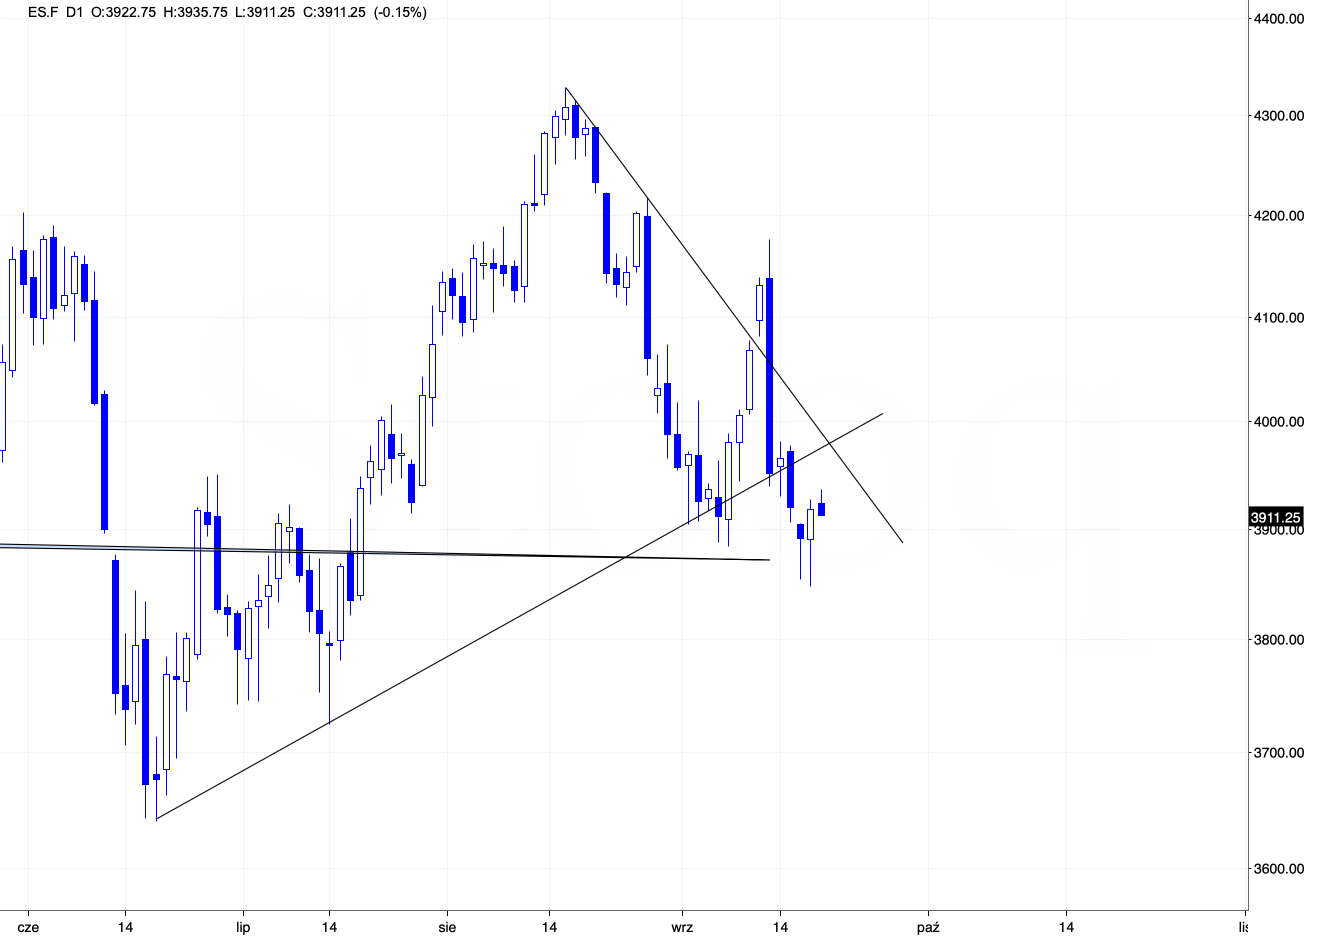
There’s one more interesting thing on the above S&P 500 futures chart. Namely, there’s a triangle-vertex-based reversal scheduled for tomorrow. This perfectly fits the scenario in which stocks move higher today or tomorrow (or they could do pretty much nothing), and then they slide in the following part of the week, after the rates are increased.
The implications for the very near term (next 1-3 days) are unclear, but they are bearish for the coming days.
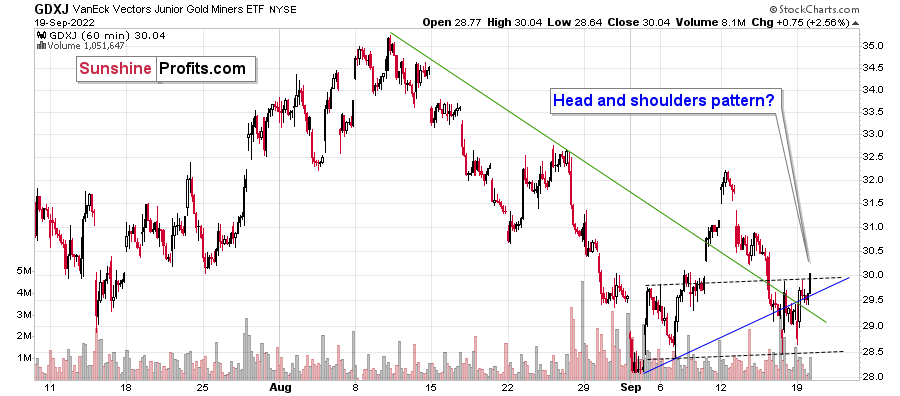
Also, looking at the 1-hour candlestick GDXJ chart, we see that the price might be forming a head-and-shoulders pattern, which is bearish – once it’s completed. In this case, it would take a decline below $28.5 for the formation to be completed, and the price would be likely to decline to at least $25. Based on other charts, the most possible target is about $20.
All in all, I wouldn’t bet the farm on a situation in which the precious metals sector declines immediately, but I continue to think that keeping short positions in the GDXJ at this time is very much justified from the risk to reward point of view. We’re aiming to profit from a huge decline here, not on day-trading – at least that’s my approach. Naturally, you can do with your capital whatever you want, but in my view, the big move provides the greatest risk to-reward-ratio.
Thank you for reading our free analysis today. Please note that the above is just a small fraction of the full analyses that our subscribers enjoy on a regular basis. They include multiple premium details such as the interim targets for gold and mining stocks that could be reached in the next few weeks. We invite you to subscribe now and read today’s issue right away.
Sincerely,
Przemyslaw Radomski, CFA
Founder, Editor-in-chief -
Wall Street Has Figured Out What It Takes to Fight Inflation
September 19, 2022, 9:07 AMThe scales have finally fallen from investors' eyes, and they saw that the Fed had to be hawkish. However, do they take into account the 4.5% FFR?
High Five
With the crowd reacting rather than anticipating, consensus rate hike expectations have materially shifted on Wall Street. Moreover, while I’ve been warning for months that the U.S. federal funds rate (FFR) needed to go much higher than many expected, suddenly, the consensus aligns with our way of thinking. To explain, I wrote on Aug. 1:
While the consensus assumes the Fed is near the end of its rate hike cycle, the Consumer Price Index (CPI) is on the fast track to 2% and a 3% FFR will be enough to capsize inflation, market participants are living in fantasy land.
For example, I’ve warned on numerous occasions that demand is much stronger than the consensus realizes. With Americans’ checking account balances at unprecedented all-time highs and the Atlanta Fed’s wage growth tracker hitting an all-time high in June, the FFR needs to go meaningfully above 3%. I wrote on Jul. 25:
With more earnings calls showcasing how the situation continues to worsen, market participants don’t realize that the U.S. federal funds rate needs to hit ~4.5% or more for the Fed to materially reduce inflation. For context, the consensus expects a figure in the 2.5% to 3.5% range.
Thus, what a difference ~two months makes. With strategists increasing their FFR projections and the new consensus calling for 4% to 5% (roughly 4.5% is now priced in), the crowd is always late to the party.
Please see below:
 Source: Barron’s
 To that point, while I warned repeatedly that the FFR needs to eclipse the inflation rate to curb the pricing pressures, suddenly, Wall Street is waking up to this reality as well.
Please see below:
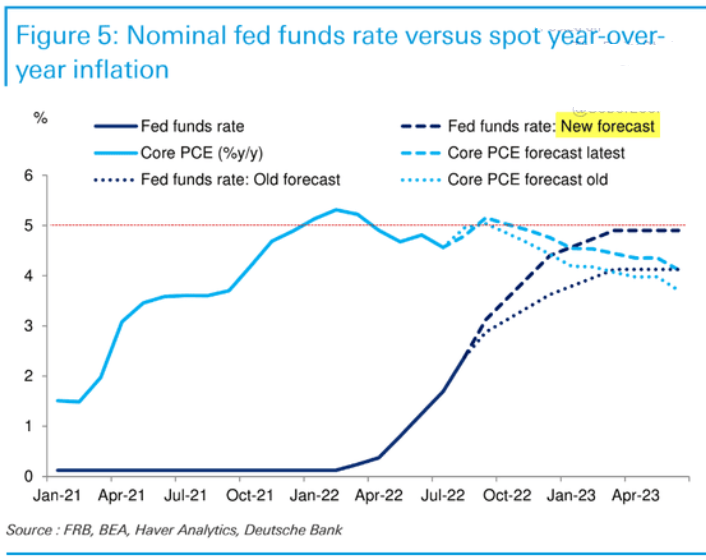
To explain, Deutsche Bank increased its FFR projection from ~4% to 5% and told clients how the FFR has always risen above the year-over-year (YoY) percentage change in the core Personal Consumption Expenditures (PCE) Index to reduce inflation. Furthermore, with the core PCE peaking at 5.31% (so far), market expectations have moved closer to reality.
More importantly, a realization is profoundly bearish for gold, silver, mining stocks and the S&P 500. For example, the U.S. 10-Year real yield hit another 2022 high of 1.07% on Sep. 16, and the metric is only 10 basis points away from its 2018 high. In addition, further rate hikes are bullish for the USD Index and the U.S. 10-Year real yield, which means the PMs confront a treacherous fundamental environment in the months ahead.
On top of that, while I warned that consumer demand was much more resilient than the consensus realized, the cash hoard built up by American households will make the Fed’s inflation fight highly arduous. To explain, I wrote on Mar. 31:
There is a misnomer in the financial markets that inflation is a supply-side phenomenon. In a nutshell: COVID-19 restrictions, labor shortages, and manufacturing disruptions are the reasons for inflation’s reign. As such, when these issues are no longer present, inflation will normalize and the U.S. economy will enjoy a “soft landing.”
However, investors’ faith in the narrative will likely lead to plenty of pain over the medium term. For example, I’ve noted for some time that the U.S. economy remains in a healthy position; and with U.S. consumers flush with cash and a red-hot labor market helping to bloat their wallets, their propensity to spend keeps economic data elevated.
Likewise, while most investors assumed that consumer spending and inflation would fall off a cliff when enhanced unemployment benefits ended in September, the reality is that neither will die easily.
U.S. households have nearly $3.89 trillion in their checking accounts. For context, this is 288% more than Q4 2019 (pre-COVID-19). As a result, investors misunderstand the amount of demand that’s driving inflation.
To that point, the Fed updated the data on Sep. 9; and with the metric hitting another all-time high, American households have nearly $4.708 trillion in their checking accounts (as of Q2), a 357% increase from Q4 2019.
Please see below:
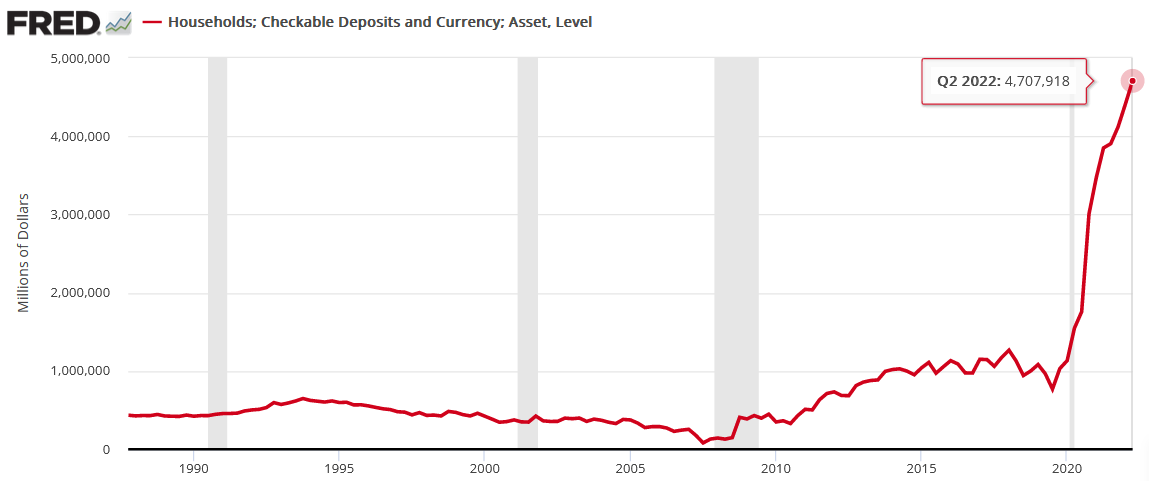
Furthermore, the Q2 figure is 6.7% higher than Q1. So while the old narrative assumed that Americans had exhausted all of their spending power, and therefore, inflation would subside, the reality is that Americans have more money in their checking accounts now than in 2021. As such, the Fed will have to keep its foot on the hawkish accelerator, and a realization has ominous implications for risk assets.
More Is Needed
With the next FOMC meeting scheduled for Sep. 20-21, the real story is whether or not officials increase their median FFR projection. Moreover, with inflation slowing at a snail’s pace, a higher-for-longer FFR is needed to cool the pricing pressures.
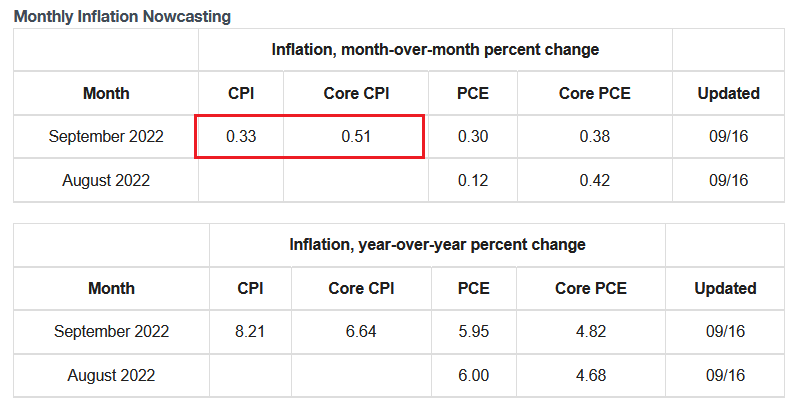
For example, the Cleveland Fed estimates that the headline and core CPIs will increase by 0.33% and 0.51% month-over-month (MoM), respectively, when September’s data is released on Oct. 13. Thus, the Fed’s 2022 rate hikes have done little to eliminate inflation outside of cooling the U.S. housing market.
Please see below:
 Source: Cleveland Fed
In addition, Bank of America projects that the core CPI will end 2022 at 5.9% YoY. Likewise, with the headline CPI projected to end the year even higher, the figures are nowhere near 2%.
Please see below:
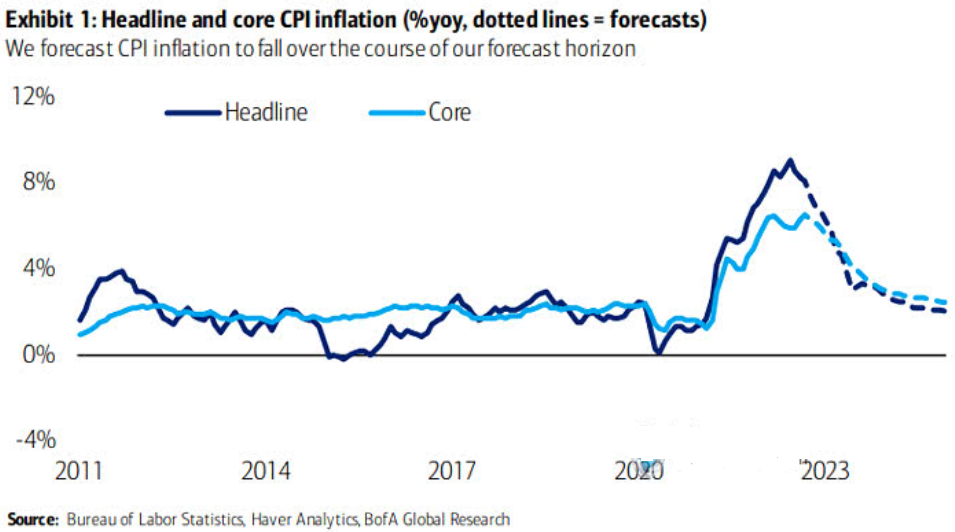
To explain, the dark and light blue lines above track the realized headline and core CPIs, while the dashed lines above represent Bank of America’s projections. If you analyze the right side of the chart, you can see that the headline and core CPIs aren’t expected to approach 2% until 2024 and beyond. As a result, the Fed can’t wait that long and will need to act in the interim to normalize the metrics.
Speaking of which, I noted above how the Cleveland Fed expects the headline CPI to increase by 0.33% MoM in September. Well, if the index maintains a similar monthly trajectory, the headline CPI will still be north of 4% YoY in Q2 2023.
Please see below:
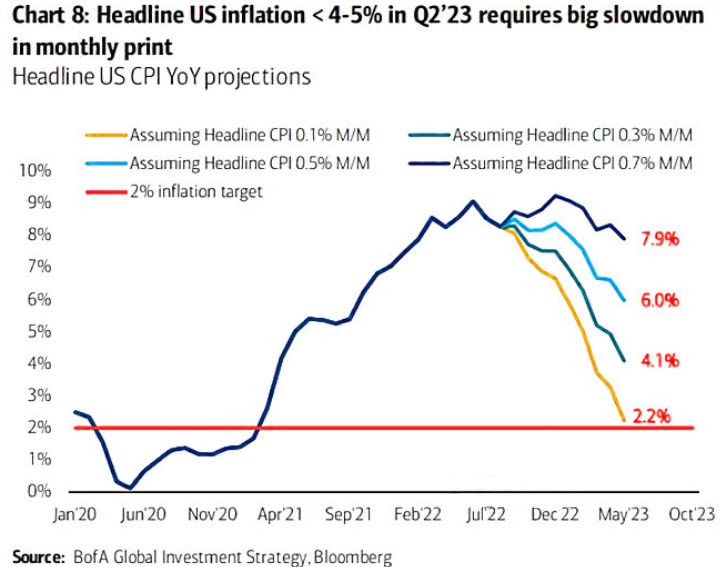
To explain, the various lines above track the YoY path of the headline CPI, assuming constant MoM prints. If you analyze the teal line, 0.30% MoM readings will equate to a 4.1% YoY reading in Q2 2023.
However, it’s important to remember that while lower commodity prices are bearish for the headline CPI, they’re bullish for the core CPI. Remember, less money spent on oil, gas, and food affords Americans more cash to spend on discretionary items. Therefore, it’s no surprise that the headline CPI declined YoY in August (the red line below), while the core CPI increased YoY in August (the green line below).
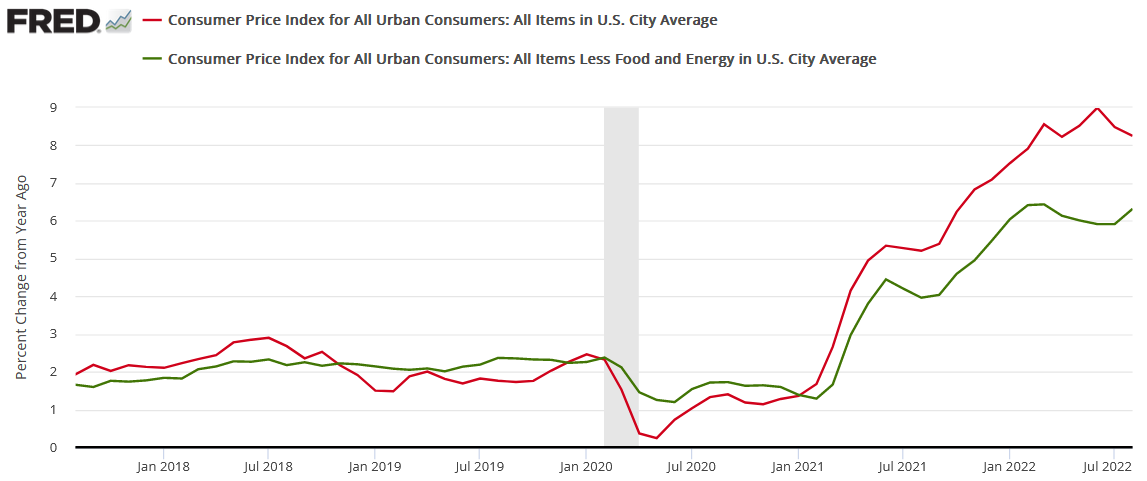
Thus, even though a headline CPI of 4.1% is roughly double the Fed’s 2% target, there is much more to this inflation story than food and energy. As such, the Fed should target Americans’ discretionary spending to alleviate inflation. Since 1954, every inflation fight has ended in a recession.
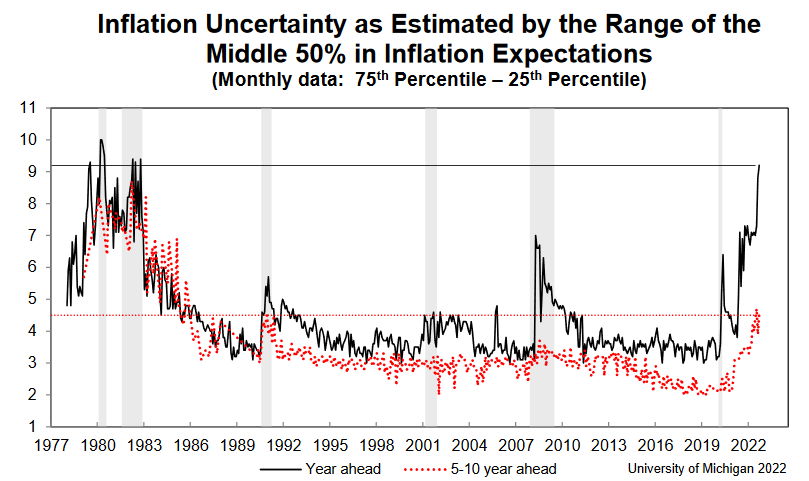
Finally, the University of Michigan released its Consumer Sentiment Index on Sep. 16. Moreover, while Americans’ inflation expectations declined, the report revealed:
“It is unclear if these improvements will persist, as consumers continued to exhibit substantial uncertainty over the future trajectory of prices. Uncertainty over short-run inflation reached levels last seen in 1982, and uncertainty over long-run inflation rose from 3.9 to 4.5 this month, well above the 3.4 level seen last September.”
As a result, with Americans extremely anxious about the year-ahead inflation outlook (the black line below), the Fed has plenty of work to do to restore its credibility.
The Bottom Line
While the crowd now sees things from our perspective, the hawkish ramifications of a 4.5% to 5.5% FFR are still far from priced in. For example, reducing Americans’ discretionary spending is profoundly bearish for S&P 500 companies’ earnings. Therefore, while households still have plenty of money to spend, weakening the U.S. labor market, reducing wages, and forcing Americans to draw down their checking account balances should have drastic implications in the months ahead.
Furthermore, the liquidity beneficiaries should suffer the most, and gold, silver, and mining stocks are highly sensitive to the performance of the USD Index and the U.S. 10-Year real yield.
In conclusion, the PMs were mixed on Sep. 16, as the GDXJ ETF ended the day in the red. Moreover, with the Fed hawked up and the U.S. 10-Year real yield continuing its ascent, the PMs’ medium-term outlooks continue to worsen. As such, we expect lower lows to materialize in the months ahead before long-term buying opportunities emerge.
Thank you for reading our free analysis today. Please note that the above is just a small fraction of the full analyses that our subscribers enjoy on a regular basis. They include multiple premium details such as the interim targets for gold and mining stocks that could be reached in the next few weeks. We invite you to subscribe now and read today’s issue right away.
Sincerely,
Przemyslaw Radomski, CFA
Founder, Editor-in-chief -
Gold Fell Under Its 2021 Lows. Ready for the Real Slide?
September 16, 2022, 7:23 AMIt seems that the biggest part of the 2013-like decline is taking place in the gold market. Is it a harbinger of the next phase of the yellow metal’s fall?
Welcome to this week's flagship Gold & Silver Trading Alert. Predicated on last week’s price moves, our most recently featured outlook remains the same as the price moves align with our expectations. On that account, there are parts of the previous analysis that didn’t change at all in the earlier days, which will be written in italics.
The full version of today’s analysis includes the key price targets (just updated) for junior mining stocks (GDXJ) as well as for silver.
Today’s issue will be a bit shorter but also more focused on what just happened. Given that gold just broke below not only the 2022 lows but also the 2021 lows, it seems that the most volatile part of the medium-term decline is happening right now, so I thought that you’d appreciate extra details about the short run more than another long-term recap.
Even if you usually skip the text and get right to the summary, I suggest that you read today’s analysis in full.
If you’re looking for the long-term recap, please note that practically everything that I wrote about the long term last Friday remains up-to-date today as well – the markets simply did what I wrote back then. In fact, the markets (in particular, the precious metals market) have been doing what I’ve been writing about for months now. Anyway, here’s the link to last Friday’s analysis, should you want to revisit it.
Last Friday’s analysis was entitled “The Medium-Term Downtrend Can Resume Anytime in the Gold Market” – and that’s exactly what happened.
Still, let’s start today’s analysis with a recap of what recently happened on the fundamental front.
The Weekly Fundamental Roundup
With inflation showcasing its might once again, this week was all about dashed hopes for a resumption of the bull market. Moreover, with gold, silver, mining stocks, and the S&P 500 suffering sharp drawdowns on Sep. 15, investors learned the hard way that normalizing unanchored inflation is extremely difficult.
In addition, while the permabulls focused their attention on the Russia-Ukraine conflict, I warned on Apr. 11 that the domestic fundamental environment was profoundly bearish for the PMs. I wrote:
With real interest rates poised to turn positive in the coming months, gold should suffer profoundly once its war premiums unravel.
The historical fundamental playbook shows:
- When a crisis erupts, the Fed cuts interest rates and commences QE;
- Real yields turn deeply negative;
- Gold rallies sharply;
- As the Fed normalizes monetary policy, real yields surge and gold plunges.
Please see below:
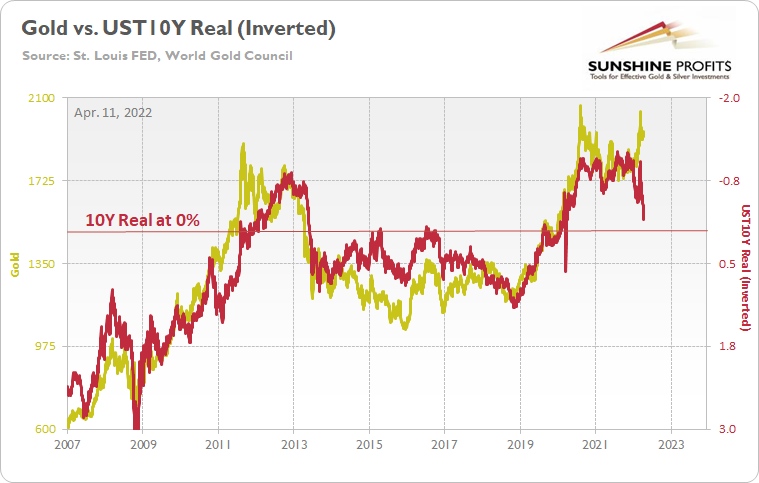
To explain, the gold line above tracks the price tallied by the World Gold Council, while the red line above tracks the inverted U.S. 10-Year real yield. For context, inverted means that the latter's scale is flipped upside down and that a rising red line represents a falling U.S. 10-Year real yield, while a falling red line represents a rising U.S. 10-Year real yield.
Moreover, while I've shown variations of this chart before, the long-term implications are profound. For example, if you analyze the left side of the chart, you can see that the U.S. 10-Year real yield soared and gold plunged during the global financial crisis (GFC). However, when the Fed launched QE and the U.S. 10-Year real yield sank to an all-time low, gold hit a new all-time high along the way.
Furthermore, the current situation is a spitting image. When Fed Chairman Jerome Powell performed a dovish pivot in late 2018, the U.S. 10-Year real yield suffered. Then, when the Fed fired its liquidity bazooka in March 2020, it pushed the metric to another all-time low. And surprise, surprise, gold hit another all-time high.
However, we're now in stage four of the historical fundamental playbook. With the Fed normalizing policy, the U.S. 10-Year real yield has surged in recent weeks. Moreover, the Fed needs to push the metric above 0% to curb inflation.
To that point, with the hawkish forecast becoming a hawkish reality, the U.S. 10-Year real yield closed above 1% on Sep. 15 for the first time since 2018. Likewise, while gold closed at a new 2022 low, the yellow metal is still far from reflecting its fundamental value.
Please see below:
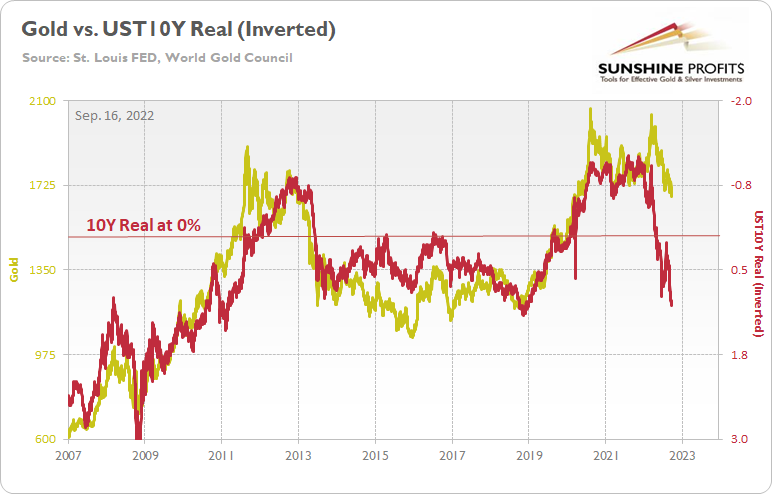
To explain, while the GDXJ ETF declined substantially in 2021 and 2022, gold has remained relatively uplifted. Moreover, with the U.S. 10-Year real yield near its 2018 highs, gold was meaningfully below $1,500 during that time period. As a result, the fundamentals align with the technicals, and more downside should confront gold, silver, and mining stocks over the medium term.
Hawkish Fuel
With the U.S. labor market demonstrating immense resiliency, the employment situation continues to support additional rate hikes in the months ahead. Furthermore, a realization is bullish for the USD Index and the U.S. 10-Year real yield and bearish for the PMs.
For example, unanchored inflation means that one-half of the Fed's dual mandate is materially out of whack. However, initial unemployment claims sank to their lowest level since May on Sep. 15, and the data highlights how the U.S. labor market is not weakening at a pace that would materially reduce wage inflation.
Therefore, the second half of the Fed's dual mandate remains healthy, and that should allow officials to focus their attention on curbing inflation.
Please see below:
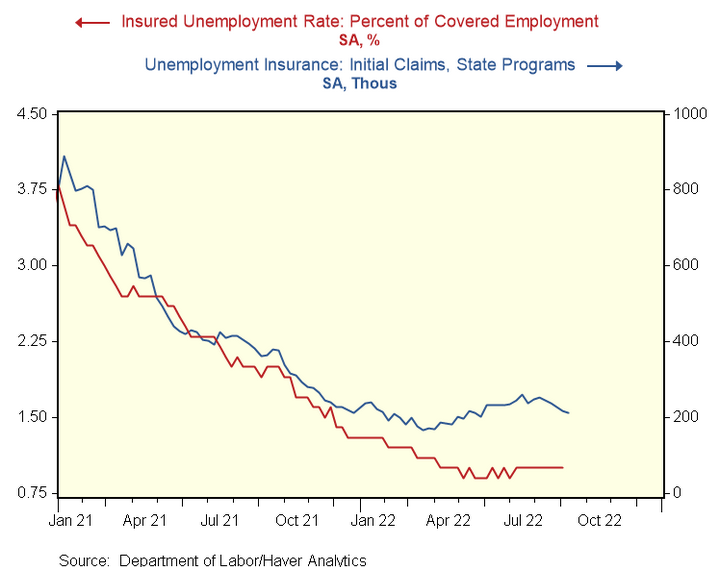
To explain, the blue line above tracks initial unemployment claims while the red line above tracks the insured unemployment rate. For context, the Fed defines the latter as “the number of people currently receiving unemployment insurance as a percentage of the labor force.” Thus, with joblessness far from crisis levels, the labor market outlook should keep the Fed’s foot on the hawkish accelerator.
As further evidence, the New York Fed released its Empire Manufacturing Survey on Sep. 15. The headline index increased from -31.3 to -1.5. Moreover, while the “Price indexes moved notably lower, pointing to a deceleration in price increases,” the report revealed that “labor market indicators pointed to a modest increase in employment.”
As a result, with an already tight U.S. labor market continuing to add jobs, it creates a Goldilocks environment where the Fed can raise interest rates without worrying about the political consequences of hurting the average American.
Please see below:
 Source: NY Fed
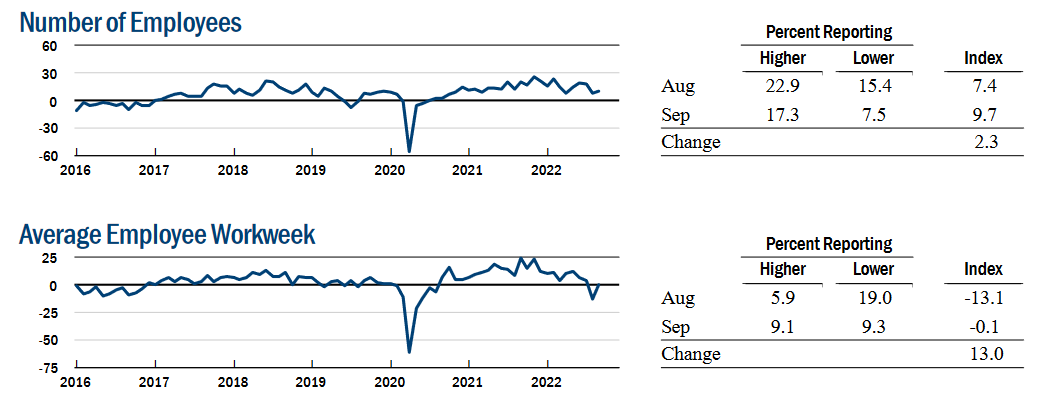
Continuing the theme, the Philadelphia Fed released its Manufacturing Business Outlook Survey on Sep. 15. The headline index declined from 6.2 in August to -9.9 in September. Moreover, while the "prices paid index declined for the fifth consecutive month," the "prices received index moved up 6 points to 29.6."
Therefore, "the indicators for prices paid and prices received remained positive but indicate less widespread increases in prices compared with previous months."
However, while inflationary pressures subsided somewhat, employment remained resilient. An excerpt read:
"On balance, the firms continued to report increases in employment, but the employment index declined from 24.1 to 12.0. Nearly 15% of the firms reported increases in employment, compared with 3% that reported decreases; 83% reported no change."
As such, a net ~12% of Philadelphia manufacturers increased their headcount in September, while 83% kept their staffing levels constant. Thus, the kind of labor market destruction that would allow the Fed to pivot is not present in the data.
To that point, this month's special questions showed that "the share of firms reporting expected increases in third-quarter production (56%) exceeded the share reporting decreases (22%). Likewise, when asked about the factors "constraining capacity utilization in the current quarter," the overwhelming majority cited a lack of labor supply and supply-chain disruptions as moderate and significant issues. Therefore, the findings are profoundly inflationary.
Please see below:
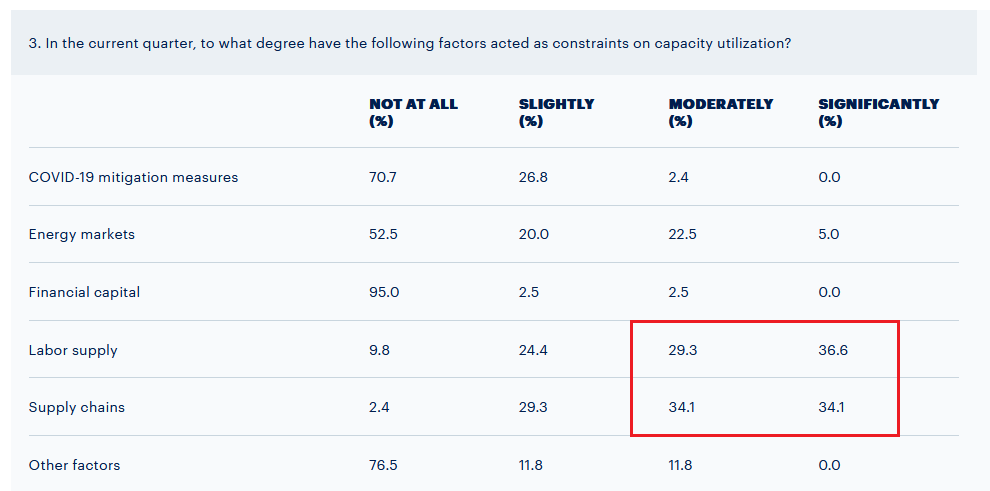 Source: Philadelphia Fed
To explain, nearly 66% of Philadelphia manufacturers cited a lack of labor supply as a moderate or significant issue limiting their growth potential. In addition, supply-chain disruptions are also highly problematic. However, with the former highlighting how demand still outstrips supply in the U.S. labor market, the Fed is a long way from normalizing wage inflation, and therefore, output inflation.
Remember, U.S. consumers can afford price increases that match their wages. So, unless the Fed reduces wage inflation to 2%, output inflation is unlikely to fall to 2%. Furthermore, the labor shortage highlights why a 2.5% U.S. federal funds rate (FFR) is nowhere near neutral and why the metric needs to go substantially higher.
Finally, I noted on Sep. 13 that Americans continue to spend at a furious pace. I wrote:
Mastercard released its SpendingPulse U.S. retail sales report on Sep. 12. An excerpt read:
“The holiday season builds on the momentum seen this summer, with U.S. retail sales excluding automotive in August up +11.7% YoY and +20.4% compared to 2019. Online sales in August grew +8.9% and +100.2% respectively, compared to the same periods. Experiential sectors in particular – including Restaurants, Airlines and Lodging – saw strong double-digit growth.”
Please see below:
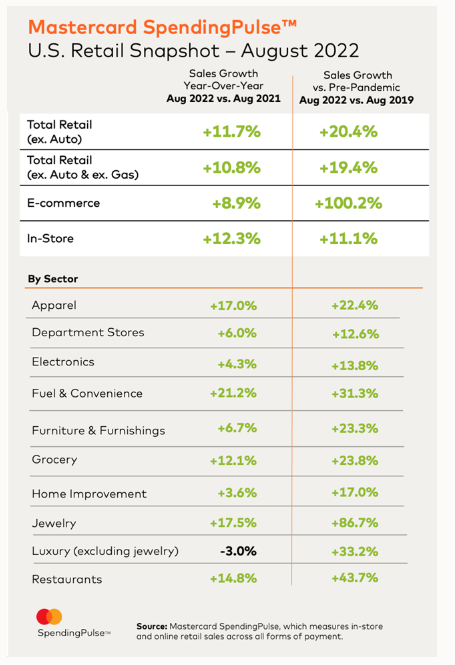
Thus, with U.S. consumers continuing to splurge on their favorite items, we’re nowhere near the demand destruction that would alleviate inflation. Moreover, while I’ve warned repeatedly that investors miscalculated the demand side of the inflation equation, Mastercard’s spending data highlights why the Fed’s fight will be so difficult.
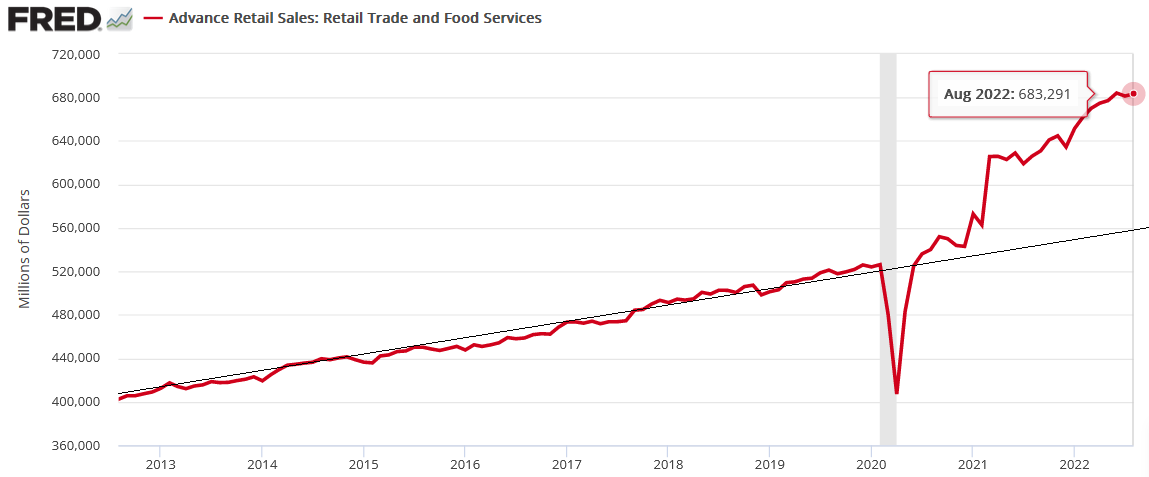
Likewise, the U.S. Consensus Bureau released its retail sales report on Sep. 15. Moreover, with August’s data up by 0.3% month-over-month (MoM), consumer spending remains well above its 10-year trend. As a result, the Fed is a long way from solving its inflation conundrum.
The Bottom Line
While investors assumed that demand would fall off a cliff, the reality is that the U.S. labor market and consumer spending are extremely resilient. Therefore, outside of cooling the U.S. housing market, the Fed’s 2022 rate hikes have done little to normalize wage inflation or materially reduce Americans’ spending habits.
Thus, while the USD Index and the U.S. 10-Year real yield have been among the best-performing assets in 2022, they need to rise further to alleviate the pricing pressures. As such, investors drastically underestimate the challenges that lie ahead, and the PMs should suffer mightily as more hawkish policy commences.
What to Watch for Next Week
With more U.S. economic data releases next week, the most important are as follows:
- Sep. 21: FOMC meeting, Summary of Economic Projections (SEP), Chairman Jerome Powell’s press conference.
While the latest Consumer Price Index (CPI) release elicited fears of a 75 or 100 basis point rate hike, the real story is the Fed’s SEP. It will be interesting to see if officials increased their 2023 median projection for the FFR. Likewise, Powell’s presser is also immensely important.
- Sep. 22: KC Fed manufacturing index
Similar to the New York and Philadelphia Fed’s regional reports, the KC Fed’s data will highlight the growth, employment, and inflation developments in Missouri.
- Sep. 23: S&P Global Composite PMI
S&P Global's data is obtained from a nationwide survey, so it's more relevant than the regional reports and is one of the most important releases of the week.
All in all, economic data releases impact the PMs because they impact monetary policy. Moreover, if we continue to see higher employment and inflation, the Fed should keep its foot on the hawkish accelerator. If that occurs, the outcome is profoundly bearish for the PMs.
The FOMC is Coming – So What?
Let’s take an extra look at the paragraph about Sep. 21. I put two parts thereof in bold.
The key thing is that the market now expects interest rates to be raised by at least 0.75%. In fact, right now, about 3/4 of market participants now expect the rates to be hiked by 0.75%, and about 1/4 expect that the rates will be hiked by 1%.
Please remember that the markets’ participants’ expectations tend to move from one extreme to the other, and while previously people became way too dovish, it seems that they have now become excessively bearish with regard to the short term.
Since it’s not clear for the market what’s going to happen, it will be surprised either way. A positive surprise would be bullish for stocks and other markets (like junior miners!), and a negative surprise would be bearish for stocks and other markets (like junior miners!).
The U.S. midterm elections are just around the corner, remember? Is the Fed likely to negatively surprise the market shortly before the elections? That seems very unlikely to me.
The Fed is now hiking interest rates by 0.75%, which means that it will be relatively easy – from the psychological point of view – it’s just the same thing over and over again. It will also be easy to defend when someone asks questions about the decision. “We steadily continue our policy as we’re approaching our goals, and those goals have not been met” – sounds believable, right? And it needs to sound believable if the Fed wants to “avoid the blame” for the stock market crash (that’s going to happen anyway).
So, in my opinion, the Fed won’t hike rates by 1% next week but rather by 0.75%. And then perhaps it will simply continue hiking in this way until the stocks crash and the public “screams” for some kind of relief.
But let’s not go that far. For now, the key thing is that while the rates are likely to be raised exactly by 0.75% next week, the markets are also likely to get a bullish trigger when this decision is made. And – given the looming elections – I wouldn’t be surprised to also hear Powell saying something bullish/dovish during his press conference.
Given the data on one hand and the election-related pressure on the other hand, the optimal scenario for him seems to be to hike the rates, but pretend that he didn’t. As an alternative to what I wrote above, the Fed could hike by 1% but then be very dovish in the speech, stating that they will consider pausing the hikes or something like that.
Either way, based on both the above-mentioned scenarios, the stock market would be likely to bottom once the rates are hiked. Not because that’s fundamentally bullish, but because that will be more dovish than what is being expected on average. In other words, some people will get their expectations fulfilled, but some will be surprised – in a dovish manner, as a 0.75% hike is smaller than a 1% hike.
And that’s only the event itself that I’ve covered so far.
There’s also the market’s tendency to act on the rumor and then reverse on the fact. So, the above – bottom of the rate hike announcement that is already being expected – could happen even if everyone expected the Fed to hike by exactly 0.75%.
In other words, the markets tend to get ahead of themselves.
In this case, it’s quite likely that the markets are about to decline more than they “should” based on the expectations of about a quarter of market participants that the rates are going to be hiked by 1%.
This makes the above-mentioned scenario (markets could bottom close to the Fed’s rate hike decision and then we could see a temporary rebound) even more likely. The technicals support it too.
Technically Speaking
As I just wrote about the stock market, let’s take a closer look at it.
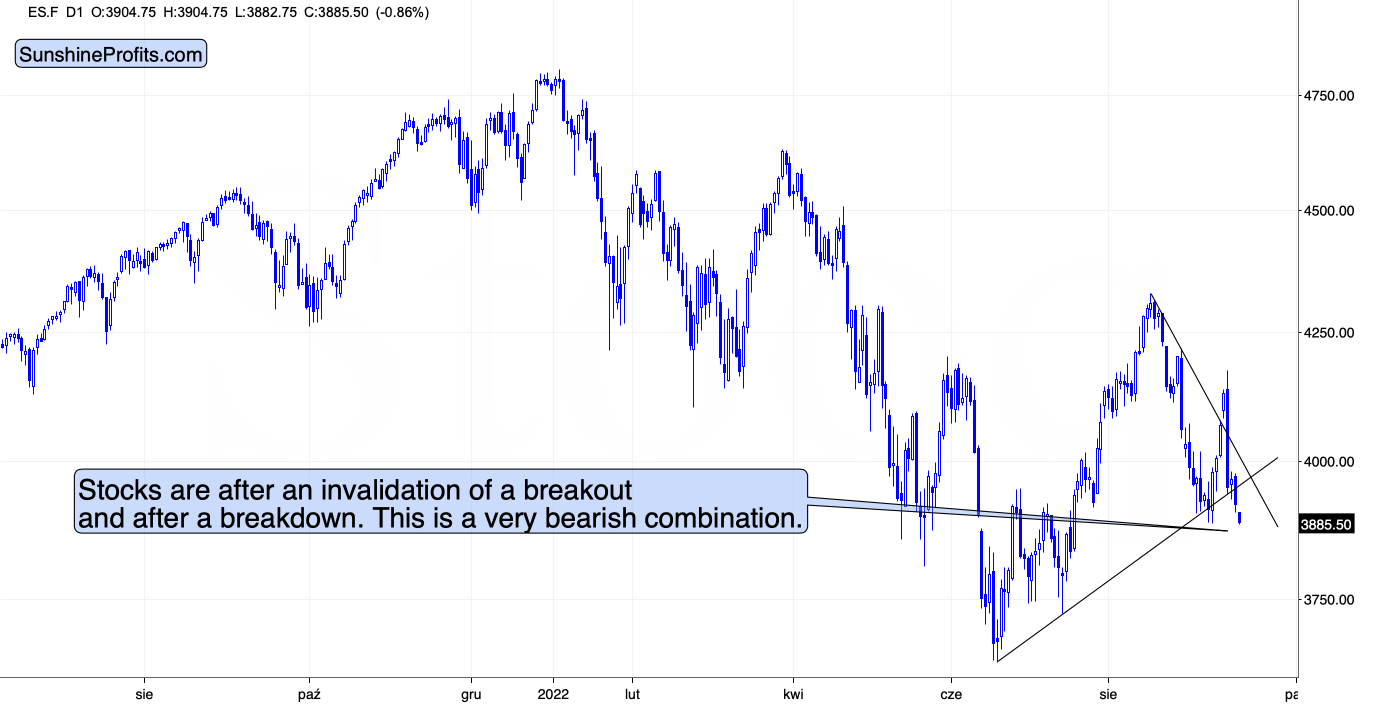
Stocks are after the invalidation of a breakout and right after a breakdown below a rising support line. They also just (in today’s pre-market trading) broke to new monthly lows.
This opens the door wide open to further declines. The previous 2022 lows provide support, but I wouldn’t be surprised stocks if fall even further before forming a short-term bottom.
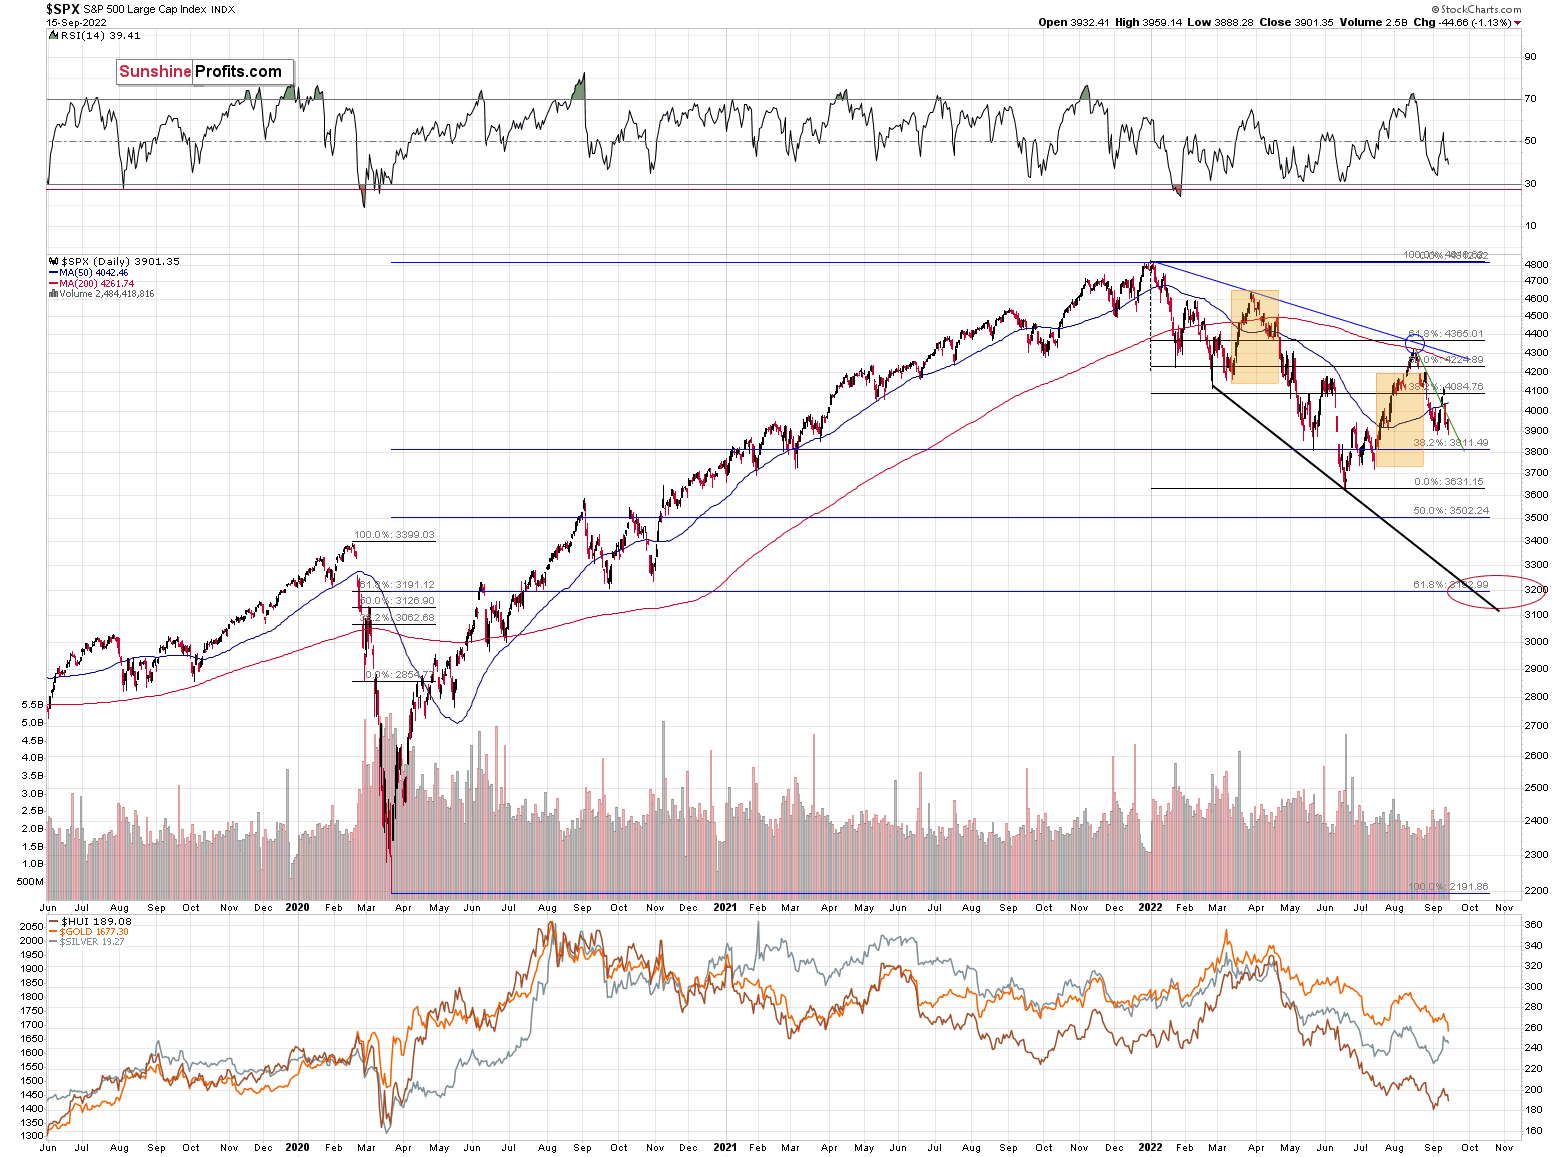
Based on the 50% Fibonacci retracement, the mid-2020 highs, and the fact that it’s a quite round number, there’s strong support at about 3,500 – that’s where we could see the next short-term bottom.
Yes, it’s far, but given how the rate expectations just shifted, that we just saw an invalidation of a breakout and a move to new monthly lows, it’s not unrealistic.
Speaking of breakdowns…
Gold Breaks Below the 2022 and 2021 Lows!
Gold is currently trading below its 2021 lows.
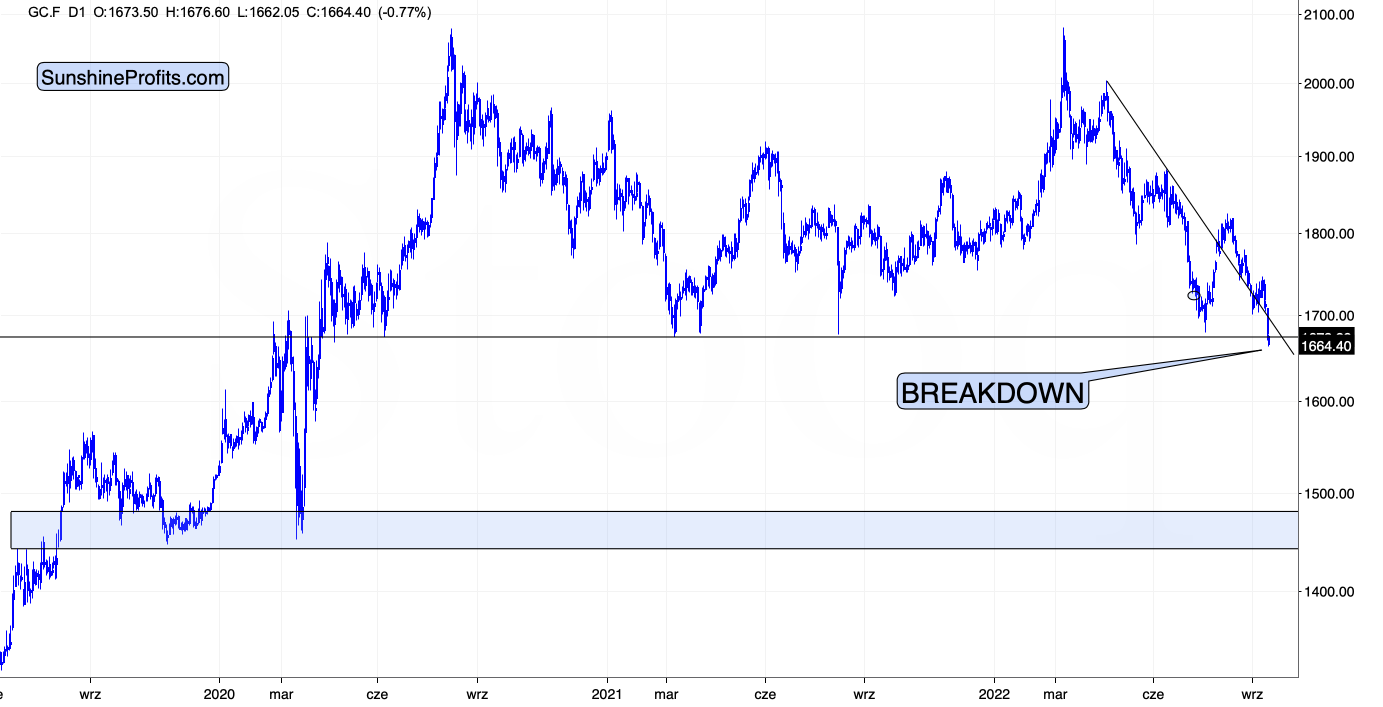
This. Is. Huge.
Remember the gold / real-yield chart from the fundamental part of today’s analysis? Based on that, gold should have been trading much lower recently. Why didn’t it plunge? Because of technical reasons. Given similar price moves and similar emotional environments (fear/greed combination that are ultimately represented by price/volume moves), markets behave in similar ways. What we see right now is a remarkably clear analogy to what we saw in 2013. Based on this analogy, we were likely to see a relatively steady decline with corrective upswings. That’s exactly what happened.
However, this week’s breakdown shows that the gold market is now ready to enter the next stage of the analogy. The stage on which it truly slides.
There is some support right below the $1,600 level based on the previous short-term bottom. However, based on the analogy to 2013, it seems that gold is likely to drop much more than just slightly below $1,600 before bouncing in a meaningful manner.
The really strong combination of support levels is located a bit below $1,500 – approximately between $1,450 and $1,480.
The 2020 lows seem to be the most notable – and thus most important – part of the entire support area. At that time, gold futures bottomed at $1,450.90, so any move below $1,460 can be viewed as the target being “in” – it will be “close enough” from the practical point of view.
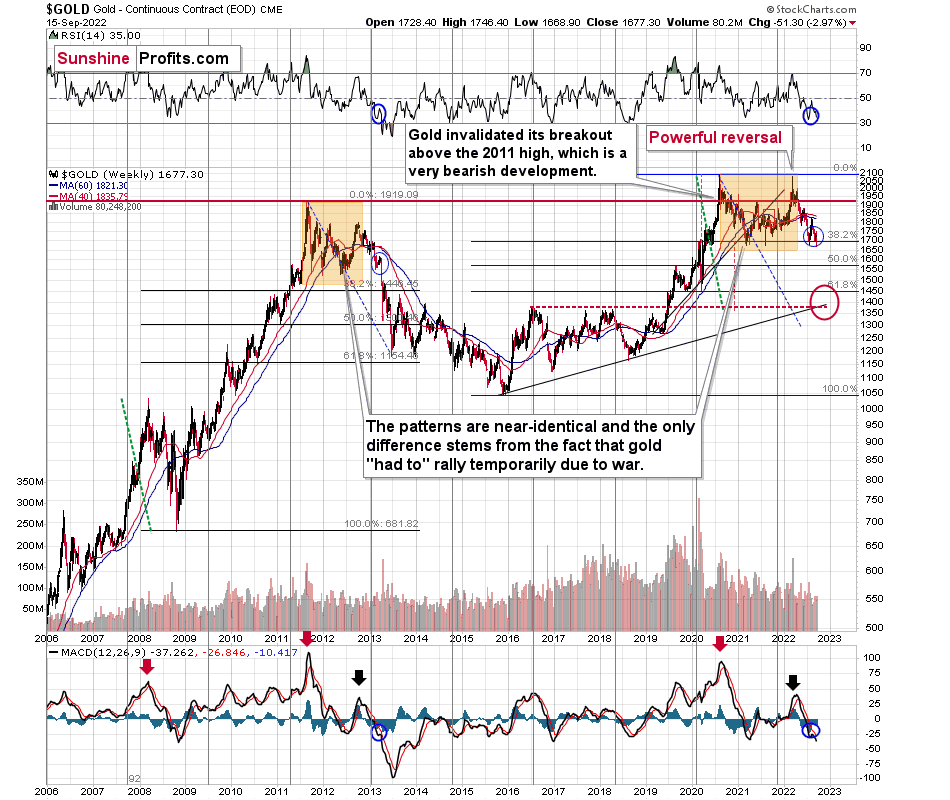
From the long-term point of view, that’s where we have the all-important 61.8% retracement based on the entire 2015-2020 rally. This makes the above-mentioned support even stronger.
Now, what I want to emphasize here is that when gold reaches $1,450, I think this will only be its initial bottom, not the final one.
Yes, a very important initial point, but still not the final one.
After gold moves to about $1,450, I expect it to bounce – perhaps to $1,550 or so. Then, after this rebound, I expect it to decline once again, just like what it did in 2013, and that bottom might be the final one for this decline – and for many years to come. Perhaps forever – in nominal terms, that is.
This final bottom is likely to take place close to gold’s 2016, 2017, and 2018 highs and close to its rising support line based on the 2015 and 2018 lows.
That’s a bit below $1,400, close to $1,390.
Thank you for reading our free analysis today. Please note that the above is just a small fraction of the full analyses that our subscribers enjoy on a regular basis. They include multiple premium details such as the interim targets for gold and mining stocks that could be reached in the next few weeks. We invite you to subscribe now and read today’s issue right away.
Sincerely,
Przemyslaw Radomski, CFA
Founder, Editor-in-chief -
Do Investors Still Believe That the Fed Is a Miracle Worker?
September 15, 2022, 7:19 AMDespite strenuous actions of the central bank, inflation was reduced only slightly. However, this didn’t prevent the bulls from rushing to buy the dip.
In Denial
With gold, silver, mining stocks and the S&P 500 attempting to recover from the Sep. 13 sell-off, the price action was relatively sleepy on Sep. 14. However, while many were spooked by the resiliency of the Consumer Price Index (CPI), the post-GFC crowds’ willingness to ‘buy the dip’ should has been its undoing.
For example, I’ve noted on numerous occasions that the consensus is more worried about missing a dovish pivot than suffering a major drawdown. As a result, they will panic buy on the slightest hope that the bull market can resume. In contrast, with unanchored inflation shifting the calculus, recency bias has clouded investors’ judgment. To explain, I wrote on May 25:
A decade of dovish pivots has left a generation of investors believing that the central bank is all talk and no action. However, with inflation at levels unseen in 40+ years, Powell is not out of ammunition, and the Fed pivot crowd should suffer profound disappointment as the drama unfolds.
The bottom line? We’ve officially entered the monetary version of The Boy Who Cried Wolf. With Fed officials running to the rescue each time the financial markets show signs of stress, investors are programmed to ignore their hawkish threats. However, while these post-GFC pivots occurred with inflation perched near 2%, investors are so steadfast in their belief that they ignore the climactic consequences of unanchored inflation.
To that point, with more of that behavior on display during the Sep. 13 rout, the lack of fear in the financial markets highlights why we’re likely far from a medium-term bottom.
For example, Goldman Sachs Prime Brokerage data showed that while hedge funds were sellers of macro products (indexes and ETFs), they bought individual stocks. Furthermore, purchases of technology shares outnumbered sales 3.5 to 1, and tech has been net bought for 12 of the last 14 sessions.
Please see below:
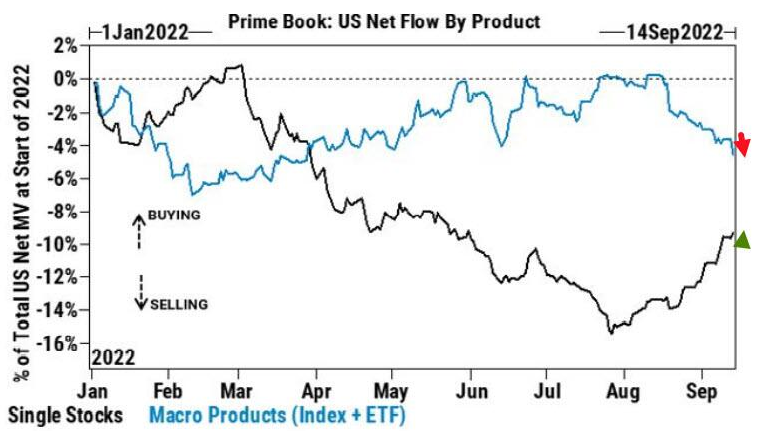 Source: Goldman Sachs
To explain, the blue line above tracks hedge funds’ activity in macro products, while the black line above tracks their activity in single stocks. If you analyze the divergence, you can see that the latter has remained uplifted over the last month and a half.
Furthermore, with the liquidity beneficiaries (tech stocks) catching a bid, hedge funds still believe in the Fed’s ability to orchestrate a soft landing.
Please see below:
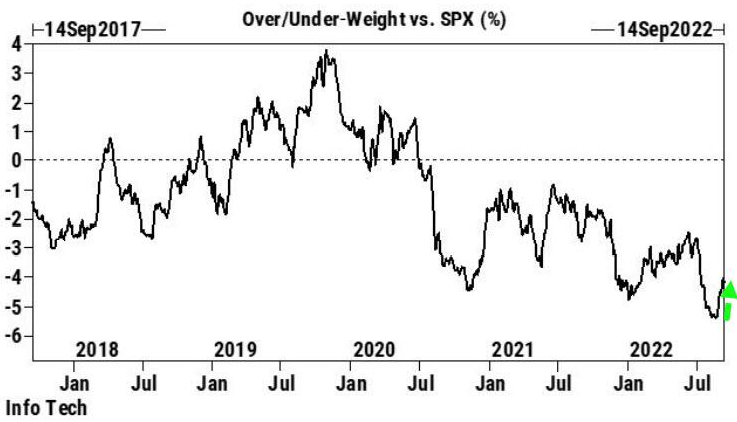 Source: Goldman Sachs
To explain, the black line above tracks hedge funds’ overweight/underweight of the technology sector relative to the S&P 500. If you analyze the right side of the chart, you can see that the black line has bounced off of its recent low, which implies that hedge funds are less bearish on the sector (though still underweight). As such, the sharp sell-off on Sep. 13 was nowhere near a capitulation.
As further evidence, hedge funds weren’t the only ones eager to buy the dip. Data from Vanda Research shows that retail investors poured more than $2 billion into the market on Sep. 13, the second-largest daily net inflow in 2022.
Please see below:
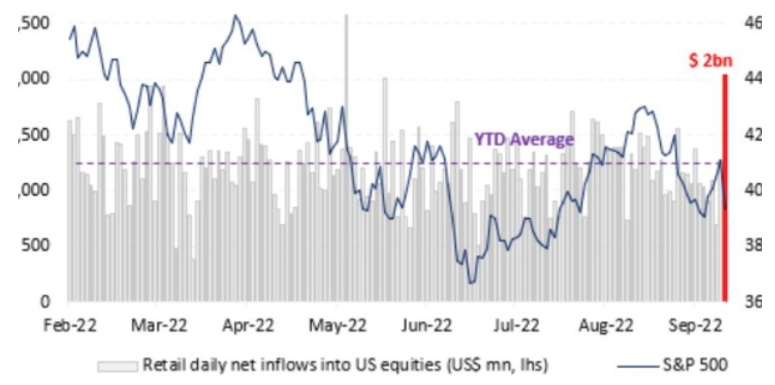 Source: Vanda Research
To explain, the blue line above tracks the S&P 500, while the purple and red bars above track retail investors’ net inflows into U.S. equities. If you analyze the right side of the chart, you can see that the crowd went all in. Likewise, the $395 million that flowed into the SPY ETF was the largest one-day splurge since July 2021. As a result, no one fears inflation or the Fed.
However, Vanda Research analysts led by Marco Iachini noted how retail investors’ overconfidence may come back to bite them.
“Multiple capitulation indicators are now flashing a warning sign,” they wrote. “That means the likelihood of retail capitulation increases significantly near term should equities re-test this year’s June lows.”
Thus, with hedge funds and retail investors unconcerned about the troublesome fundamental backdrop, U.S. households are mirroring their complacency.
Please see below:
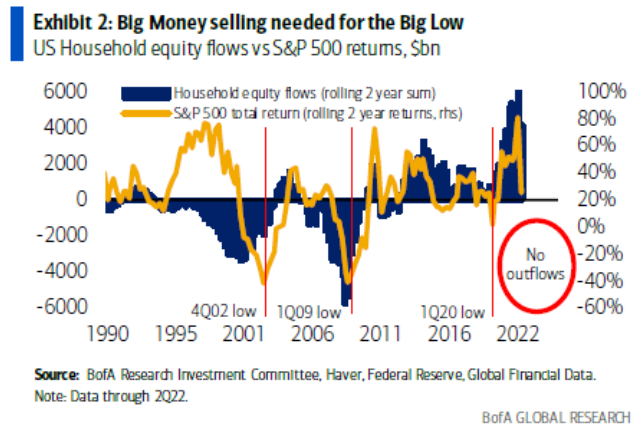
To explain, the gold line above tracks the S&P 500’s two-year rolling return, while the dark blue bars above track U.S. households’ rolling two-year equity flows. If you analyze the relationship, you can see that S&P 500 bottoms in 2002 and 2009 occurred after U.S. households rushed for the exits.
In contrast, the blue bars on the right side of the chart show how U.S. households are buying stocks, not selling them. Therefore, the post-GFC playbook has programmed investors to believe that the Fed can cure all economic ills.
Furthermore, while the 1970s/1980s recessions provided clear evidence of the destructive nature of inflation, the crowd has more faith in the Fed than in historical precedent or economic reality. However, the pivot proponents should suffer mightily as their soft landing hopes are derailed by inflation.
Speaking of which, I’ve been warning since 2021 that investors materially underestimate the inflation fight that confronts the Fed. Moreover, while consensus expectations continue to move in a hawkish direction, the medium-term economic ramifications are far from priced in.
Please see below:
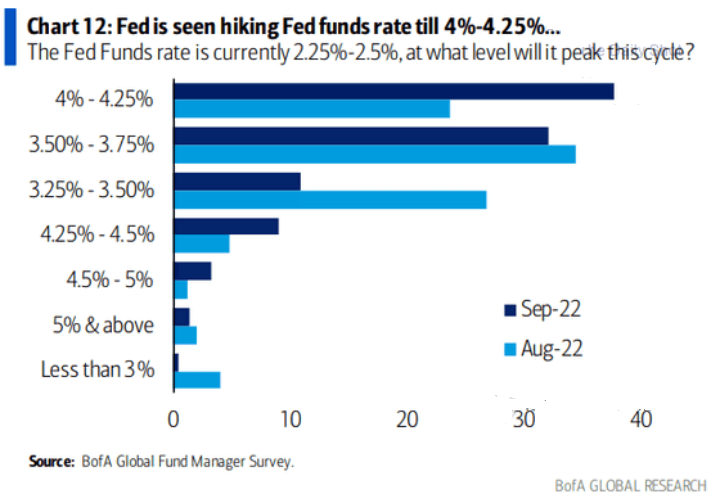
To explain, Bank of America’s latest Global Fund Manager Survey shows that most respondents expected the U.S. federal funds rate (FFR) to peak between 3.25% and 3.75% in August (the light blue bars). Conversely, September’s results show that the top spot is now in the 4% to 4.25% range (the dark blue bar).
As a result, what a difference a month makes. Yet, while rate hike expectations have moved materially higher, notice how the 4.5% to 5% and the 5% and above rows are in the major minority. In reality, these are the most likely outcomes. With an FFR in the 4.5% to 5.5% range needed to cool inflation, investors still underestimate the task at hand.
In addition, since it didn’t take long for the ~3.5% camp to jump to 4%+, don’t be surprised if these expectations ratchet higher in the months ahead.
The Real Deal
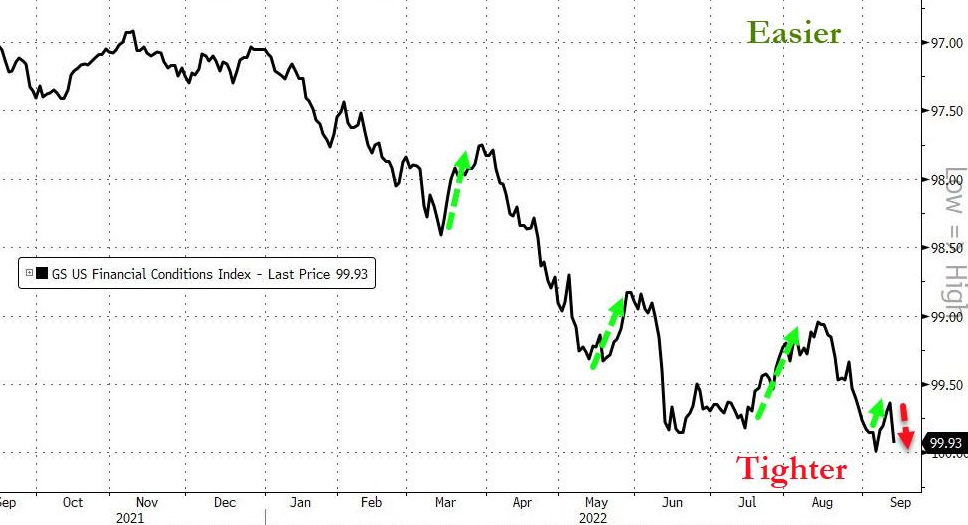
While the financial markets are eager to ignore the dilemma, Goldman Sachs’ Financial Conditions Index (FCI) continues to make higher highs and higher lows. For context, the chart below is inverted, which means that a lower black line results in tighter financial conditions.
Please see below:
 Source: Bloomberg/ZeroHedge
To explain, the Fed needs a lower black line to reduce inflation. Moreover, while tighter financial conditions are bearish for growth and risk assets, the post-GFC crowd assumes that once inflation dies, all of this will reverse and the bull market can resume. Therefore, not selling is the consensus strategy to front-run a dovish pivot.
However, the gambit is unrealistic because this mindset will prolong inflation. As long as investors brace for a dovish pivot, their bullish expectations will keep the Fed from achieving its goal. As such, continued denial will only make the Fed's job harder and result in a higher FFR over the medium term.
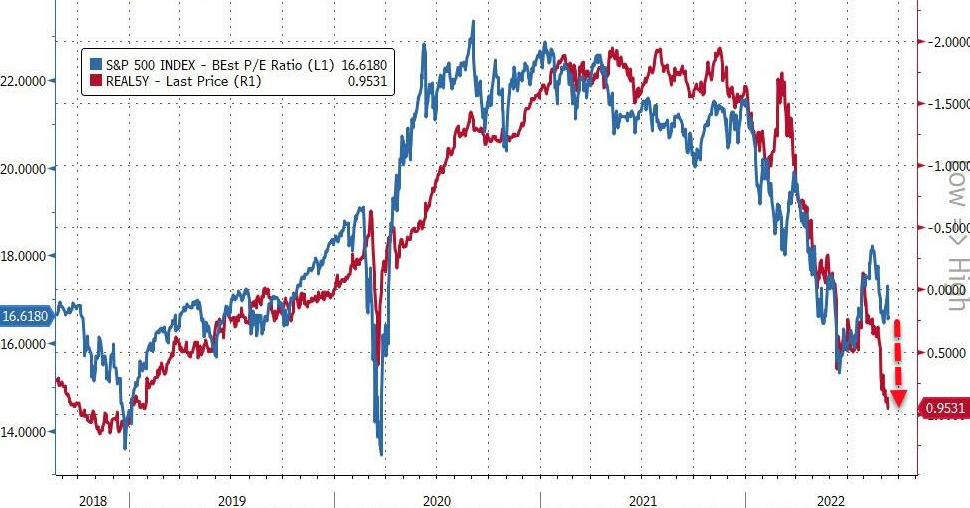
Likewise, investors' unwillingness to let the S&P 500 fall substantially is another reason why the Fed will need to work overtime to tame inflation.
Please see below:
 Source: Bloomberg/ZeroHedge
To explain, the blue line above tracks the S&P 500's forward price-to-earnings (P/E) ratio, while the red line above tracks the inverted (down means up) U.S. 5-Year real yield. If you analyze the gap on the right side of the chart, you can see that a higher U.S. 5-Year real yield has not been able to reduce the S&P 500's forward P/E recently.
However, this will only hurt investors in the long run. If asset prices decline sharply, the flow-through of lower commodity prices will assist in the Fed's inflation flight. However, with the financial markets unwilling to help, the Fed has to do the heavy lifting and push real yields even higher to achieve the desired results.
Overall, the Fed has a serious problem because the post-GFC crowd has been trained to hold and wait for the central bank's rescue. However, now, a sell-off would make the Fed's job easier. Yet, the Fed has created a monster, and the consensus mindset makes the central bank's job much harder. As a result, inflation should remain problematic and the FFR should continue its ascent until the financial markets reach a breaking point.
The Bottom Line
The dip buyers were out in full force as old habits die hard. However, despite their enthusiasm, only a little progress has been made on inflation. Moreover, the core CPI continues to increase even though the metric is least affected by supply-chain disruptions. Furthermore, prior Fed committees had to push the FFR above or within ~50 basis points of the peak headline CPI to curb inflation. Yet, is this time different? Either way, market participants drastically underestimate the challenges that lie ahead.
In conclusion, the PMs were mixed on Sep. 14, as gold ended the day in the red. However, while I’ve warned repeatedly that the bulls will likely buy the dip until the very end, a strong USD Index and higher real yields are profoundly bearish for financial assets. In addition, the sharp ascents of both have only reduced inflation by a small amount. As such, higher highs for the pair should be on the horizon, and gold, silver, mining stocks, and the S&P 500 should head in the opposite direction.
Thank you for reading our free analysis today. Please note that the above is just a small fraction of the full analyses that our subscribers enjoy on a regular basis. They include multiple premium details such as the interim targets for gold and mining stocks that could be reached in the next few weeks. We invite you to subscribe now and read today’s issue right away.
Sincerely,
Przemyslaw Radomski, CFA
Founder, Editor-in-chief -
Let’s Go Back to 2013 and Take a Look at the GDXJ Bearish Clues
September 14, 2022, 7:13 AMIf we were to be guided by history, junior miners behave almost exactly as in 2013. What does that mean? Well, we will most likely see a huge decline.
Silver’s previous quick run-up fooled many, but you weren’t caught off-guard, and yesterday’s decline didn’t surprise you. If so, congratulations!
Time Travel
Today, I would like to show you how the GDXJ (a proxy for junior mining stocks) is repeating its 2013 performance, and I want to emphasize just how bearish the implications are.
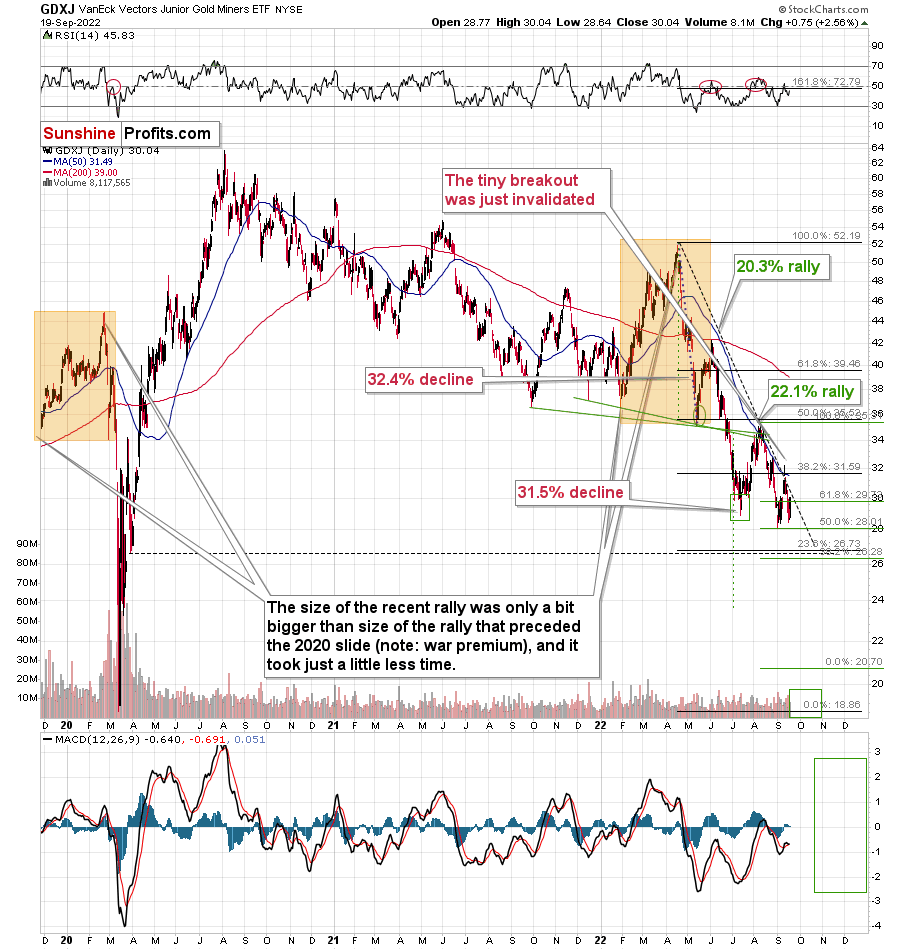
Here’s what the GDXJ did in 2013.
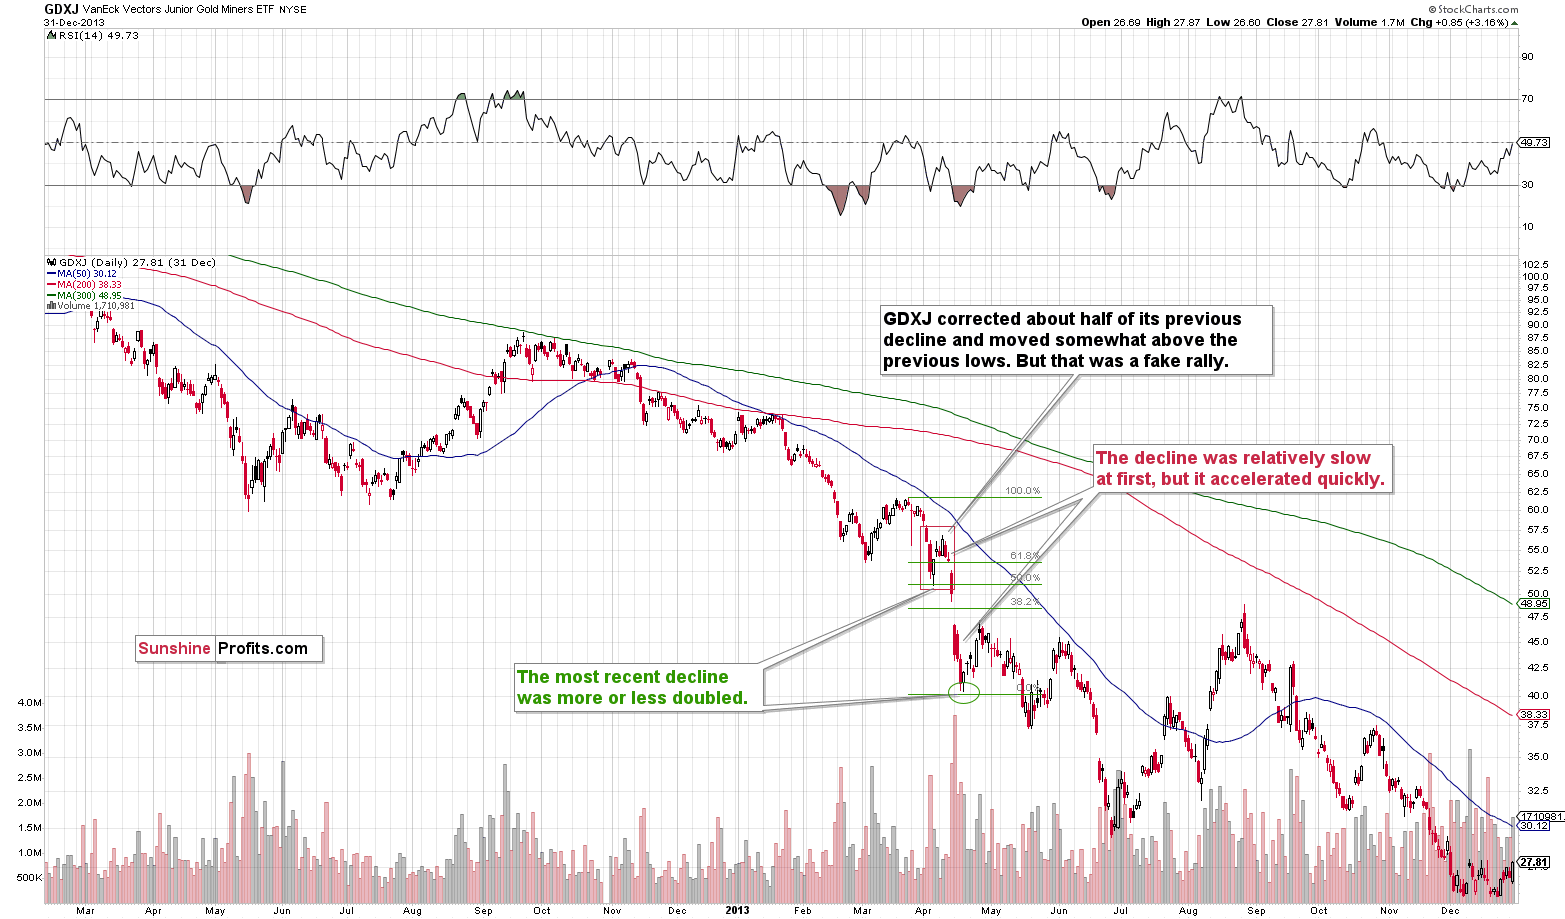
Right before the April 2013 plunge, the GDXJ corrected about half of the preceding short-term rally, and it moved above its most recent short-term low. This rally was relatively quick.
Then the decline started, but it was not huge at first. However, it took only a few days for the pace of decline to pick up, and shortly after the GDXJ moved below its recent lows, it truly plunged. The slide was also huge in the rest of the precious metals sector.
The GDXJ declined in a major way, and it formed a short-term bottom once it doubled the initial decline. I marked this with the green Fibonacci extension tool. The initial decline is 50% of the entire decline (approximately), which means that the latter was twice as big.
What does this imply for the current situation?

First of all, it implies that the analogy to 2013 remains intact.
Second, it implies that – based on the size of the recent decline – the GDXJ is likely to decline until it moves below $22 or so. Given the proximity of the 2020 lows that are just below $20, and the fact that right now there are more factors that are happening outside of the precious metals market that favor lower junior miners’ (and gold) prices, I wouldn’t be surprised to see the GDXJ bottom close to its 2020 low (or even slightly below it), and not slightly above the green target provided by the doubling-the-previous-decline technique.
Those “other factors” are the soaring USD Index, declining stock market prices, and rising interest rates.
The Only Way Is Down
Besides, the above is very much in tune with what I’ve been writing about for months. I’ve been emphasizing that the return to the 2020 target (or lower, perhaps much lower) is likely for mining stocks. Now, we even have even the short-term confirmation of this scenario.
Moreover, please note that yesterday’s almost 5% decline caused the tiny breakout above the declining, medium-term resistance line to be invalidated. Invalidations of breakouts are immediate sell signs.
The additional implication of the recent rally is that since it happened, it’s no longer likely that we will see a rebound from the ~$26-27 area. Why? Because we already saw one recently, and based on the analogy to 2013, what was likely to happen already happened. Sure, there are no certainties in any market, and there might indeed be a correction in this area, but it’s not likely, let alone very likely, that it’s going to take place.
All in all, it seems that the downtrend continues, and that it’s the final time to make sure one is prepared to take advantage of the upcoming big slide. Of course, I can’t promise any kind of performance or profitability, but in my opinion, it does seem likely that the next big move lower will be truly epic.
Thank you for reading our free analysis today. Please note that the above is just a small fraction of the full analyses that our subscribers enjoy on a regular basis. They include multiple premium details such as the interim targets for gold and mining stocks that could be reached in the next few weeks. We invite you to subscribe now and read today’s issue right away.
Sincerely,
Przemyslaw Radomski, CFA
Founder, Editor-in-chief


Gold Investment News
Delivered To Your Inbox
Free Of Charge
Bonus: A week of free access to Gold & Silver StockPickers.
Gold Alerts
More-
Status
New 2024 Lows in Miners, New Highs in The USD Index
January 17, 2024, 12:19 PM -
Status
Soaring USD is SO Unsurprising – And SO Full of Implications
January 16, 2024, 8:40 AM -
Status
Rare Opportunity in Rare Earth Minerals?
January 15, 2024, 2:06 PM

