
tools spotlight

-
Gold is Poised to Move as the Euro is Now Cheaper than the USD
August 29, 2022, 8:54 AMAs long as gold is priced in the U.S. dollar, it’s critical to keep the latter in mind. And last week, something epic happened in the forex market.
Namely, the EUR/USD closed the week below the all-important 1 level.
For the first time in almost two decades!
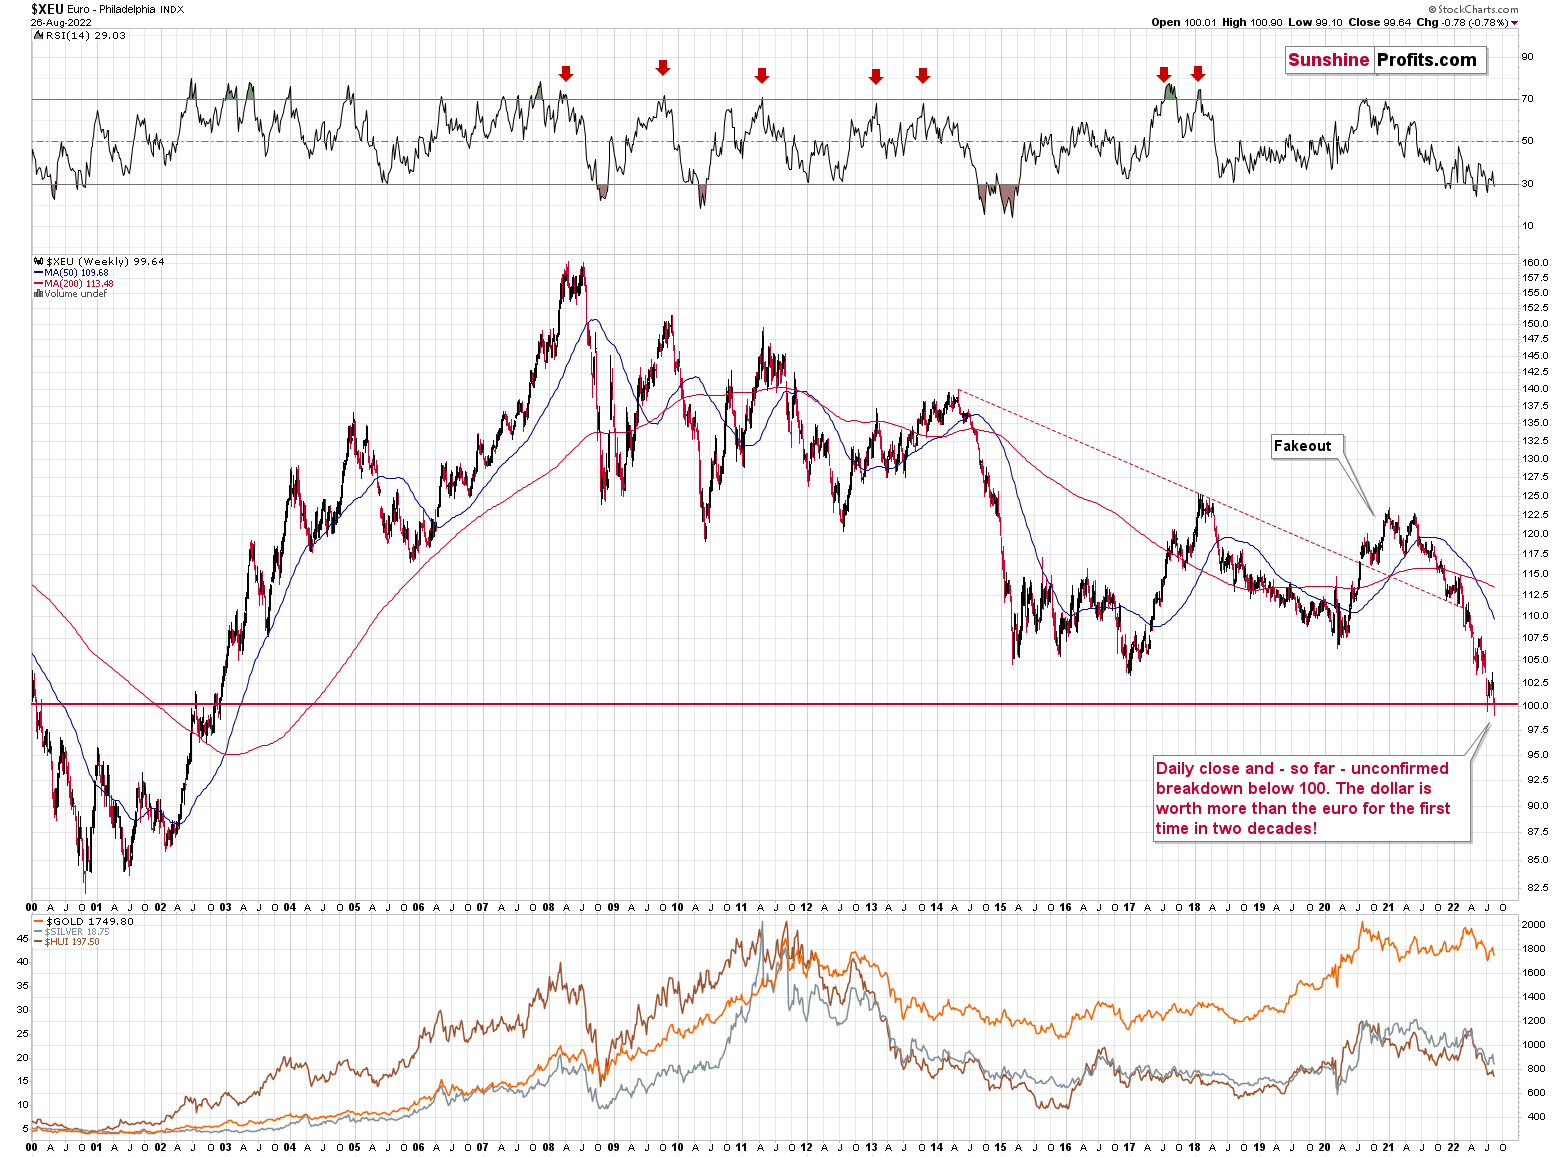
When this level was first approached weeks ago, I wrote that a rebound was likely, but I also added that I expected this level to be broken after the rebound. That’s exactly what we just saw.
This. Is. Huge.
This is something that the media will catch on to and is likely to trigger action from the investing public. This is where the early part of panic could start in the forex market, and it could then catch on in other markets – stocks, gold, silver, mining stocks, etc. This is the “oops, the unthinkable is happening” moment.
Those of you who have been profiting from how this situation develops practically throughout the entire year (like my subscribers), will likely be happy to know that the above indicates (I’m not making any guarantees, of course) that the biggest gains (based on mining stocks’ declines) are likely just ahead.
Moving back to the USD Index, it had recently moved slightly below its 50-day moving average, and then it moved back above it. After that, it started to rally, and it has continued to rally until this moment.
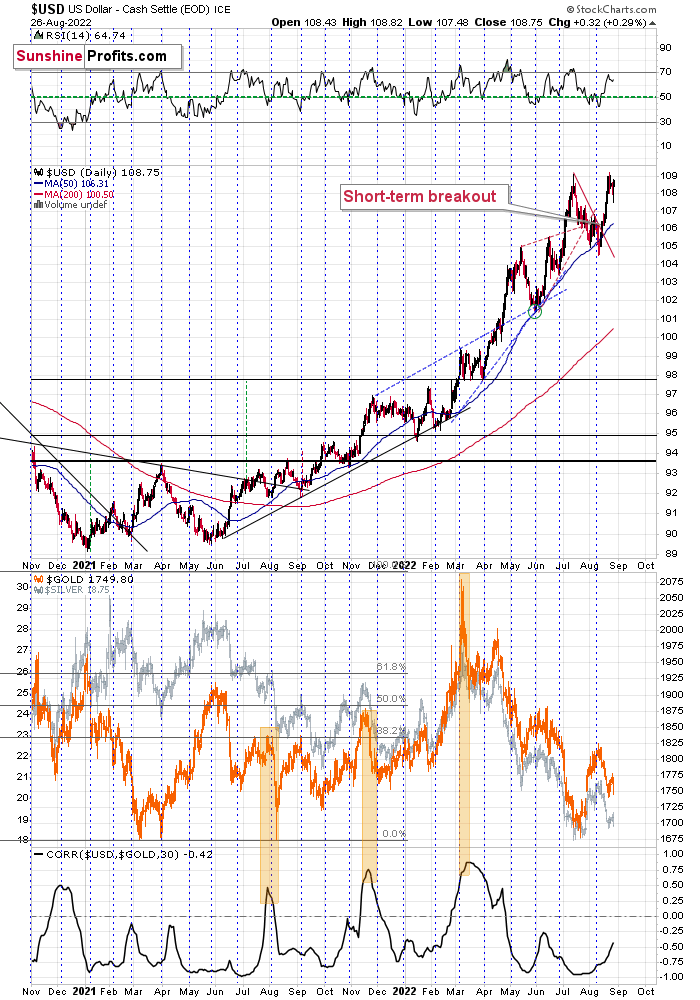
This move is in tune with what we saw at previous local bottoms. The RSI moved slightly below 50, which used to accompany bottoms in the previous months.
So, the scenario in which the USD Index has already bottomed seems quite likely. In fact, we already saw a breakout to new highs in today’s (Aug. 29) pre-market trading.
Please note that back in June/July, gold was initially reluctant to decline. It moved sharply lower after it was already clear that the USDX was moving to new highs. Consequently, we might see a sizable short-term decline in gold very soon.
Let’s zoom out.
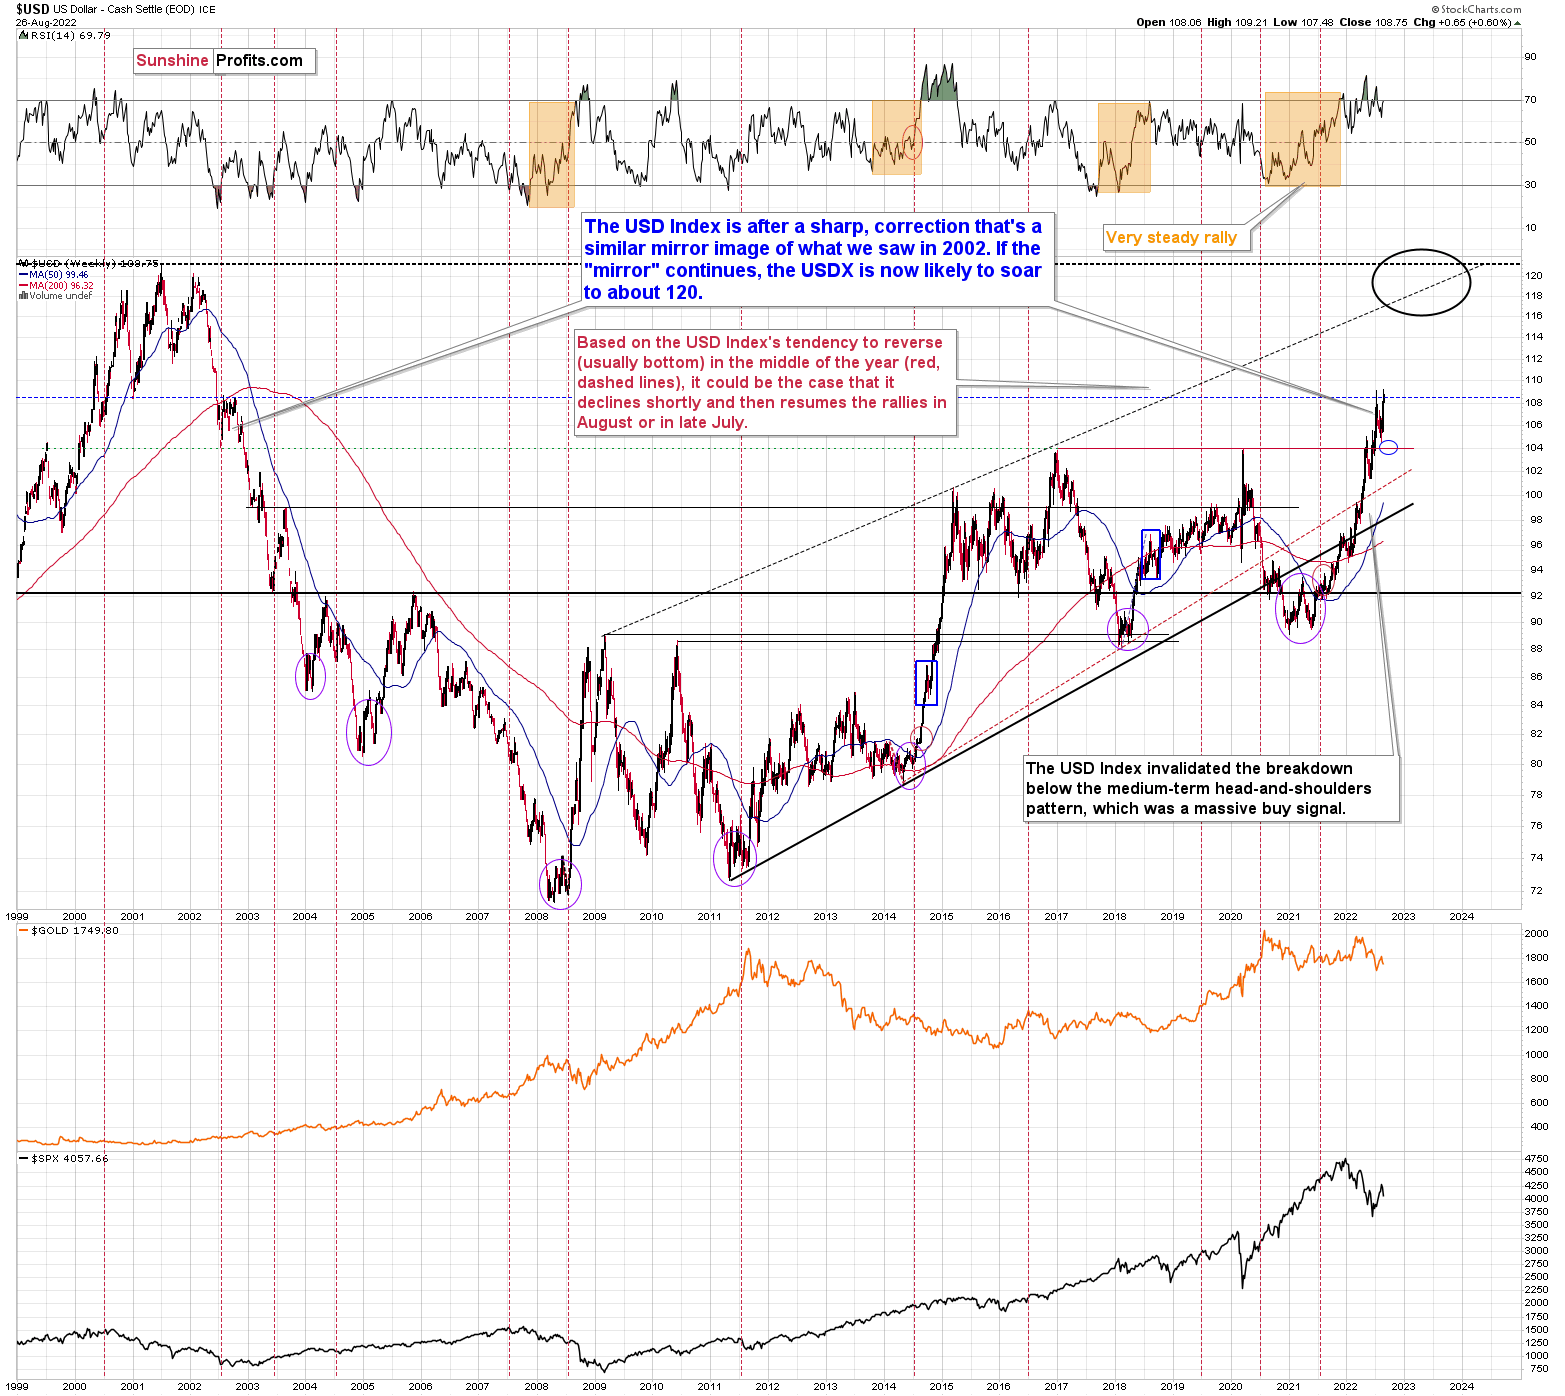
I previously wrote the following about the USD Index’s long-term chart:
There’s also the possibility that the USD Index keeps declining until it reaches the very strong support at about the 104 level – the previous long-term highs (…).
Last week, the USD Index bottomed at about 104.5, which was very close to the above-mentioned 104 level. If traders had expected the USD Index to bottom at this level, then some of them might have bought at higher levels in order to maximize their odds of catching the bottom, thus actually creating the bottom at higher levels.
As the USDX moved to the upper border of my previous downside target, it seems that the short-term bottom is already in.
This, in turn, likely means that the peak for precious metals is already in.
Please note that the USD Index is currently rallying in an approximately mirror image of how it declined in 2002. Based on this, it seems that one shouldn’t be surprised by a rather quick move from the current levels to about 120 – the USD Index’s long-term highs. Of course, the implications for the precious metals market are profoundly bearish.
If you can’t or don’t want to profit from declining mining stock prices, I also have good news. Please note that the decline is not likely to take place forever. Based on how the precious metals sector declined in 2008 and 2013, and based on multiple other indications, it seems that we’ll see a major bottom this year. While higher prices are encouraging, please note that there are two moments that determine a given trade’s or investment’s profitability – it’s not just the exit price, but also the entry price.
Thanks to declines and lower prices, one can get in at much lower levels and thus greatly increase the profits (again, I’m not guaranteeing any profits or market performance – nobody can guarantee it) from the entire huge rally that’s likely to take place in the following years.
The “mother of all buying opportunities” in the precious metals sector is likely not here yet, but it’s likely to present itself in the not-too-distant future. Stay tuned!
Thank you for reading our free analysis today. Please note that the above is just a small fraction of the full analyses that our subscribers enjoy on a regular basis. They include multiple premium details such as the interim targets for gold and mining stocks that could be reached in the next few weeks. We invite you to subscribe now and read today’s issue right away.
Sincerely,
Przemyslaw Radomski, CFA
Founder, Editor-in-chief -
Powell’s Words Can’t Shape Gold’s Medium-Term Fundamentals
August 26, 2022, 8:52 AMOn the eve of the Fed's boss's speech, officials suggested a more hawkish central bank policy. But even if Powell's words trigger a rally, they won’t help the gold market in the long run.
With the S&P 500 rallying by 1.41% on Aug. 25, the late-afternoon surge was likely a short-covering rally in advance of Powell’s Jackson Hole speech. In the process, gold rose by 0.56%, silver by 1.13%, the GDX ETF by 0.85% and the GDXJ ETF by 0.65%. Conversely, the USD Index declined by 0.17% and the U.S. 10-Year real yield also retreated.
Therefore, while volatility should be amplified today, the PMs’ medium-term technical and fundamental outlooks are profoundly bearish. As a result, Powell’s words should have little impact on their prices in the months ahead.
Gold and the Central Bank Effect
With the Qatar Central Bank increasing its gold purchases in the second quarter, Krishan Gopaul, Senior European and Middle East Analyst at the World Gold Council, tweeted on Aug. 23:
“The Central Bank of Qatar added 14.8t of #gold to its official reserves in July 2022 - appears to be the largest monthly increase on record (back to 1967), although early data is patchy. Gold reserves now stand at 72.3t, the highest on record.”
Thus, you may be curious about how central bank activity influences gold. Well, the reality is that central banks are steady purchasers of the yellow metal, and all things considered, their activity has an immaterial impact on the gold price.
For example, the World Gold Council released its Gold Demand Trends Q2 2022 report on Jul. 28. An excerpt read:
“The LBMA Gold price PM averaged US$1,871/oz in Q2, 3% above the Q2’21 average. However, this comparison conceals the 6% decline in the price during the most recent quarter, pressured by rising interest rates and the rocketing value of the U.S. dollar.”
However:
“Central banks continued to buy gold. Global official gold reserves grew by 180t in Q2, taking H1 net purchases to 270t.”
Please see below:
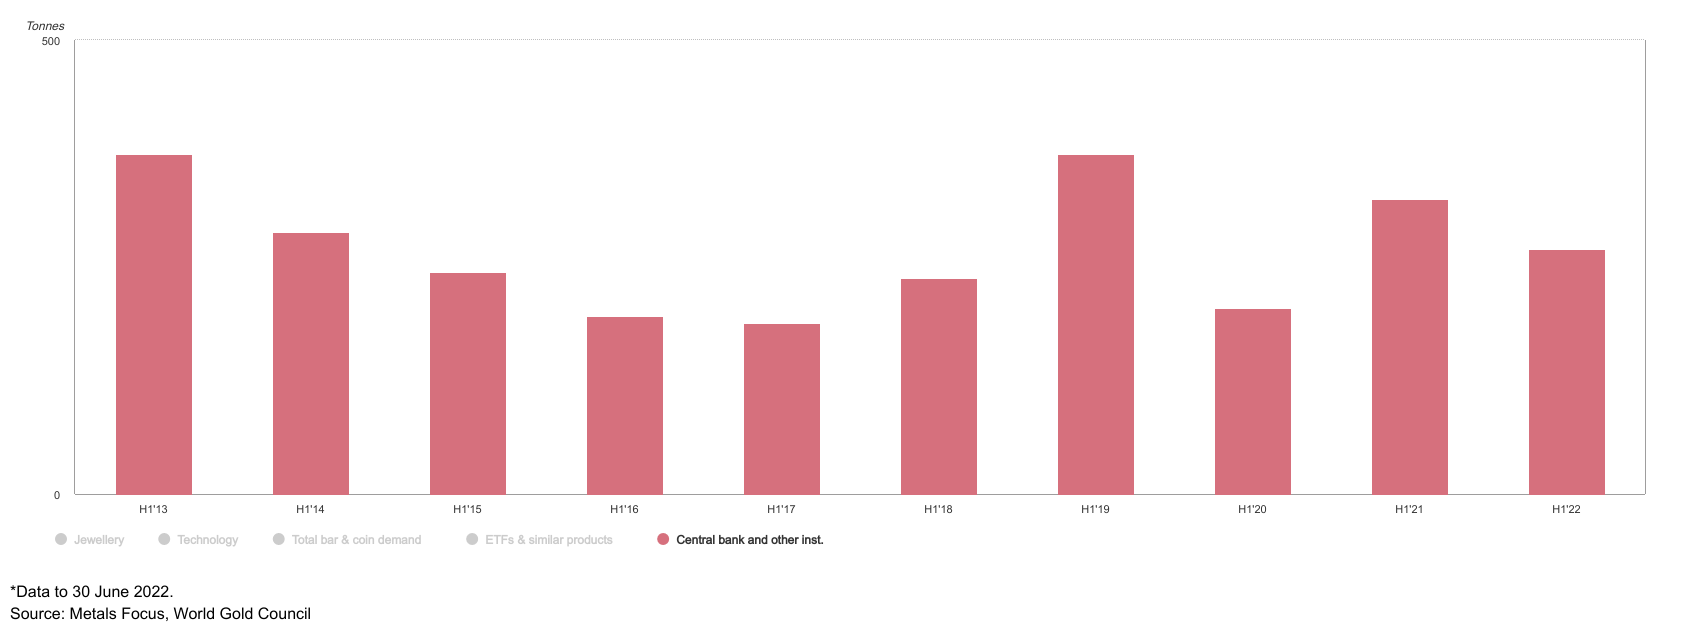
To explain, the red bars above track the gold purchases of central banks and “other institutions.” If you analyze the symmetry, you can see that net flows tend to stay in a relative range of 200 to 300 tons per six-month period.
Furthermore, while H1 2022 purchases were less than H1 2021 and exceeded H1 2020, the data shows that central banks aren’t the best market timers.
Please see below:
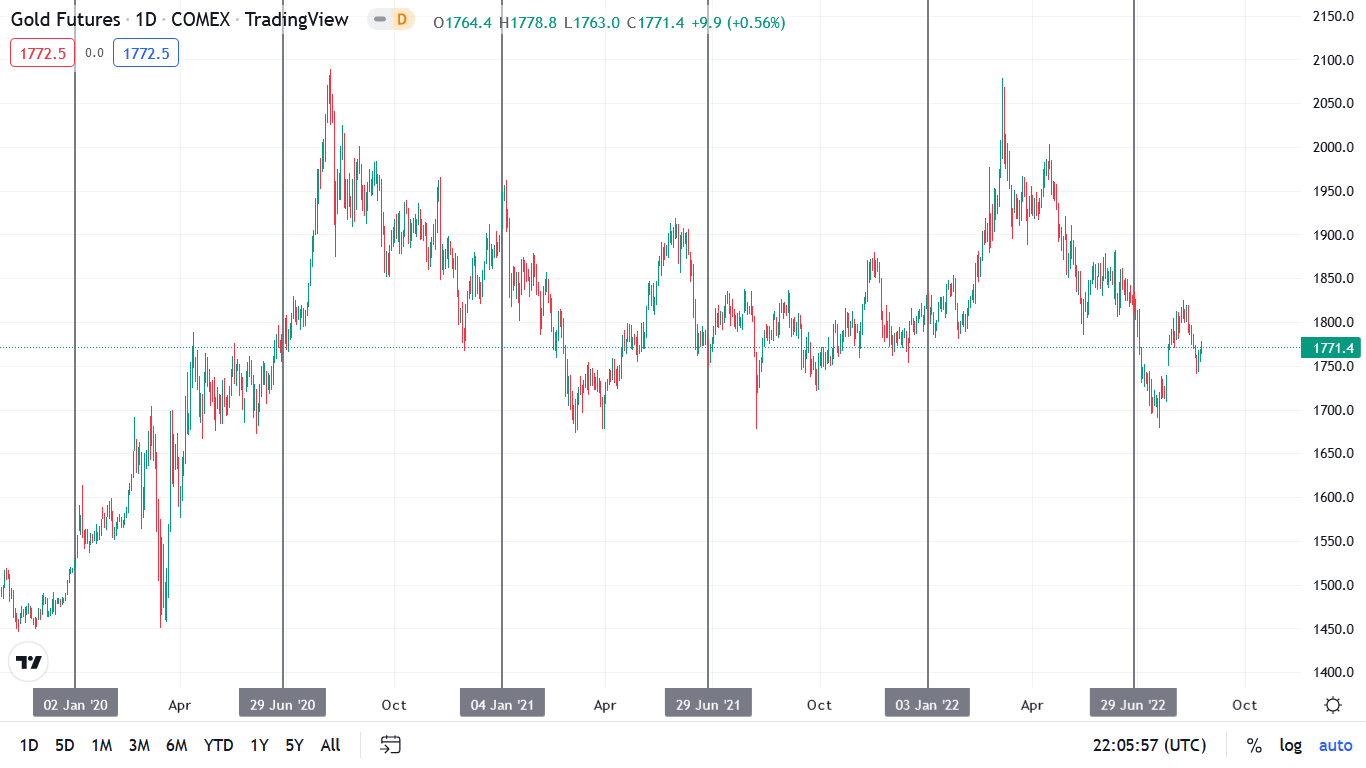
To explain, the candlesticks above track the gold futures price, while the vertical gray lines represent the six-month (H1) periods in 2020, 202,1 and 2022. If you analyze the left side of the chart, you can see that the gold futures price ended the six-month period higher, even though central bank purchases were near the low end of the historical range (204.50 tons on the first chart above).
Likewise, central banks purchased 325.25 tons of gold in H1 2021, only to watch the gold futures price end the six-month period lower than where it started. Moreover, central bank purchases fell to 269.62 tons in H1 2022, and the gold futures price was roughly flat throughout the period.
All in all, headlines about central bank gold purchases often garner a lot of excitement from the permabulls. However, their activity doesn’t provide much insight into where gold is headed, let alone where the GDXJ ETF is headed.
In contrast, the technicals, the USD Index, and real interest rates are much better predictors of gold’s short-and-medium-term movement. In addition, with the junior miners influenced by the behavior of the general stock market, the S&P 500 is another critical metric.
Powell’s Prayer
With Fed Chairman Jerome Powell set to speak at the annual Jackson Hole summit today, investors went from front-running a hawkish hammer to front-running a dovish pivot. However, while investors’ manic mood swings have become the norm in an era of easy money, Powell’s words can’t shape the medium-term fundamentals.
Furthermore, with gold, silver, and mining stocks underperforming the S&P 500 on Aug. 25, the PMs have been relatively weak. Therefore, while Powell could ignite a pump or a dump today, his deputies’ messaging on Aug. 25 signals more hawkish surprises to come.
For example, St. Louis Fed President James Bullard said that if the Fed doesn’t front-load interest rate hikes, “a baseline would be that probably inflation would be more persistent than what many on Wall Street expect and that’s going to be higher for longer. That’s a risk that’s underpriced in the markets today.”
As a result, he stressed that the Fed needs to raise the U.S. federal funds rate (FFR) quickly to show it's “serious about inflation fighting.”
Please see below:
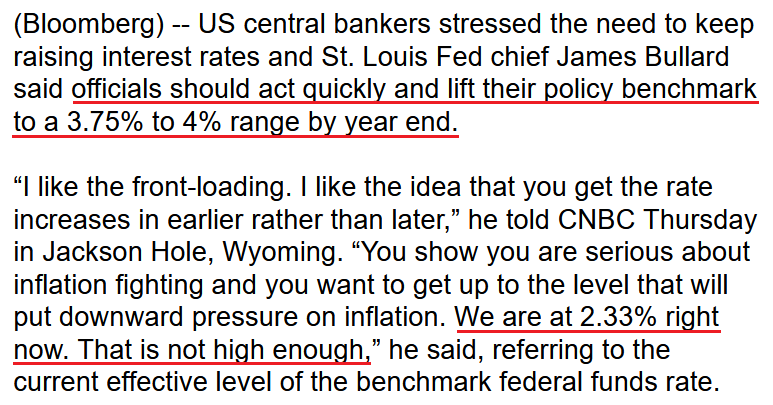 Source: Bloomberg
Likewise, Kansas City Fed President Esther George said on Aug. 25 that the central bank has “more work to do” with regards to interest rate hikes, and that “we are trying to get back to 2% inflation as quickly as we can, without doing damage to the economy.”
"So July looked like there was some easing in those price pressures, but certainly not enough that you would say, we're in the right direction," George said. "So I think we have more data to see. And I think we have more work to do, to begin to see that trend move down."
Thus, while George is on the more dovish side of the spectrum, she noted that the FFR may have to exceed 4% before it’s all said and done. For context, we expect inflation to be more problematic than the consensus realizes, and for the FFR to hit 4.5%+ in 2023.
Please see below:
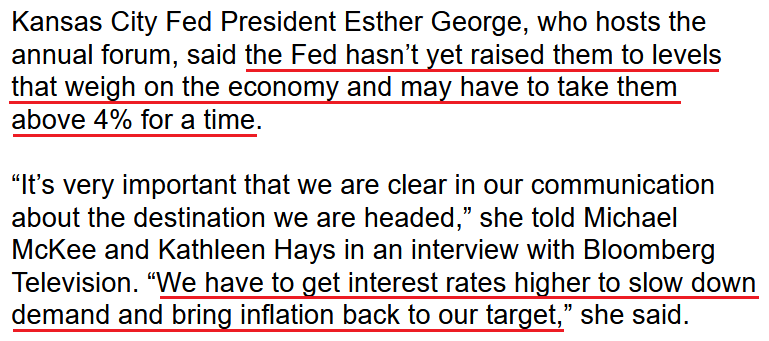 Source: Bloomberg
 Continuing the theme, Philadelphia Fed President Patrick Harker said on Aug. 25: “We don’t need to rush way up and then rush way down. We need to go up and sit for a while and let things play out,” adding that when rates are above 3.4%, they will begin to slow the economy.
As a result, while his FFR prediction is less hawkish than Bullard and George, he reiterated that curbing inflation is “Job One.”
Please see below:
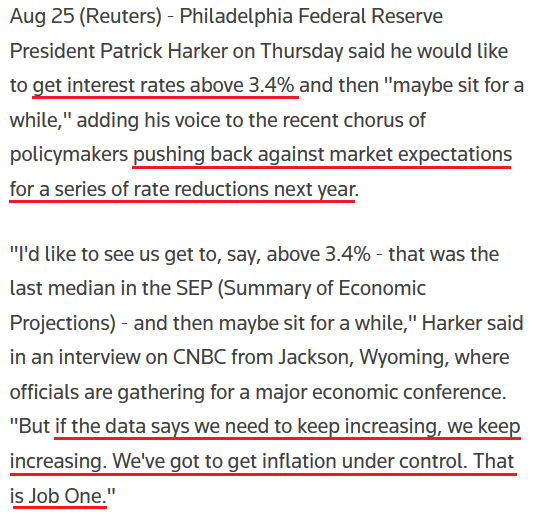 Source: Reuters
Joining the fray, Atlanta Fed President Raphael Bostic said on Aug. 25 that he’s split between a 50 or 75 basis point rate hike in September. “At this point, I’d toss a coin between the two,” he said. “We all, as policymakers, understand that inflation is a big problem and is a challenge that we’re going to do all that we can to handle.”
Thus, while it’s quite coincidental that Powell sent out his minions the day before his Jackson Hole speech, I noted during our post-FOMC recap on Dec. 16, 2021 that Powell uses his deputies as messengers. I wrote:
As one of the most important quotes of the press conference, he admitted:
“My colleagues were out talking about a faster taper, and that doesn’t happen by accident. They were out talking about a faster taper before the president made his decision. So it’s a decision that effectively was more than entrained.”
And while Powell sounded a little rattled during the exchange, his slip highlights the importance of Fed officials’ hawkish rhetoric. Essentially, when Clarida, Waller, Bostic, Bullard, etc., are making the hawkish rounds, “that doesn’t happen by accident.” As such, it’s an admission that his understudies serve as messengers for pre-determined policy decisions.
Therefore, if Powell is up to his old tricks, the hawkish rhetoric from Bullard, George, Harker, and to a lesser extent, Bostic on Aug. 25 may have been a subtle hint at his Jackson Hole speech. Only time will tell.
However, what’s not up for debate is the deteriorating fundamental outlook that confronts financial assets. With unanchored inflation mixed with deteriorating growth, investors have way too much faith in the Fed’s ability to solve the economic conundrum. So while the consensus assumes that a recession is unlikely, the reality is that avoiding a recession under these circumstances has never occurred since 1954.
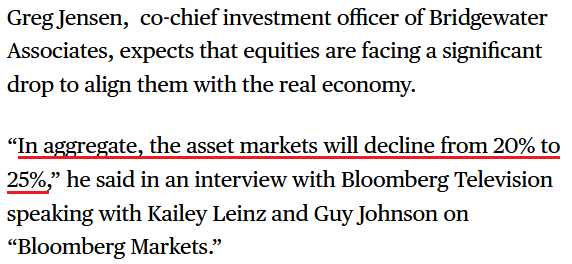
To that point, Greg Jensen, Co-Chief Investment Officer at Bridgewater Associates – the world’s largest hedge fund – warned on Aug. 25 that “inflation will be more stubborn” despite “the market pricing a decline in inflation to occur in a relatively stable economy.”
Furthermore, he added that long-only investors have nowhere to hide “to totally avoid this,” as the inflationary realities signal material downside for risk assets. Thus, while he’s one of the few that share our fundamental view, a realization is profoundly bearish for gold, silver, mining stocks and the S&P 500.
 Source: Bloomberg
The Bottom Line
While Powell's rhetoric today remains a coin flip, his deputies' hints on Aug. 25 foreshadow more hawkish policy in the autumn and winter months. Moreover, with investors' inflation and rate hike expectations below the Fed's forecast and the Fed's projection below ours and Jensen's forecast, there is plenty of room for more hawkish re-pricing.
As a result, while Powell may spark a short-term rally today, please remember that we've been here many times. For example, several Powell press conferences over the last ~18 months have ended with a weaker USD Index, lower real yields, and a higher GDXJ ETF. Yet, the former forged ahead to make new highs, while the latter sank to new lows. As such, the important point is that the Fed's inflation fight supports a stronger USD Index and higher real yields, and that the environment is bearish for the PMs.
In conclusion, the PMs rallied on Aug. 25, as the S&P 500 ended the day higher. However, the GDXJ ETF underperformed the general stock market, even as the USD Index and the U.S. 10-Year real yield retreated. Therefore, our medium-term expectations are unchanged.
Thank you for reading our free analysis today. Please note that the above is just a small fraction of the full analyses that our subscribers enjoy on a regular basis. They include multiple premium details such as the interim targets for gold and mining stocks that could be reached in the next few weeks. We invite you to subscribe now and read today’s issue right away.
Sincerely,
Przemyslaw Radomski, CFA
Founder, Editor-in-chief -
If Investors Revive After Jackson Hole, Will the GDXJ Rise?
August 25, 2022, 9:18 AMFinancial markets hold their breath before Powell’s bankers’ symposium speech. What would he have to say to change the bearish outlook for gold stocks?
The mood on Wall Street is relatively sleepy, as investors are unsure of how to position ahead of Powell’s Jackson Hole speech on Aug. 26. As a result, the PMs painted a mixed picture, as gold rose by 0.02%, silver fell by 0.63%, the GDX ETF rose by 0.82% and the GDXJ ETF rose by 1.76%. Moreover, the miners were aided by a 0.29% rise in the S&P 500, and the USD Index closed relatively flat, up by 0.06%.
Conversely, U.S. Treasury yields continued their ascent, and many markets have re-priced in hawkish directions. Thus, the PMs’ recent strength is much more semblance than substance.
Expecting the Impossible
With the late-summer sun offering a quiet reprieve for risk assets, the panic we witnessed in June has transformed into tranquility. Moreover, with recession fears declining materially and the Fed’s inflation fight seen as nearly complete, the consensus expects the Fed to work miracles and re-ignite another bull market.
However, the cross-asset implications signal materially different outcomes. For example, the Cleveland Fed forecasts another flat month of U.S. headline inflation, which has market participants assuming the Consumer Price Index (CPI) is on the fast track to 2%.
However, while prospect has helped uplift the S&P 500, as more buy into the notion of a soft landing, the U.S. 10-Year breakeven inflation rate rose to 2.62% on Aug. 24. Moreover, while the metric is well off its high of 3.02% set in April, why are 10-year inflation expectations rising when the Fed has supposedly won the inflation war?
Please see below:
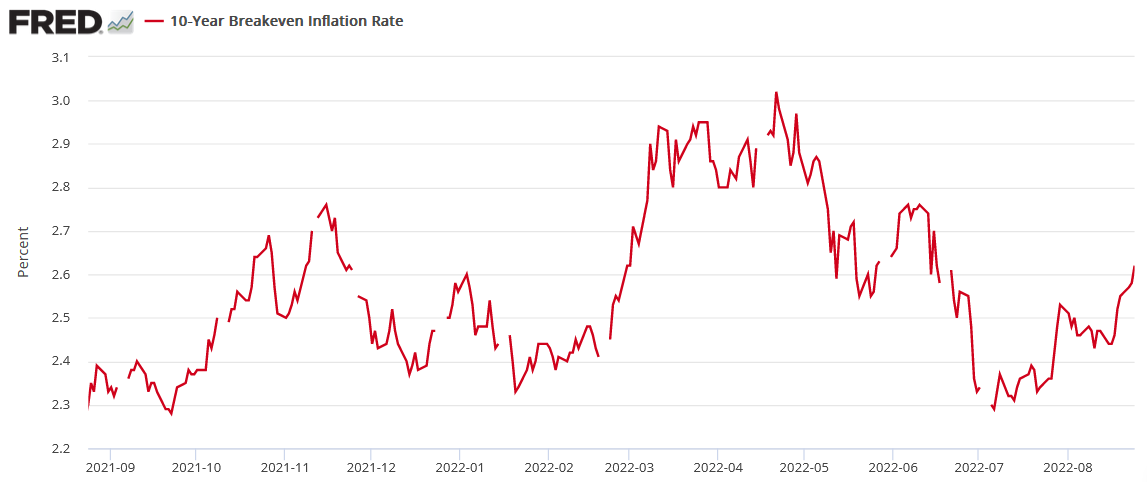
To that point, the GDXJ ETF often tracks the movement of the U.S. 10-Year breakeven inflation rate. Therefore, the latter’s bounce off the July lows has helped uplift the junior miners.
Please see below:
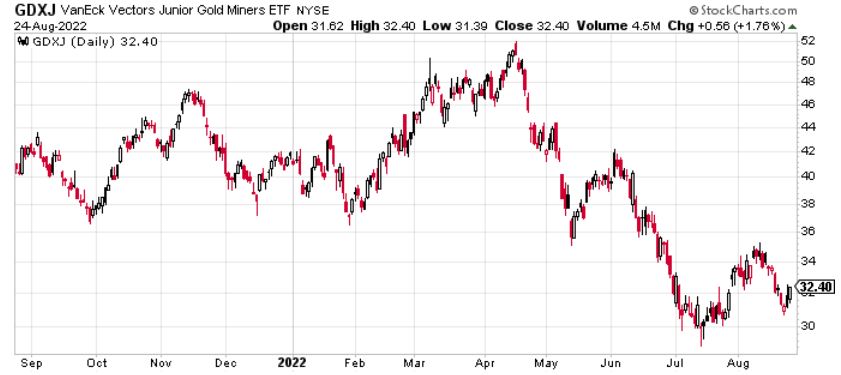
To explain, the peaks and valleys in the GDXJ ETF’s price over the last 12 months are quite comparable to the high-and-low points set by the U.S. 10-Year breakeven inflation rate. However, if you analyze the right side of both charts, you can see that the U.S. 10-Year breakeven inflation rate has surpassed its late July high, while the GDXJ ETF has not. As a result, the junior miners remain relative underperformers, despite the tailwind from investors’ contradictory expectations.
Furthermore, while the 10-year breakeven inflation rate has sought higher ground, so too has the U.S. 10-Year Treasury yield (closed at 3.11% on Aug. 24). Therefore, with the latter slightly outperforming the former, the U.S. 10-Year real yield remains positive and continues to rise.
Please see below:
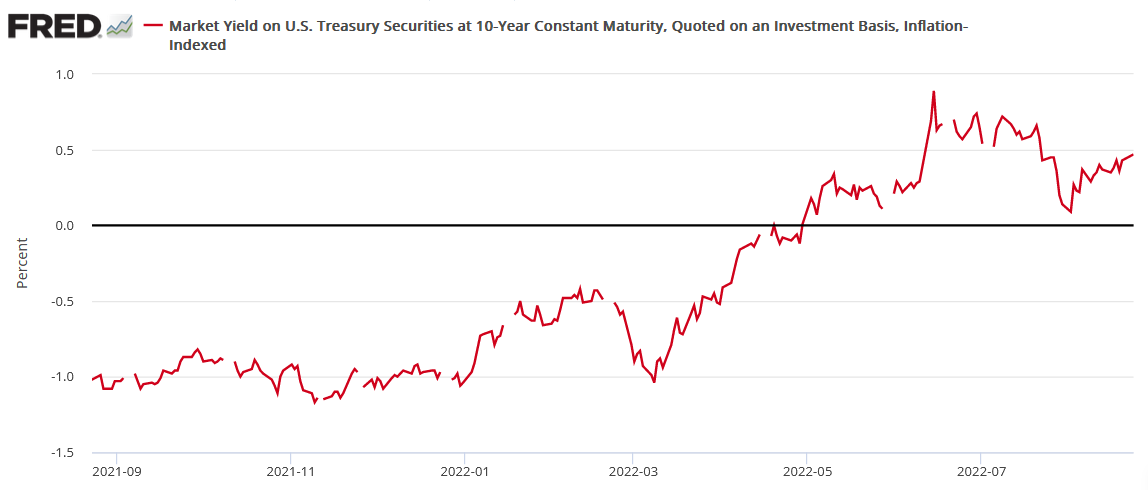
Thus, while I warned throughout 2021 that fighting inflation required a substantial increase in real yields, nothing has changed. In fact, while the S&P 500 remains relatively calm and the media opines that inflation is ‘old news,’ the bond market does not reflect this sentiment.
Think about it: quantitative tightening (QT) is set to double next week, and liquidating the Fed’s balance sheet should tighten financial conditions and help alleviate inflation (a quasi-rate hike). Moreover, if the Fed prioritizes moving long-term bonds, selling the U.S. 10-Year Treasury Note to front-run the action makes sense.
Conversely, the U.S. 10-Year breakeven inflation rate should not be rising if the consensus narrative is correct. With the Fed telegraphing further rate hikes and QT poised to enhance the tightening pressure, these tools should reduce investors’ inflation expectations, not enhance them. As such, the ‘Fed pivot’ narrative that helps uplift the S&P 500, gold, silver, and mining stocks is built on a faulty foundation.
As further evidence, the interest rate futures market created the pivot narrative by pricing in rate cuts in 2023. However, while the interest rate futures market had priced in a 3.20% U.S. federal funds rate (FFR) during peak pivot expectations, that figure has ratcheted higher to 3.79%.
Please see below:
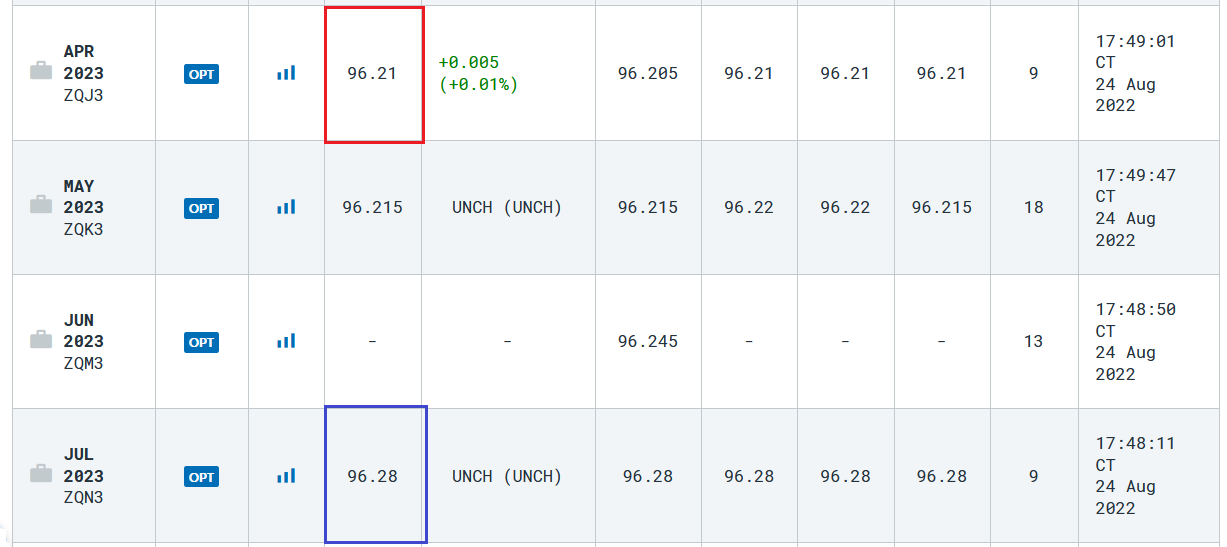 Source: CME Group
To explain, the quotes above track the 30-day FFR futures for various monthly expirations. For context, the implied interest rate is calculated by subtracting the last settlement price from 100. Therefore, the red box above shows that market participants are pricing in a peak FFR of 3.79% in April 2023 (100-96.21). Moreover, the blue box above shows they’re still pricing in an immaterial rate cut in July 2023 (100-96.28 = 3.72%).
Thus, while a peak FFR of 3.79% is still well below the 4.5%+ we expect in 2023, the bond and futures markets have readjusted their expectations in a profoundly hawkish manner. Furthermore, the FX market also aligns.
Please see below:
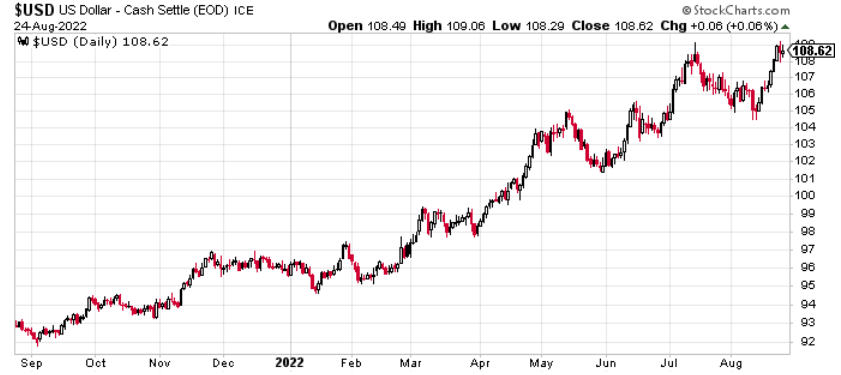
To explain, the USD Index has recouped nearly all of its July declines and is near a ~20-year high. As a result, all of the hawkish fundamental realities that upended the S&P 500 and the PMs throughout 2022 have resurfaced, while only the narrative has changed.
Therefore, the important point is that many markets have re-priced to reflect the difficulty of normalizing unanchored inflation. However, the PMs and the S&P 500 have not. As such, with the bulls’ expectations contrasting history and the positioning in the bond, futures, and FX markets, gold, silver, mining stocks, and the S&P 500 should suffer mightily when the light bulb goes off.
A Round Trip
While I warned throughout 2021 that inflation would force the Fed’s hand and result in several interest rate hikes, the consensus’ faith in the central bank is as misguided now as it was then. For example, please see this Reuters headline from June 2021:
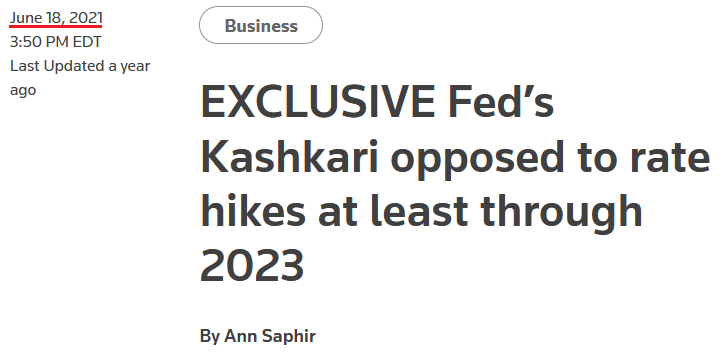
Minneapolis Fed President Neel Kashkari said at the time:
"I still have no hikes in the SEP forecast horizon because I think it’s going to take time for us really to really achieve maximum employment, and I do believe that these higher inflation readings are going to be transitory."
Thus, while the bulls were keen to follow Kashkari’s guidance (don’t fight the Fed), we’ve had nine 25 basis point rate hikes in 2022, another 50 to 75 basis points should commence in September and QT is set to double.
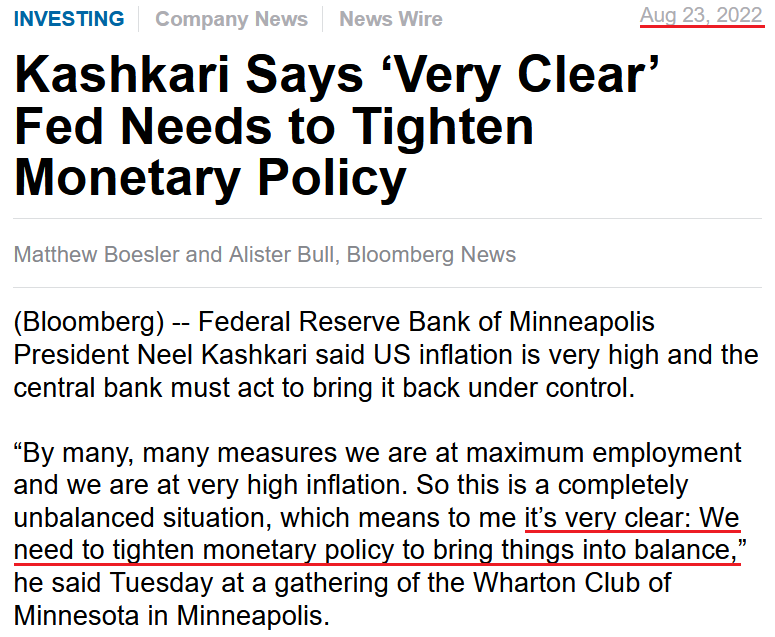
Furthermore, with the most dovish Fed member in 2021 now one of the most hawkish, it’s amazing the difference ~14 months makes.
Please see below:
 Source: Bloomberg
He added:
“When inflation is 8% or 9%, we run the risk of unanchoring inflation expectations and leading to very bad outcomes that would cause us to have to be very aggressive – Volcker-esque – to then re-anchor them. We definitely want to avoid allowing that situation to develop. So with inflation this high, for me, I’m in the mode of we need to err on making sure we’re getting inflation down, and only relax when we see compelling evidence that inflation is well on its way back down to 2%.”
Thus, while Kashkari has finally seen the light, not all FOMC member shares his view, and the S&P 500 and the PM bulls certainly don’t. In a nutshell: they continue to position for a dovish pivot because Fed Chairman Jerome Powell labels inflation as troubling but easily solvable.
However, history suggests otherwise. Remember, Powell is trying to reduce 9%+ peak (for now) inflation with a ~3.5% FFR. If successful, he will accomplish what no other Fed Chairman has before him.
Therefore, do you think that prior committees wanted to take the FFR above or within ~50 basis points of the year-over-year (YoY) CPI? Of course not. If they could have alleviated inflation without inflicting economic hardship, they would have done so. Thus, I warned on Aug. 12 that investors are ignoring history at their own peril. I wrote:
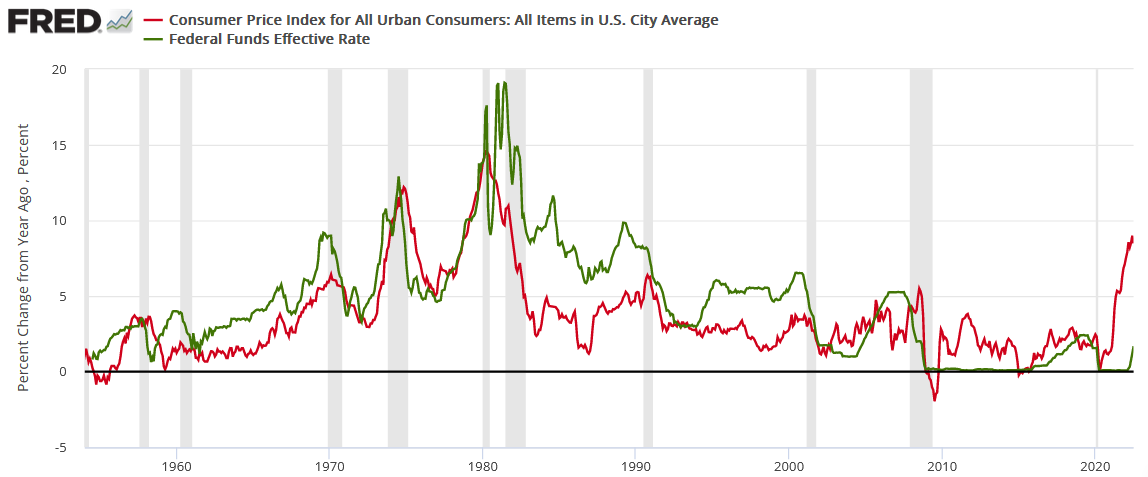
The FFR has either eclipsed the YoY headline CPI or come within ~50 basis points of its peak in every inflation fight since 1954. Therefore, please see the unprecedented gap on the right side of the chart. With the YoY headline CPI peaking (for now) at 9.1% and the FFR at 2.5% (the high end of the Fed's 2.25% to 2.5% range), the difference is 6.6%.
As a result, history implies the FFR needs to hit at least 8.6% (which marks ~50 basis points below the current CPI peak). Moreover, while we don't expect the FFR to hit this level, the purpose is to show just how laughable a 3.5% FFR and 9%+ inflation is from a historical perspective. In reality, a 4.5%+ FFR is much more realistic, and the prospect is far from priced in.
In addition, notice how every inflation spike leads to a higher FFR and then a recession (the gray bars)? As such, do you really think this time is different?
The Bottom Line
From a fundamental perspective, investment returns are driven by the difference between what’s priced in and what actually occurs; and with investors pricing in extremely unrealistic outcomes, the Fed will re-write history if it pulls off a soft landing. Moreover, while the S&P 500 and the PMs behave as if a Goldilocks outcome is inevitable (the stock market is only pricing in a 20% chance of a recession), the futures, bond and FX markets have much less faith. As a result, narratives are all the bulls have on their side at this point.
In conclusion, the PMs were mixed on Aug. 24, as silver ended the day in the red. Moreover, while the financial markets have largely gone quiet as investors await Powell’s Jackson Hole speech, nothing he says will change the troubling fundamental realities that confront financial assets in the months ahead. Therefore, we expect the GDXJ ETF to hit lower lows over the medium term, regardless of whether Powell sparks a short-term rally in the days ahead.
-
Don’t Be Influenced by Powell’s Upcoming Speech
August 24, 2022, 8:43 AMWith oil prices rallying on the hope of output cuts by OPEC+, the PMs benefited from the enthusiasm. For example, gold rose by 0.73%, silver by 0.78%, the GDX ETF by 1.70% and the GDXJ ETF by 2.08%. Moreover, profit-taking helped push the USD Index lower by 0.39%. However, long-term Treasury yields jumped, and with quantitative tightening (QT) set to double next week, the PMs’ optimism is unlikely to last.
The Bull/Bear Narratives
While the consensus assumes that peak inflation means the Fed is closer to the end of its tightening cycle than the beginning, I’ve warned on numerous occasions that normalizing the metric to 2% will result in much more economic pain than currently expected. Therefore, while the financial markets tread water in anticipation of Fed Chairman Jerome Powell’s Jackson Hole speech, the reality is that his words don’t change the medium-term ramifications.
For example, the bears are hoping that Powell will reaffirm his commitment to reducing inflation on Aug. 26, resulting in lower asset prices as the hawkish realities resurface. In contrast, the bulls hope that Powell will strike a dovish tone and help re-ignite the risk rally that pushed the S&P 500 above 4,300 and helped uplift gold, silver and mining stocks.
However, while sentiment moves markets in the short term, nothing that Powell says will change the deteriorating U.S. economic outlook. Furthermore, Powell was profoundly dovish during his post-FOMC press conference on Jul. 27, and other than looser financial conditions, little has changed fundamentally that signals a 180 in his communication.
As such, it’s prudent to look past the daily narratives and focus on the realities that manifest when the Fed attempts to rein in unanchored inflation.
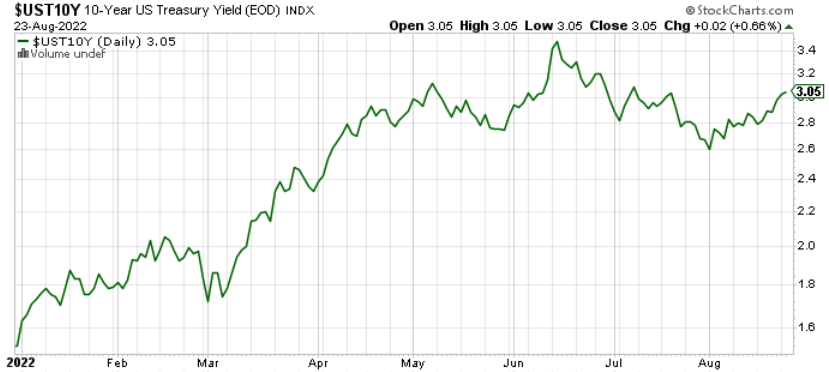
Speaking of which, the U.S. 10-Year Treasury yield closed above 3% on Aug. 23, and the recently elusive milestone helps the benchmark inch closer to its 2022 highs.
Please see below:
Furthermore, if you analyze the bottom right-hand corner of the chart below, you can see that the 10-2 spread has started to turn.
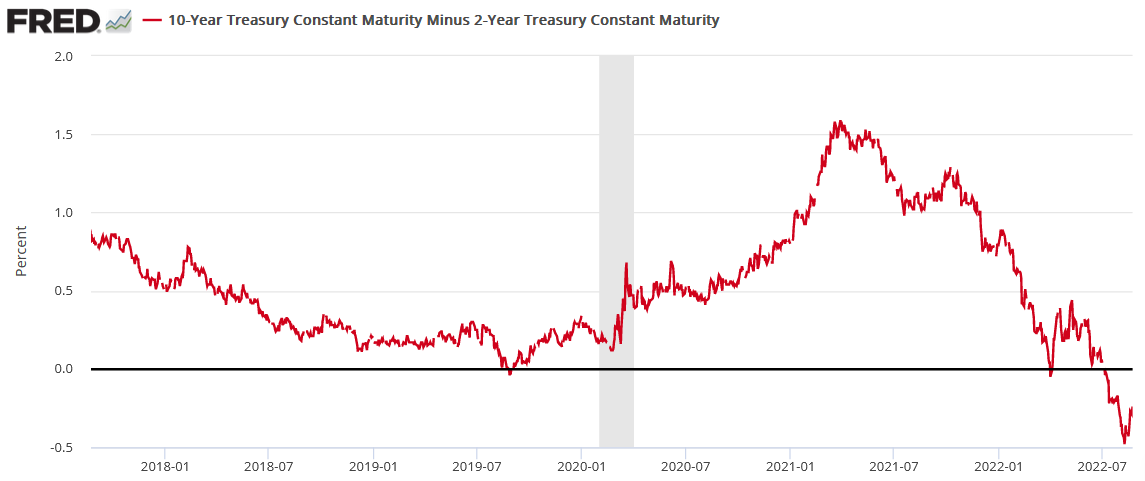
For context, the spread is calculated by subtracting the U.S. 2-Year Treasury yield from the U.S. 10-Year Treasury yield. In a nutshell: when the 2-year outperforms, the red line falls (flattening), and when the 10-year outperforms, the red line rises (steepening).
The media now highlights how a negative (inverted) 10-2 spread is the bond market’s way of signaling an impending recession. However, while this is true, the important point is that a negative 10-2 spread often steepens before recessions.
Please see below:
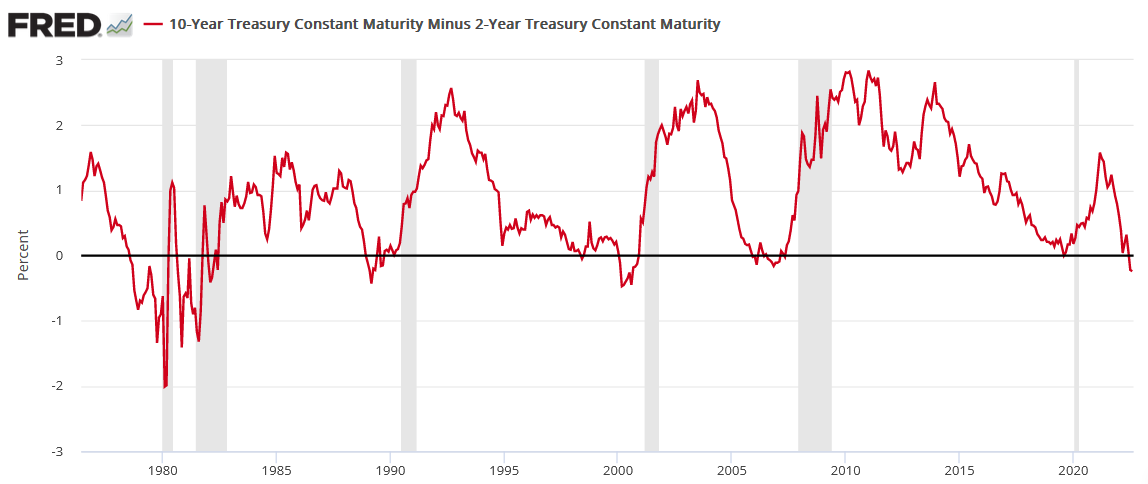
To explain, the early 1980s show a more mixed picture. However, the lead-up to the recessions in 1990, 2000 and 2010 (the vertical gray bars) shows how the 10-2 spread often steepens from a negative base before an economic climax unfolds. For context, the chart above uses monthly data, so the move on the right side doesn’t capture the small uptick shown on the daily chart that preceded it.
However, the fundamental implications are more relevant than what Powell says or doesn’t say on Aug. 26.
PMI Problems
S&P Global released its U.S. Composite PMI on Aug. 23. The headline index declined from 47.7 in July to 45.0 in August, marking the “second successive monthly decrease in total business activity.” Also, a reading below 50 signals that the U.S. manufacturing and service sectors are in contraction.
Please see below:
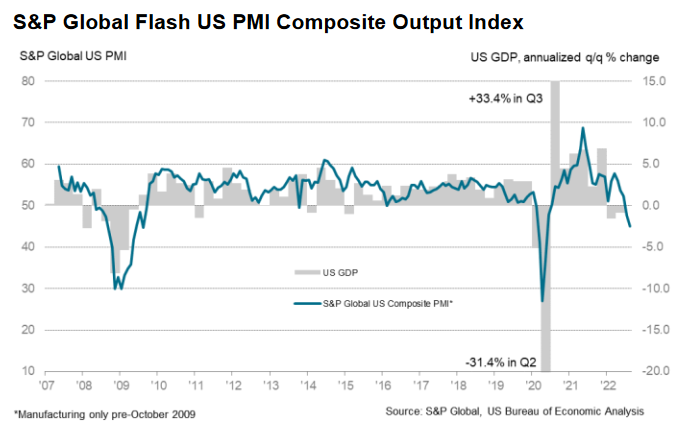
To explain, the blue line above tracks S&P Global’s U.S. Composite PMI, while the gray bars above track the annualized quarter-over-quarter (QoQ) percentage change in U.S. GDP. If you analyze the right side of the chart, you can see that the blue line has sunk to levels seen during the global financial crisis (GFC) and the COVID-19 crash.
Furthermore, the data shows how sharp declines in the blue line culminated with sharp declines in U.S. GDP in 2008 and 2020. As a result, while a small technical recession has already occurred, a continuation of the trend implies a broad-based slide in economic activity.
Conversely, while inflation and employment have softened, they’re still increasing as output falters. The report revealed:
“Weak client demand and lower new orders led firms to scale back their hiring efforts, as employment rose at the slowest pace in 2022 to date. Although some companies
continued to note challenges finding suitable replacements for voluntary leavers, a growing number of firms stated that uncertainty and rising costs led them to delay the immediate replacement of staff.”In addition:
“In line with the trend for cost burdens, firms increased their selling prices at the softest pace in 18 months in August. The softer rise in output charges was linked to efforts to pass through any concessions to customers to encourage the placement of orders. That said, the rate of inflation was marked overall and faster than in any period before March 2021.”
Thus, while the picture is nowhere near perfect, the reality is that employment and inflation rose during the survey period from Aug. 5 to Aug. 27. As such, the results are bullish for Fed policy because the central bank’s dual mandate is maximum employment and price stability.
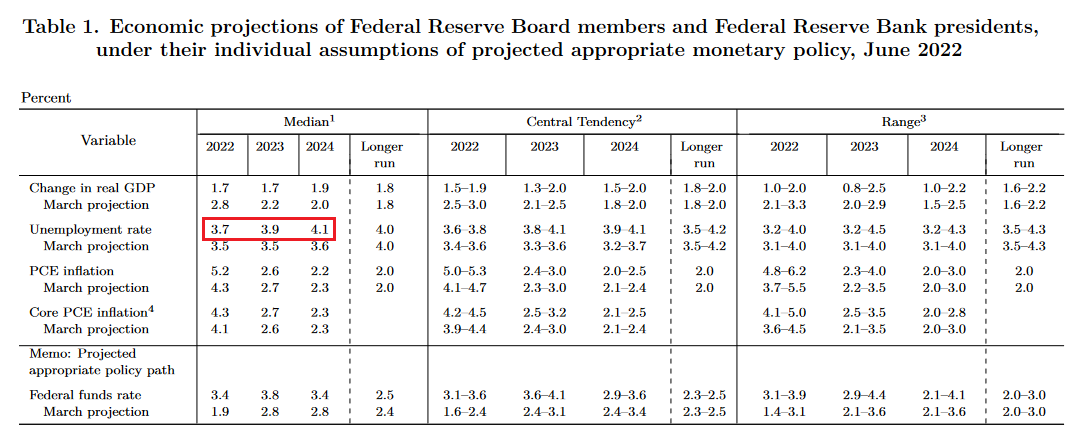
To that point, with the U.S. unemployment rate hitting a ~50-year low of 3.5% in July, further labor market strength is antithetical to the Fed’s 2022 projection of a 3.7% unemployment rate and its ability to reduce wage inflation.
Please see below:
 Source: U.S. Fed
Continuing the theme, the Richmond Fed released its Fifth District Survey of Manufacturing Activity on Aug. 23. Moreover, the headline index declined from 0 in July to -8 in August, as “the indexes for shipments and volume of new orders slid from 7 and −10 in July to −8 and −20 in August.”
Please see below:
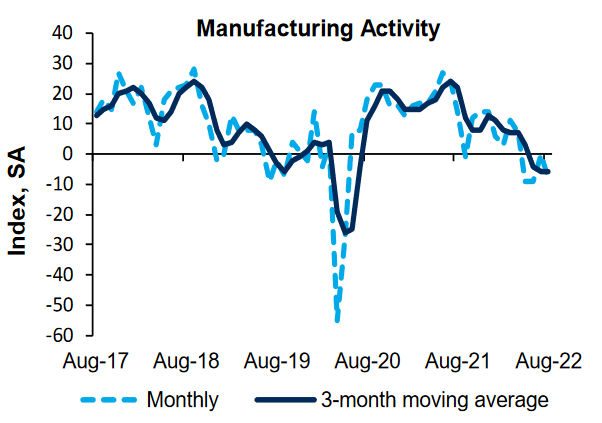
Source: Richmond Fed
In contrast, the Richmond Fed’s employment index increased from 8 in July to 11 in August. As a result, the U.S. labor market continues to showcase immense resiliency.
Please see below:
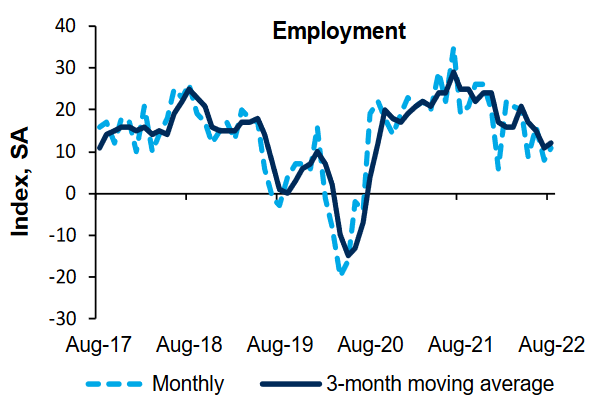 Source: Richmond Fed
In addition, the report revealed that “the average growth rate of prices paid was virtually flat in August, while the average growth rate of prices received increased somewhat.” Thus, it’s become a recurring theme that as output indices crater, employment and inflation remain highly elevated.
Please see below:
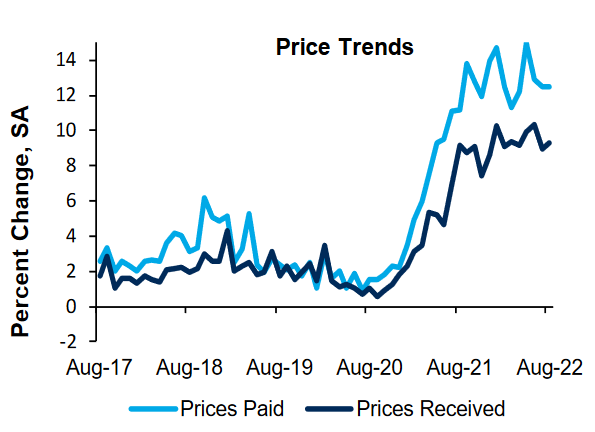 Source: Richmond Fed
Furthermore, the developments highlight the growth-inflation divergence that I’ve warned about for months. With the Fed slow-rolling toward tighter monetary policy, the central bank allowed inflation to fester while growth decelerated. Moreover, history shows that the longer inflation remains elevated, the more it pressures growth and further widens the gap. Therefore, the Fed needs to hammer inflation to avoid a 1970s-style malaise.
Likewise, while U.S. employment remains resilient for now, history reminds us that inflation upends growth first, then comes for the U.S. labor market. To explain, I wrote on Aug. 16:
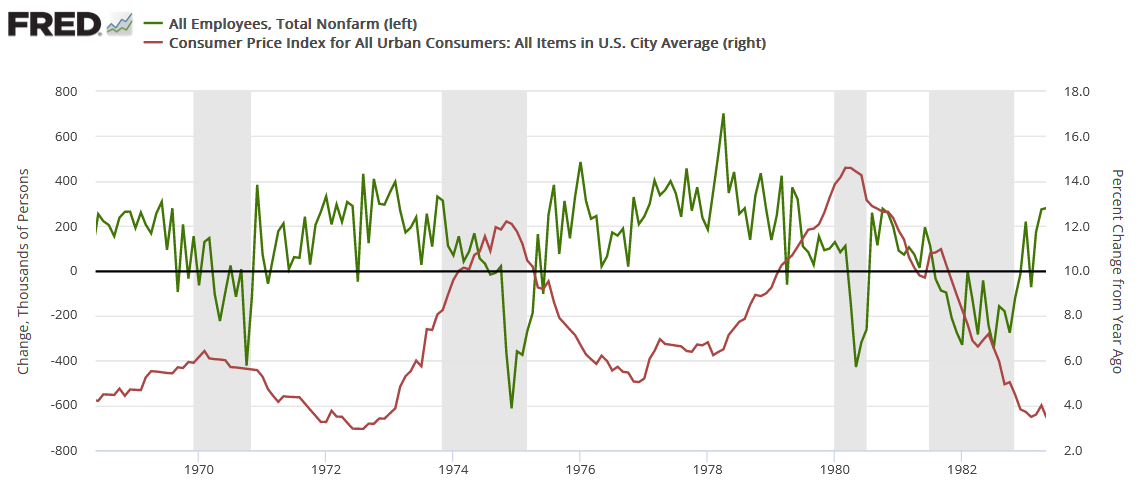
The red line above tracks the year-over-year (YoY) percentage change in the headline CPI, while the green line above tracks the monthly change in U.S. nonfarm payrolls. For context, the consensus cites near-record job openings and robust payrolls growth as evidence for why only a mild recession can occur (if one occurs at all).
However, the chart above highlights how unanchored inflation torpedoed that narrative in the 1970s. If you analyze the shaded gray areas (recessions), notice how the green line remained positive during the early stages of the recessions in 1970, 1974, and 1980? In a nutshell: monthly payrolls growth stayed positive during the outset of all three recessions.
However, if you focus your attention on the sharp drops in the green line near the end of the 1970, 1974, and 1980 recessions (negative monthly payrolls prints), you can see that reality re-emerged and the U.S. labor market suffered mightily. Moreover, negative payrolls growth was also present during the 1982 recession, but inflation was declining at that time.
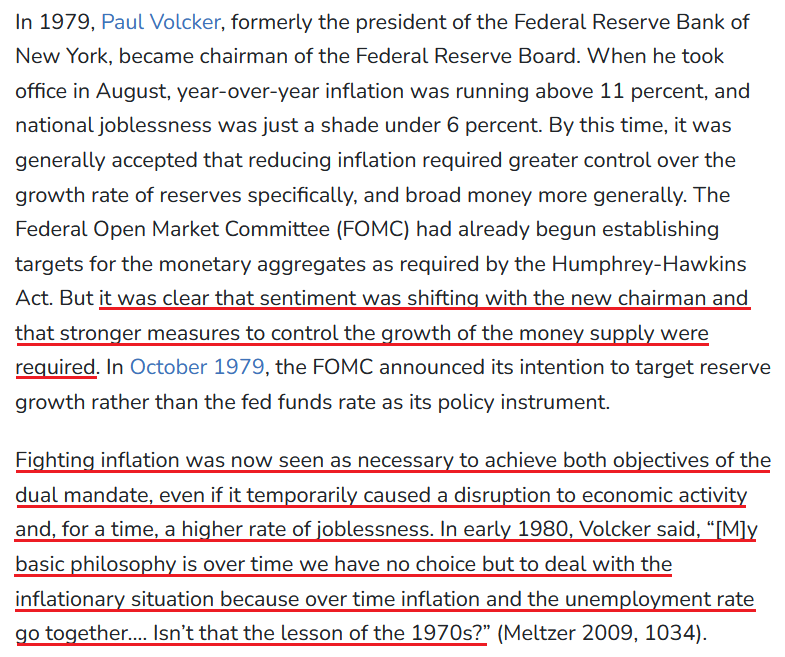
As further evidence, Paul Volcker’s inflation-fighting crusade was built on the notion that unanchored inflation would eventually derail the labor market. Thus, investors don’t realize that a patient Powell will only make a bad situation worse.
 Source: U.S. Fed
The Bottom Line
While the short-term fate of the S&P 500 and the PMs likely hinges on Powell’s rhetoric, it’s foolhardy to place too much emphasis on a largely immaterial speech. In reality, the deteriorating technical and fundamental backdrops confronting gold, silver, and mining stocks will be more impactful over the medium term. Therefore, while Powell’s message on Aug. 26 is anyone’s guess, the bearish realities that confront risk assets in the months ahead are crystal clear.
In conclusion, the PMs rallied on Aug. 23, as they benefited from the USD Index’s small pullback. However, the U.S. 10-Year real yield rose once again, and higher real yields and a stronger U.S. dollar should be on the horizon. As such, the PMs will likely head in the opposite direction as the drama unfolds.
-
With the EUR/USD at a 20-Year Low, What Are Gold’s Prospects?
August 23, 2022, 7:47 AMWhile the S&P 500 and the NASDAQ Composite suffered drawdowns of 2.14% and 2.55%, respectively, on Aug. 22, the PMs held up relatively well. For example, gold declined by 0.82%, silver by 1%, the GDX ETF rose by 0.08% and the GDXJ ETF fell by 0.45%. However, the USD Index rallied by 0.82% and U.S. Treasury yields also sought higher ground. As such, the price action across asset classes largely met our expectations.
Awaiting Jackson Hole
With Fed Chairman Jerome Powell scheduled to speak at the annual Jackson Hole symposium on Aug. 26, the financial markets were in front-run mode on Aug. 22. Moreover, while the S&P 500 suffered mightily, the risk-off sentiment was less bearish than it seemed, as high beta assets like Bitcoin were relatively behaved.
However, the GDXJ ETF closed at another monthly low, which enhanced the profits from our short position; and with the EUR/USD hitting a new 2022 low, the FX market signals more downside for the S&P 500 and the PMs over the medium term.
Please see below:
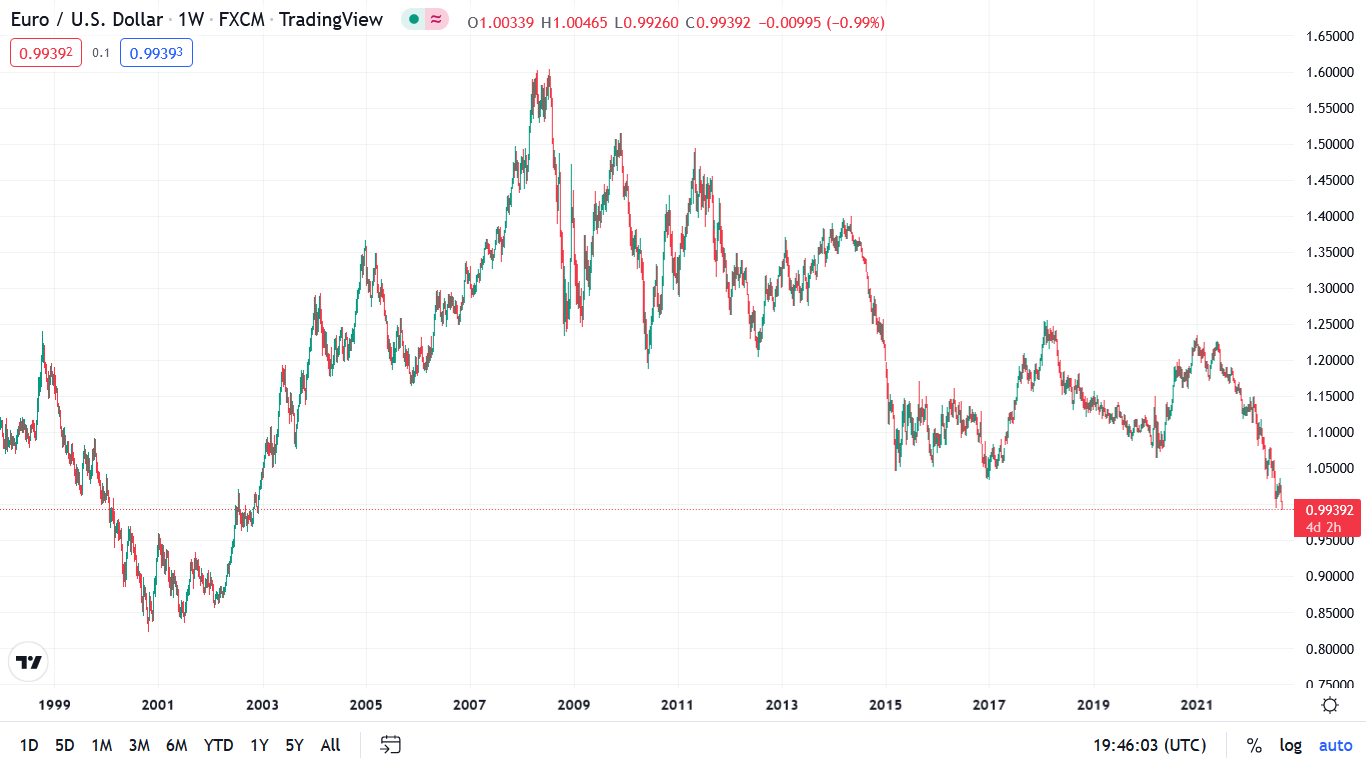
To explain, the candlesticks above track the EUR/USD. As you can see, the currency pair is stuck at a ~20-year low. Furthermore, I warned repeatedly that the U.S. dollar was headed higher and the euro would be a material laggard. I wrote on Oct. 20, 2021:
While market sentiment implies that the USD Index’s best days are in the rearview, the ‘new narrative’ couldn’t be further from the truth. To explain, Bloomberg published the following article on Oct. 19:
(…) The bottom line? While headlines have turned on the U.S. dollar, the greenback’s fundamentals remain robust. The ECB and the BoJ are more dovish than the Fed (the EUR/USD and the USD/JPY are the most important currency pairs within the USD Index) and the BoC still hasn’t made any major moves. Likewise, with rising U.S. Treasury yields also supportive of a stronger U.S. dollar, the greenback should continue its uptrend once reality re-emerges.
Thus, while the crowd understands now that the Fed is no longer “well behind” and is instead leading the pack, the euro’s drop to new 2022 lows delivered a profound fundamental message. Therefore, while stocks basically suffered a token sell-off on Aug. 22, investors still don’t appreciate the fundamental headwinds on the horizon.
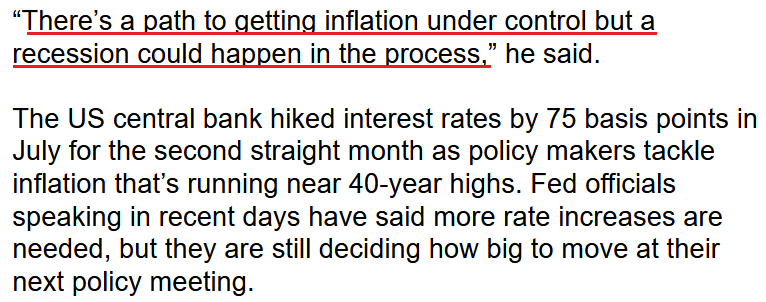
To that point, while the bulls plea for a dovish pivot, the realities of unanchored inflation make the current setup nothing like the post-GFC environment. Moreover, Richmond Fed President Thomas Barkin said on Aug. 19:
“We’re committed to returning inflation to our 2% target and we’ll do what it takes to get there (…). Getting inflation under control is going to be necessary to set up what we have the potential to do in the economy. I’ve convinced myself that not getting inflation under control is inconsistent with a thriving economy.”
As a result, while I’ve warned on numerous occasions that the biggest risk to the U.S. economy is not raising interest rates, Barkin understands that a rate-hike-induced recession is preferable to a hyperinflationary collapse.
Please see below:
 Source: Bloomberg
Furthermore, reality reminds us that the Fed hasn't successfully curbed unanchored inflation without triggering a recession since 1954. Thus, with data from Bank of America showing that the S&P 500 has only priced in a 20% chance of a recession, the expectations imbalance leaves plenty of room for further downside. I wrote on Aug. 22:
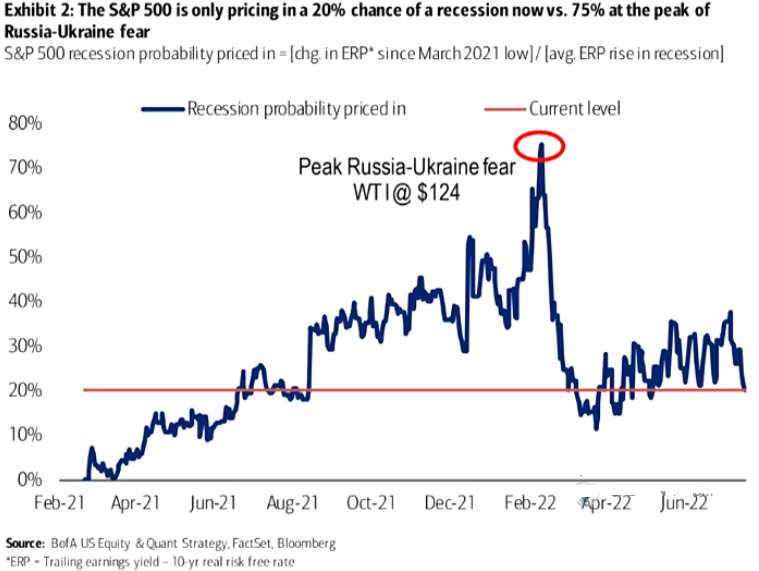
To explain, the blue line above tracks the recession odds priced into the S&P 500. For context, Bank of America forecasts the metric by dividing the change in the equity risk premium (ERP) since March 2021 by the average change in the ERP during historical recessions. If you analyze the high in early 2022, peak fear had investors pricing in a 75% chance of recession. Yet now, the metric stands at 20%.
In addition, while the NASDAQ 100 has declined by 4.6% from its Aug. 18 close, the post-GFC crowd is still following its outdated playbook.
Please see below:
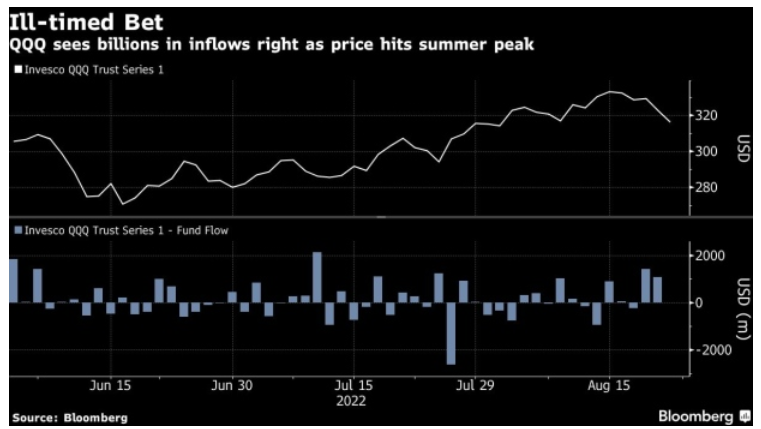
To explain, the white line above tracks the Invesco QQQ ETF (which replicates the NASDAQ 100), while the blue bars at the bottom track fund flows. If you analyze the right side of the chart, the two positive blue bars highlight how investors poured money into the ETF as the FOMO rally approached its precipice. As a result, while the consensus opines that “everyone is bearish,” actions speak louder than words.
The Bloomberg article stated:
“Investors piled about $3.2 billion into the Invesco QQQ Trust Series 1 ETF (ticker QQQ) last week, the biggest weekly inflow since December, only to see the fund snap a four-week winning streak, ending down 2.3%.
“QQQ’s rally from its June lows, stoked by the market’s expectations for a pivot to slower rate hikes, is fizzling after Federal Reserve policymakers warned that interest rates are going higher and investors brace for more hawkish commentary at the upcoming Jackson Hole meeting.”
On top of that, financial conditions remain relatively loose, and Powell will only create more inflationary problems if he repeats his blunder from Jul. 27.
Please see below:
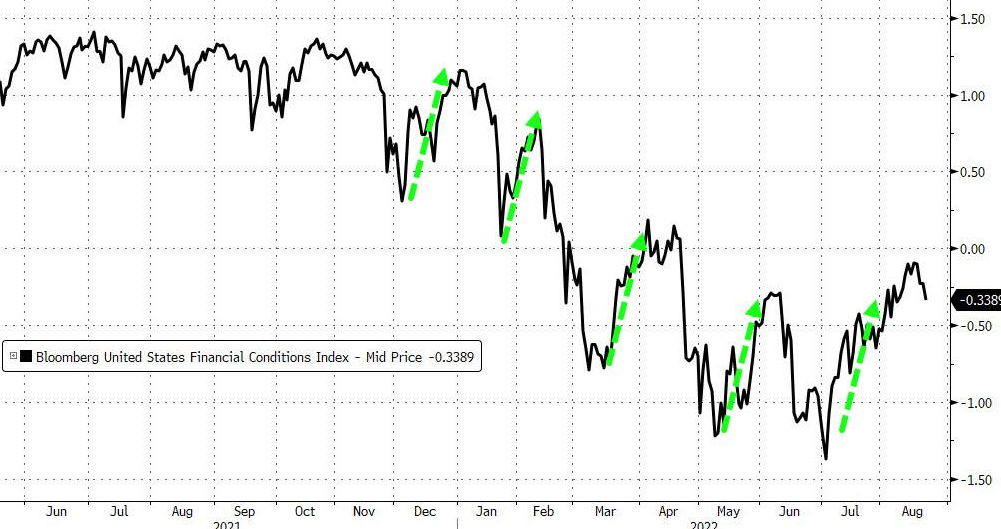 Source: Bloomberg/ZeroHedge
To explain, the black line above tracks the Bloomberg Financial Conditions Index (FCI). For context, when the black line falls, financial conditions tighten, and when it rises, financial conditions loosen. If you analyze the green arrows, you can see that each time investors attempted to stage risk-on rallies, Fed officials had to hammer home their hawkish message. As such, the metric has made lower highs and lower lows.
Furthermore, while stocks have declined modestly, Treasury yields have risen, and high yield credit spreads have bounced off their lows, the U.S. dollar is the only FCI component at or near its 2022 high. Therefore, the black line’s turn on the right side of the chart has only erased a small portion of the loosening that unfolded in July.
Thus, Powell needs to push the black line closer to its lows to alleviate inflation, which implies material tightening and more pressure on asset prices.
Likewise, while Powell needs to say this at Jackson Hole to avoid another round of ambiguity, the rate market aligns with the FX market (hawkish and long USD), and the S&P 500 and the PMs’ prices are still far from reflecting these fundamental developments.
Please see below:
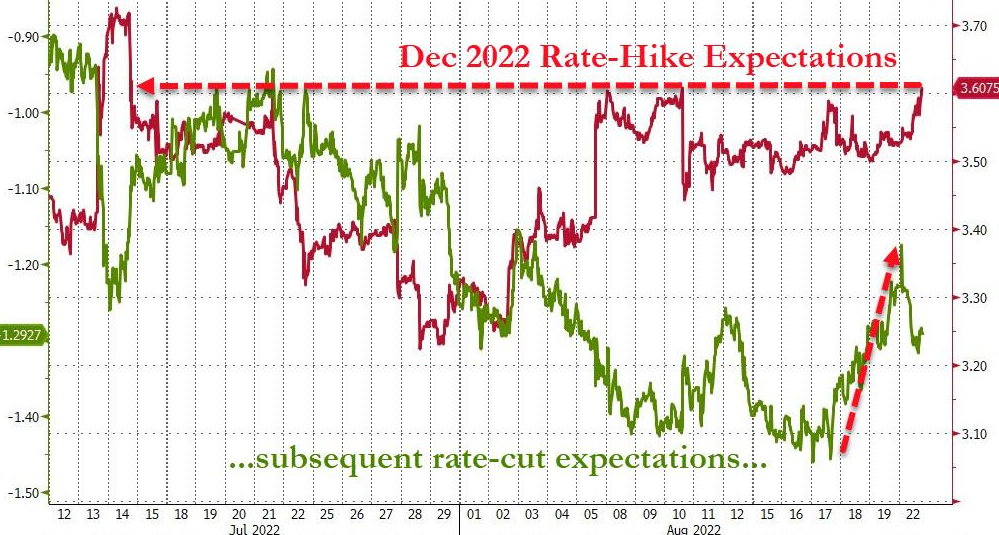 Source: Bloomberg/ZeroHedge
To explain, the red line above tracks the consensus December 2022 rate hike expectations, while the green line above tracks the inverted (down means up) rate cut expectations. If you analyze the movement of the former, you can see that the futures market is back to pricing in a more hawkish Fed path. Likewise, the rising green line shows how rate cut expectations have moved off their highs.
Therefore, while we expect these metrics to become even more hawkish (4.5%+ fed funds rate in 2023), I warned on Aug. 12 that investors’ expectations were in fantasy land. I wrote:
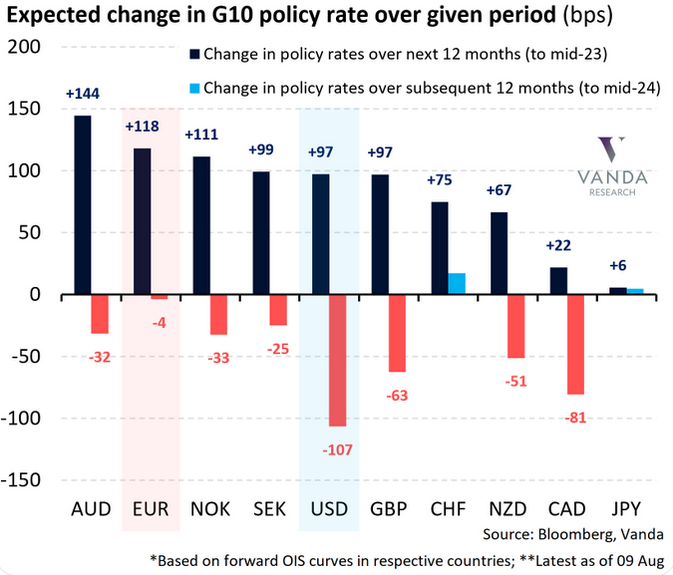
If you analyze the USD column, you can see that “peak inflation” has investors pricing in 97 basis points of rate increases over the next 12 months and 107 basis points of rate cuts from mid-2023 to mid-2024. Therefore, the consensus expects the U.S. dollar to be a relative underperformer as other central banks play catch-up.
To that point, the EUR column shows that investors expect 118 basis points of rate increases over the next 12 months and 4 basis points of rate cuts from mid-2023 to mid-2024. Thus, the expectations are bullish for the EUR/USD, which accounts for nearly 58% of the USD Index’s movement.
However, investors’ rate hike/cut expectations are in la-la land. The idea that the ECB will out-hawk the Fed by hiking more and cutting less contrasts fundamental reality. Furthermore, the Eurozone is in much worse economic shape than the U.S., and the EUR/USD should continue its descent when investors realize this.
All in all, with the U.S. dollar rallying, the euro falling, and investors’ U.S. rate hike expectations ratcheting higher, we’re back to some semblance of reality. Moreover, with the theme likely to continue in the months ahead, gold, silver, and mining stocks are unlikely to benefit from the pro-USD fundamental environment. As a result, our GDXJ ETF short position has the potential to reap even more profits in the months ahead.
Low Probability, High Impact
With a “tail risk” defined as a rare event that could cause immense damage if realized, investors often use the term to reference potential outcomes that are three standard deviations away from what’s expected. However, the difference between what the consensus expects and what should occur highlights why the S&P 500 and the PMs are likely far from their medium-term lows.
Please see below:
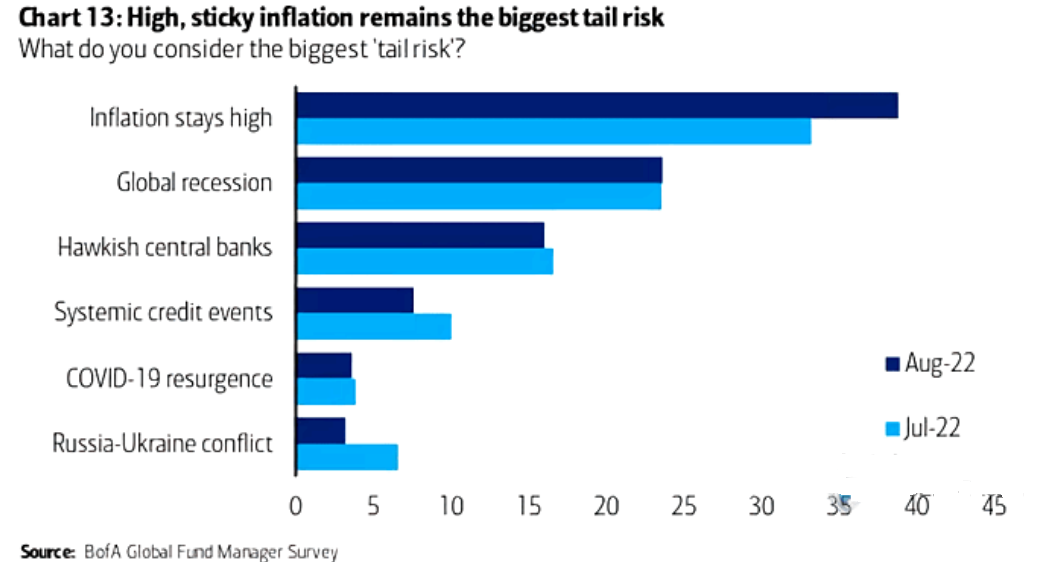
To explain, the dark blue bar above shows how investors’ fears over “sticky inflation” increased in Bank of America’s latest Global Fund Manager Survey. However, what the consensus believes is a tail risk is actually extremely likely to occur.
As evidence, when market participants celebrated the headline Consumer Price Index’s (CPI) deceleration on Aug. 10 – which was due to lower oil & gas prices – I noted on Aug. 11 how the Atlanta Fed’s Sticky CPIs hit new 2022 highs. I wrote:
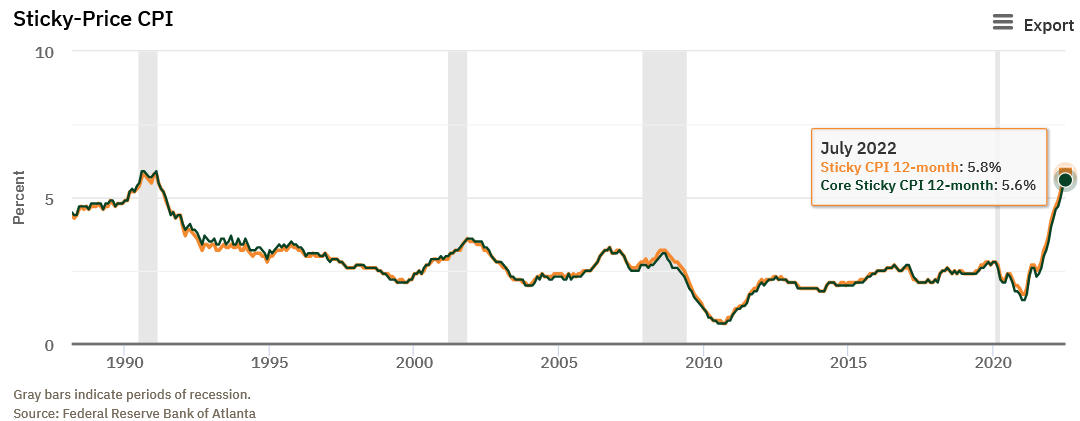
To explain, the orange and green lines above track the YoY percentage changes in the Sticky and core Sticky (excluding food and energy) CPIs. If you analyze the right side of the chart, you can see that neither decelerated in July.
For context, the Atlanta Fed defines the metrics as:
“The Sticky CPI is calculated from a subset of goods and services included in the CPI that change price relatively infrequently. Because these goods and services change price relatively infrequently, they are thought to incorporate expectations about future inflation to a greater degree than prices that change on a more frequent basis.”
Thus, while volatile energy prices made the headline CPI look less fierce on the surface, inflation is broadening and remains embedded in the U.S. economy. As a result, while the recent risk rally was built on the hopes of peak inflation and a dovish pivot, fundamental realities should materially shift sentiment over the medium term.
The Bottom Line
While the USD Index is on fire and real yields are increasing, financial conditions are still looser than in July. Therefore, while the rates and FX markets have done some of Powell’s work for him, he needs to emphasize his hawkish message on Aug. 26 or he’ll risk reversing the progress once again. Furthermore, the Fed still underestimates its inflation fight and the S&P 500 is materially overvalued. As such, a reversal of these imbalances should weigh heavily on the PMs in the months ahead.
In conclusion, the PMs were mixed on Aug. 22, as the GDX ETF closed in the green. However, with gold, silver and mining stocks’ technical and fundamental outlooks still headed in the wrong directions, lower lows should be on the horizon.
Thank you for reading our free analysis today. Please note that the above is just a small fraction of the full analyses that our subscribers enjoy on a regular basis. They include multiple premium details such as the interim targets for gold and mining stocks that could be reached in the next few weeks. We invite you to subscribe now and read today’s issue right away.
Sincerely,
Przemyslaw Radomski, CFA
Founder, Editor-in-chief


Gold Investment News
Delivered To Your Inbox
Free Of Charge
Bonus: A week of free access to Gold & Silver StockPickers.
Gold Alerts
More-
Status
New 2024 Lows in Miners, New Highs in The USD Index
January 17, 2024, 12:19 PM -
Status
Soaring USD is SO Unsurprising – And SO Full of Implications
January 16, 2024, 8:40 AM -
Status
Rare Opportunity in Rare Earth Minerals?
January 15, 2024, 2:06 PM

