

Briefly: in our opinion, full (300% of the regular position size) speculative short positions in junior mining stocks are justified from the risk/reward point of view at the moment of publishing this Alert.
The precious metals sector moved higher yesterday, so you might be wondering if anything changed, and if so, what would that be.
In short, practically nothing changed. The only thing that really changed is that the probability of seeing a bigger rebound from ~$27 in the GDXJ ETF decreased because of yesterday’s rally and last few days’ correction in general.
Why would that be?
Because markets correct when they get ahead of themselves in a given move. They rally or (like in this case) decline too far too fast. When they do, the force that has been pushing them in a given direction is temporarily gone, while the other side of the market gets the upper hand.
Then the test comes. Were these “new” price levels accidental? Or is this a new reality? Depending on that, people will either wait it out or act – buy or sell. The test can take place in all sorts of ways. The most obvious one is simply “time”. After a price moves below some key levels and remains there for an extended period of time, becomes obvious that the move was not an accident and that prices are actually staying there – perhaps for good and perhaps simply for much longer than just a few days.
Another way for markets to check if something is temporary or if it’s here to stay is through the verification of moves above or below certain levels. If these corrective moves bounce from the previous support and it proves to now be a resistance, it becomes clear that “things have changed.”
Why are markets measuring this at all? Because ultimately, whether something is expensive or cheap depends on what one compares it to. Context is king, right?
This can be discussed on many levels, but to simplify, one way to answer this question is to check if it’s above or below certain thresholds – support / resistance levels like Fibonacci retracements, previous highs/lows, moving averages. Indicators are also useful here.
However, the key thing is that if one stops viewing gold as “being at the bottom of a trading channel” and starts viewing it as “being after a breakdown below the previous lows,” the perspective changes. In the first case, gold seems like a good buy as it’s cheap relative to the trading channel, while in the second one, gold seems expensive as who knows how low it could fall if the previous lows just failed to hold.
Why am I writing all this? To explain why the recent price action actually made it less likely for PMs to rebound after an additional short-term decline (with GDXJ at about $27).
Since gold, silver, and mining stocks are correcting right now, it means that the verification – the shift in perception of the current price levels – is already taking place. Thus, if the markets “accept” the current levels as the new base, a move to “just” $1,680 in gold or $27 in the GDXJ might not be extreme enough to trigger a visible rebound.
This means that the markets could move much lower without a more visible pause in the meantime. This would imply at least a $100 decline in gold and a possible slide to the 2020 lows in mining stocks in the absence of a more visible correction in the meantime. Of course, I’ll keep my eyes open, and I’ll report to my subscribers accordingly.
For now, let’s take a look at the shape of the most recent upswing in the GDXJ.
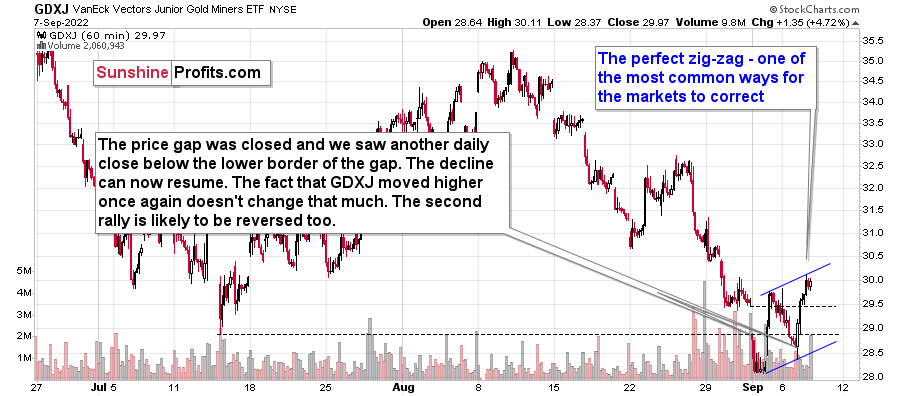
In short, it’s a perfect flag pattern. That’s the most classic way for the markets to correct after a bigger move. The sizes of the two immediate-term rallies are practically identical, making the pattern so perfect.
While the above chart might give the impression that the GDXJ invalidated the breakdown below its July lows, it’s not really the case. You see, it’s the daily closing price that really matters here.
Yesterday’s (Sep. 7) daily closing price was $29.97, and the lowest daily close in July was $30.02.
There was no invalidation – just verification of the breakdown, which has so far been successful.
We saw the same thing in the senior mining stocks – the GDX ETF. No invalidation, just verification.
This means that the medium-term outlook remains very, very bearish.
Oh, and by the way, seeing a correction here is not that odd because of the seasonality present in the USD Index.
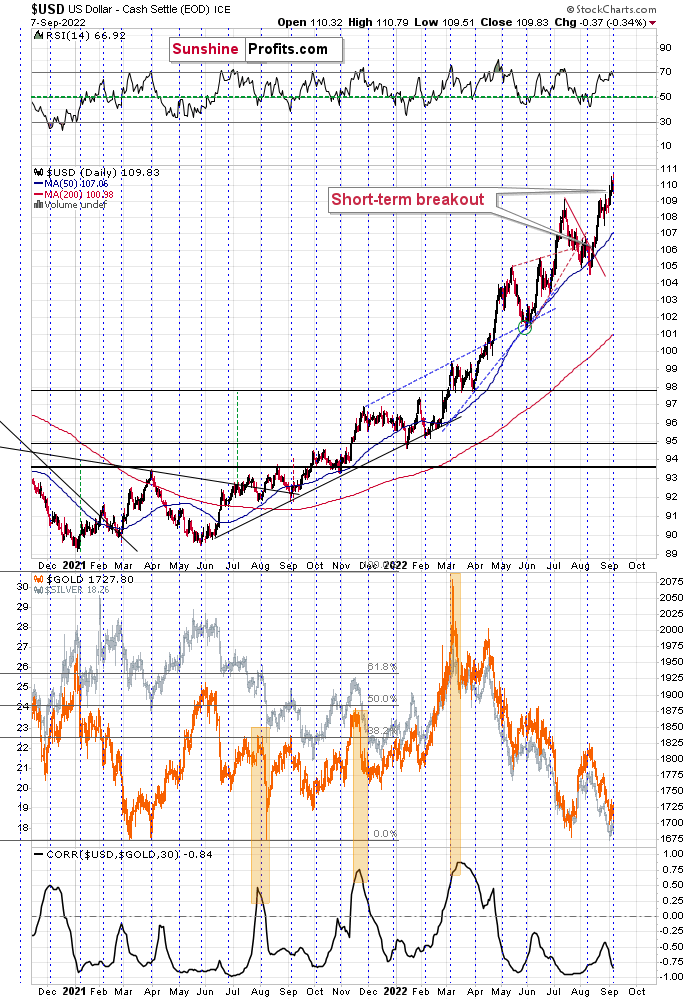
The USD Index tends to reverse (even if just for a short while) close to the turn of the month.
It recently moved to new highs, so it’s perfectly normal that we see a move back to the previously broken levels. Given the above, it’s perfectly normal that we see it now.
Since the precious metals’ prices are negatively correlated with the USD Index, the correction in the former is likely linked to the correction in the latter.
All in all, it seems that the current correction in mining stocks is quite normal, and it doesn’t invalidate the extremely bearish outlook for the medium term at all.
Having said that, let’s take a look at the markets from a more fundamental point of view.
The Big Picture
With risk assets rallying off of oversold conditions, another bout of short covering helped uplift the S&P 500 and the PMs. Moreover, while the GDXJ ETF enjoyed a sharp daily upswing, it’s important to remember that countertrend rallies are always present in bear markets. To explain, I wrote on Oct. 26, 2021:
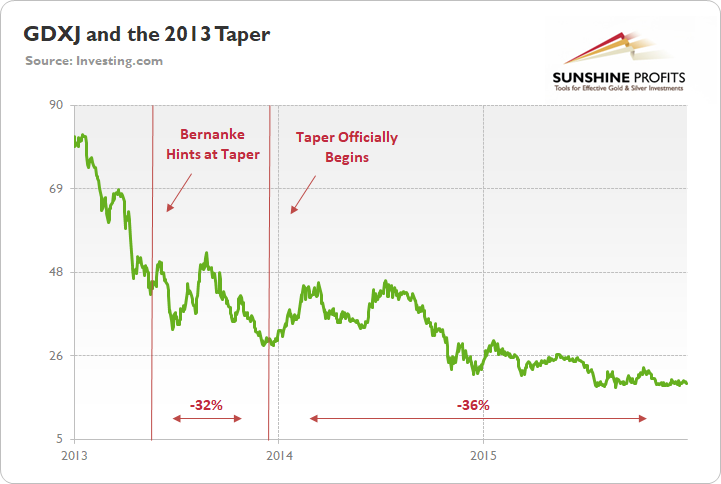
The green line above tracks the GDXJ ETF from the beginning of 2013 to the end of 2015. If you analyze the left side of the chart, you can see that when Fed Chairman Ben Bernanke hinted at tapering on May 22, 2013, the GDXJ ETF declined by 32% from May 22 until the taper began on Dec. 18.
Moreover, the onslaught didn’t end there. Once the taper officially began, the GDXJ ETF enjoyed a relief rally (similar to what we’re witnessing now), as long-term interest rates declined and the PMs assumed that the worst was in the rearview.
However, as the liquidity drain caught up to the junior miners over the medium term, the GDXJ ETF declined by another 36% from when the taper was announced on Dec. 18, 2013 until the end of 2015.
Thus, with the current liquidity drain vastly outpacing 2013, the taper is complete, and interest rate hikes and quantitative tightening (QT) are unfolding at a torrent pace. Therefore, while the GDXJ ETF can experience short-term bouts of optimism, a hawkish Fed often spoils the party and helps push the junior miners’ index to new lows. As such, it’s essential to drown out the noise and focus on the big picture.
To that point, I warned throughout 2021 that higher real interest rates were required to cool inflation; and since the USD Index and the U.S. 10-Year real yield often move in unison, the pair’s strength is profoundly bearish for gold, silver and mining stocks.
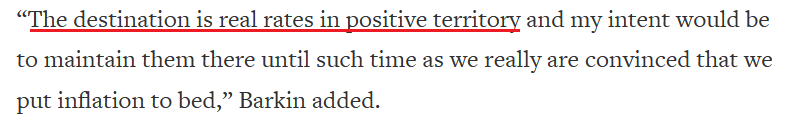
Furthermore, Richmond Fed President Thomas Barkin echoed that message on Sep. 7. He said:
“I have a bias in general towards moving more quickly, rather than more slowly, as long as you don’t inadvertently break something along the way(…). You do have to move to a level where inflation expectations come down in order to have enough restriction on the economy to bring inflation down.”
As a result, with the regional Fed chief still advocating for higher real interest rates, a realization would further cloud the PMs’ medium-term fundamental outlooks.
Please see below:
 Source: Reuters
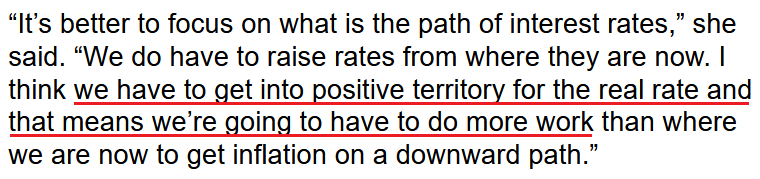
Likewise, Cleveland Fed President Loretta Mester reiterated her belief that the U.S. federal funds rate (FFR) will need to eclipse 4% in 2023. She said on Sep. 7:
“I'm not even convinced that inflation's peaked yet. That tends to be much more persistent and rents are still very elevated and it takes a while for rents to show up in underlying inflation…. In formulating my monetary policy views, I will be guarding against declaring victory over the inflation beast too soon.”
As such, I’ve highlighted repeatedly that the Shelter Consumer Price Index (CPI) accounts for more than 30% of the headline CPI’s movement. Moreover, with the former’s results comprised of new and renewed leases, the higher cost of new tenancies should keep the Shelter CPI elevated for the foreseeable future.
More importantly, Mester also advocated for higher real yields.
Please see below:
 Source: Bloomberg
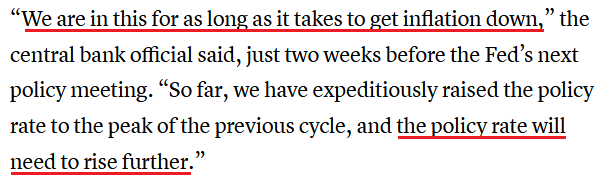
Singing a similar tune, Fed Vice Chair Lael Brainard said on Sep. 7:
“While the moderation in monthly inflation is welcome, it will be necessary to see several months of low monthly inflation readings to be confident that inflation is moving back down to 2% (…). Monetary policy will need to be restrictive for some time to provide confidence that inflation is moving down to target.”
As a result, she made it clear the Fed is far from declaring victory in its inflation fight.
Please see below:
 Source: CNBC
Therefore, while investors often create narratives that lack fundamental reasoning, the reality is that Fed officials remain hawked up. Moreover, with Bullard, George, Harker, and, to a lesser extent, Bostic, amplifying their hawkish rhetoric the day before Chairman Jerome Powell’s Jackson Hole speech, investors continue to repeat the same mistakes.
To explain, I noted during our post-FOMC recap on Dec. 16, 2021 that Powell uses his deputies as messengers. I wrote:
As one of the most important quotes of the press conference, he admitted:
“My colleagues were out talking about a faster taper, and that doesn’t happen by accident. They were out talking about a faster taper before the president made his decision. So it’s a decision that effectively was more than entrained.”
And while Powell sounded a little rattled during the exchange, his slip highlights the importance of Fed officials’ hawkish rhetoric. Essentially, when Clarida, Waller, Bostic, Bullard, etc., are making the hawkish rounds, “that doesn’t happen by accident.” As such, it’s an admission that his understudies serve as messengers for pre-determined policy decisions.
Thus, with the Fed’s inflation fight poised to be one of attrition, short-term rallies are unlikely to hold until the Fed turns dovish. Moreover, with the U.S. labor market still highly resilient, the employment picture allows the Fed to prioritize squashing inflation rather than being pulled in competing directions. As a result, the weight of tighter financial conditions should push gold, silver, and mining stocks to lower lows over the medium term.
The Canadian Connection
With the Bank of Canada (BoC) announcing another 75 basis point rate hike on Sep. 7, the move pushed Canada’s overnight lending rate to 3.25%. In addition, due to their geographical proximity and the fact that 75% or more of Canadian exports are sent to the U.S., the two regions often have similar economic and monetary policy outcomes. For context, I wrote on Apr. 14:
The BoC announced a 50 basis point rate hike on Apr. 13. With the Fed likely to follow suit in May, the domestic fundamental environment confronting the PMs couldn’t be more bearish. Moreover, BoC Governor Tiff Macklem (Canada's Jerome Powell) said that "We are committed to using our policy interest rate to return inflation to target and will do so forcefully if needed."
Furthermore, while he added that the BoC could "pause our tightening" if inflation subsides, he cautioned that "we may need to take rates modestly above neutral for a period to bring demand and supply back into balance and inflation back to target."
However, with the latter much more likely than the former, the BoC's decision is likely a preview of what the Fed should deliver in the months ahead.
Thus, with the prediction proving quite prescient, the Fed and the BoC have largely moved in lockstep; and after the BoC hiked interest rates by 75 basis points on Sep. 7, it set the stage for a similar move by the Fed on Sep. 21.
Please see below:
 Source: BoC
Also, the BoC acknowledged that energy prices primarily drove the recent CPI deceleration. An excerpt from the press release read:
“CPI inflation eased in July to 7.6% from 8.1% because of a drop in gasoline prices. However, inflation excluding gasoline increased and data indicate a further broadening of price pressures, particularly in services. The Bank’s core measures of inflation continued to move up, ranging from 5% to 5.5% in July. Surveys suggest that short-term inflation expectations remain high. The longer this continues, the greater the risk that elevated inflation becomes entrenched.”
In addition:
“The Canadian economy continues to operate in excess demand and labour markets remain tight. Canada’s GDP grew by 3.3% in the second quarter. While this was somewhat weaker than the Bank had projected, indicators of domestic demand were very strong – consumption grew by about 9½% and business investment was up by close to 12%.”
As such, while I warned repeatedly that demand was much more resilient than the consensus realized, spirited consumer spending keeps the core CPI elevated even as lower commodity prices reduce the headline CPI.
Furthermore, while the crowd, the Fed, and the BoC initially assumed that a ~3% overnight lending rate would curb inflation, that narrative is collapsing. Therefore, unless economically-sensitive commodities fall off a cliff, North American overnight lending rates should hit 4.5% or more in 2023, and the prospect is far from priced in.
 Source: BoC
The Bottom Line
With the PMs enjoying a daily relief rally, misguided sentiment helped uplift gold, silver, and mining stocks. However, with Fed officials and the BoC providing more doses of fundamental reality, the dip buyers have seen the GDXJ ETF record lower highs (mostly) and lower lows for roughly two years. Conversely, with the USD Index’s pullback likely driven by short-term profit taking, the greenback’s medium-term fundamental outlook remains robust. As a result, a reversal of fortunes should occur sooner rather than later.
In conclusion, the PMs rallied on Sep. 7, as risk assets relished the short-term reprieve. However, with the USD Index and U.S. real yields poised to move higher in the months ahead, the technicals and the fundamentals signal ominous outcomes for the PMs. In addition, peak S&P 500 seasonality occurs in mid-September, so a reversal in stocks could enhance the pace of the PMs’ likely declines. Thus, we expect more downside over the next several weeks.
Overview of the Upcoming Part of the Decline
- It seems to me that the corrective upswing is over, and that the next big move lower is already underway. We might see one final small corrective upswing soon, though.
- If we see a situation where miners slide in a meaningful and volatile way while silver doesn’t (it just declines moderately), I plan to – once again – switch from short positions in miners to short positions in silver. At this time, it’s too early to say at what price levels this could take place and if we get this kind of opportunity at all – perhaps with gold prices close to $1,600.
- I plan to exit all remaining short positions once gold shows substantial strength relative to the USD Index while the latter is still rallying. This may be the case with gold prices close to $1,400. I expect silver to fall the hardest in the final part of the move. This moment (when gold performs very strongly against the rallying USD and miners are strong relative to gold after its substantial decline) is likely to be the best entry point for long-term investments, in my view. This can also happen with gold close to $1,400, but at the moment it’s too early to say with certainty.
- The above is based on the information available today, and it might change in the following days/weeks.
You will find my general overview of the outlook for gold on the chart below:
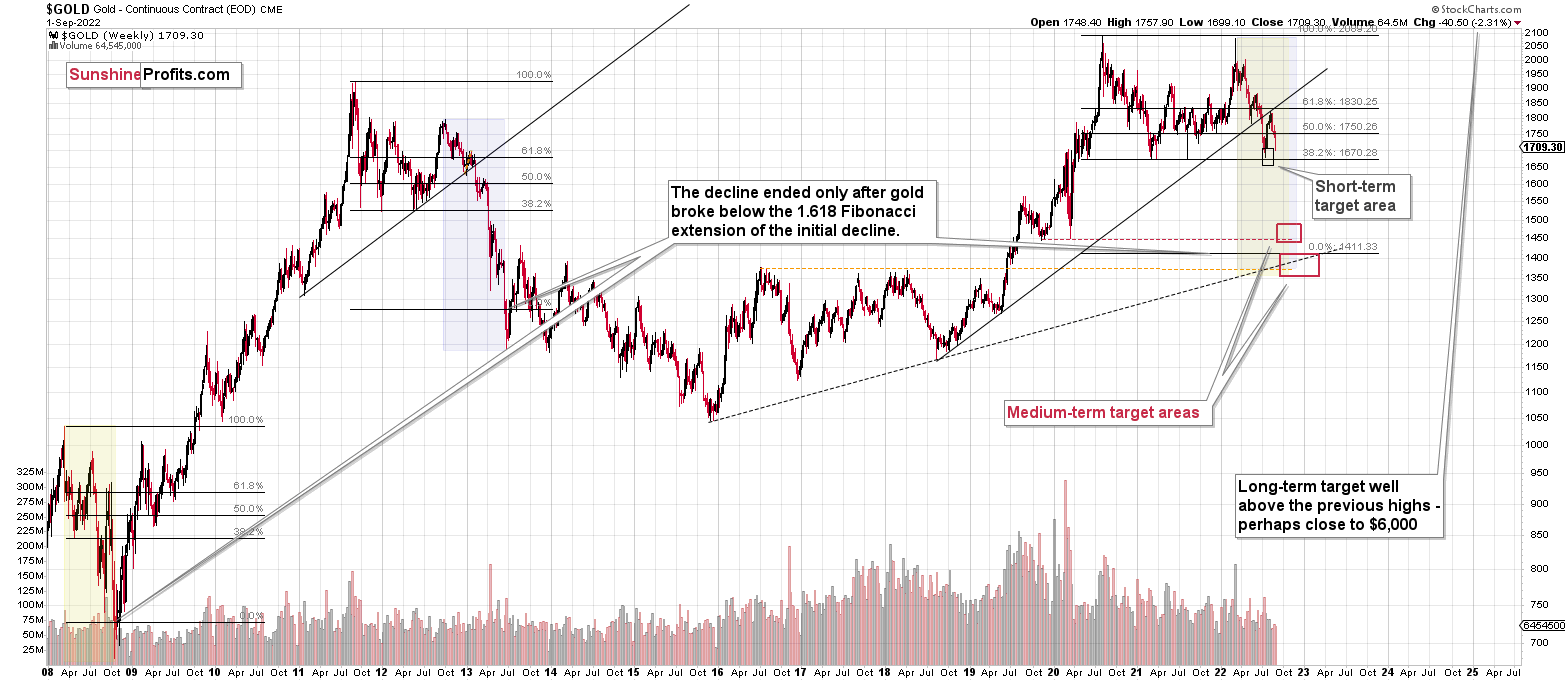
Please note that the above timing details are relatively broad and “for general overview only” – so that you know more or less what I think and how volatile I think the moves are likely to be – on an approximate basis. These time targets are not binding nor clear enough for me to think that they should be used for purchasing options, warrants, or similar instruments.
Summary
Summing up, it seems that the powerful medium-term downtrend in the precious metals sector is already underway. Still, I wouldn’t rule out a situation in which we get another, final, small corrective upswing in the near future (it’s not that likely, though).
You have been profiting from how this situation develops practically throughout the entire year, and the above indicates (I’m not making any guarantees, of course) that the biggest gains are likely just ahead.
After the final sell-off (that takes gold to about $1,350-$1,500), I expect the precious metals to rally significantly. The final part of the decline might take as little as 1-5 weeks, so it's important to stay alert to any changes.
As always, we'll keep you – our subscribers – informed.
To summarize:
Trading capital (supplementary part of the portfolio; our opinion): Full speculative short positions (300% of the full position) in junior mining stocks are justified from the risk to reward point of view with the following binding exit profit-take price levels:
Mining stocks (price levels for the GDXJ ETF): binding profit-take exit price: $20.32; stop-loss: none (the volatility is too big to justify a stop-loss order in case of this particular trade)
Alternatively, if one seeks leverage, we’re providing the binding profit-take levels for the JDST (2x leveraged). The binding profit-take level for the JDST: $29.87; stop-loss for the JDST: none (the volatility is too big to justify a SL order in case of this particular trade).
For-your-information targets (our opinion; we continue to think that mining stocks are the preferred way of taking advantage of the upcoming price move, but if for whatever reason one wants / has to use silver or gold for this trade, we are providing the details anyway.):
Silver futures downside profit-take exit price: $12.32
SLV profit-take exit price: $11.32
ZSL profit-take exit price: $79.87
Gold futures downside profit-take exit price: $1,504
HGD.TO – alternative (Canadian) 2x inverse leveraged gold stocks ETF – the upside profit-take exit price: $19.87
HZD.TO – alternative (Canadian) 2x inverse leveraged silver ETF – the upside profit-take exit price: $49.87
Long-term capital (core part of the portfolio; our opinion): No positions (in other words: cash)
Insurance capital (core part of the portfolio; our opinion): Full position
Whether you’ve already subscribed or not, we encourage you to find out how to make the most of our alerts and read our replies to the most common alert-and-gold-trading-related-questions.
Please note that we describe the situation for the day that the alert is posted in the trading section. In other words, if we are writing about a speculative position, it means that it is up-to-date on the day it was posted. We are also featuring the initial target prices to decide whether keeping a position on a given day is in tune with your approach (some moves are too small for medium-term traders, and some might appear too big for day-traders).
Additionally, you might want to read why our stop-loss orders are usually relatively far from the current price.
Please note that a full position doesn't mean using all of the capital for a given trade. You will find details on our thoughts on gold portfolio structuring in the Key Insights section on our website.
As a reminder - "initial target price" means exactly that - an "initial" one. It's not a price level at which we suggest closing positions. If this becomes the case (as it did in the previous trade), we will refer to these levels as levels of exit orders (exactly as we've done previously). Stop-loss levels, however, are naturally not "initial", but something that, in our opinion, might be entered as an order.
Since it is impossible to synchronize target prices and stop-loss levels for all the ETFs and ETNs with the main markets that we provide these levels for (gold, silver and mining stocks - the GDX ETF), the stop-loss levels and target prices for other ETNs and ETF (among other: UGL, GLL, AGQ, ZSL, NUGT, DUST, JNUG, JDST) are provided as supplementary, and not as "final". This means that if a stop-loss or a target level is reached for any of the "additional instruments" (GLL for instance), but not for the "main instrument" (gold in this case), we will view positions in both gold and GLL as still open and the stop-loss for GLL would have to be moved lower. On the other hand, if gold moves to a stop-loss level but GLL doesn't, then we will view both positions (in gold and GLL) as closed. In other words, since it's not possible to be 100% certain that each related instrument moves to a given level when the underlying instrument does, we can't provide levels that would be binding. The levels that we do provide are our best estimate of the levels that will correspond to the levels in the underlying assets, but it will be the underlying assets that one will need to focus on regarding the signs pointing to closing a given position or keeping it open. We might adjust the levels in the "additional instruments" without adjusting the levels in the "main instruments", which will simply mean that we have improved our estimation of these levels, not that we changed our outlook on the markets. We are already working on a tool that would update these levels daily for the most popular ETFs, ETNs and individual mining stocks.
Our preferred ways to invest in and to trade gold along with the reasoning can be found in the how to buy gold section. Furthermore, our preferred ETFs and ETNs can be found in our Gold & Silver ETF Ranking.
As a reminder, Gold & Silver Trading Alerts are posted before or on each trading day (we usually post them before the opening bell, but we don't promise doing that each day). If there's anything urgent, we will send you an additional small alert before posting the main one.
Thank you.
Przemyslaw Radomski, CFA
Founder, Editor-in-chief

