

Briefly: in our opinion, full (300% of the regular position size) speculative short positions in junior mining stocks are justified from the risk/reward point of view at the moment of publishing this Alert.
Looking at an individual tree (daily session) is exciting. Especially if the tree (profits on a trade) is growing day by day. However, it is looking at what the forest (the broad perspective, general trends) does that makes one’s portfolio grow over time.
While I provided a lot of context in Friday’s flagship analysis, in today’s analysis, I will focus on two key long-term developments that are extremely important but that don’t get enough emphasis.
The first one is in gold stocks, and the second is in the USD Index.
Starting with the latter, the key thing is that the USD Index is after a breakout above the previous highs, and while it just invalidated the short-term breakout, it continues to trade in a mirror-like pattern to what happened in 2002 and 2003.
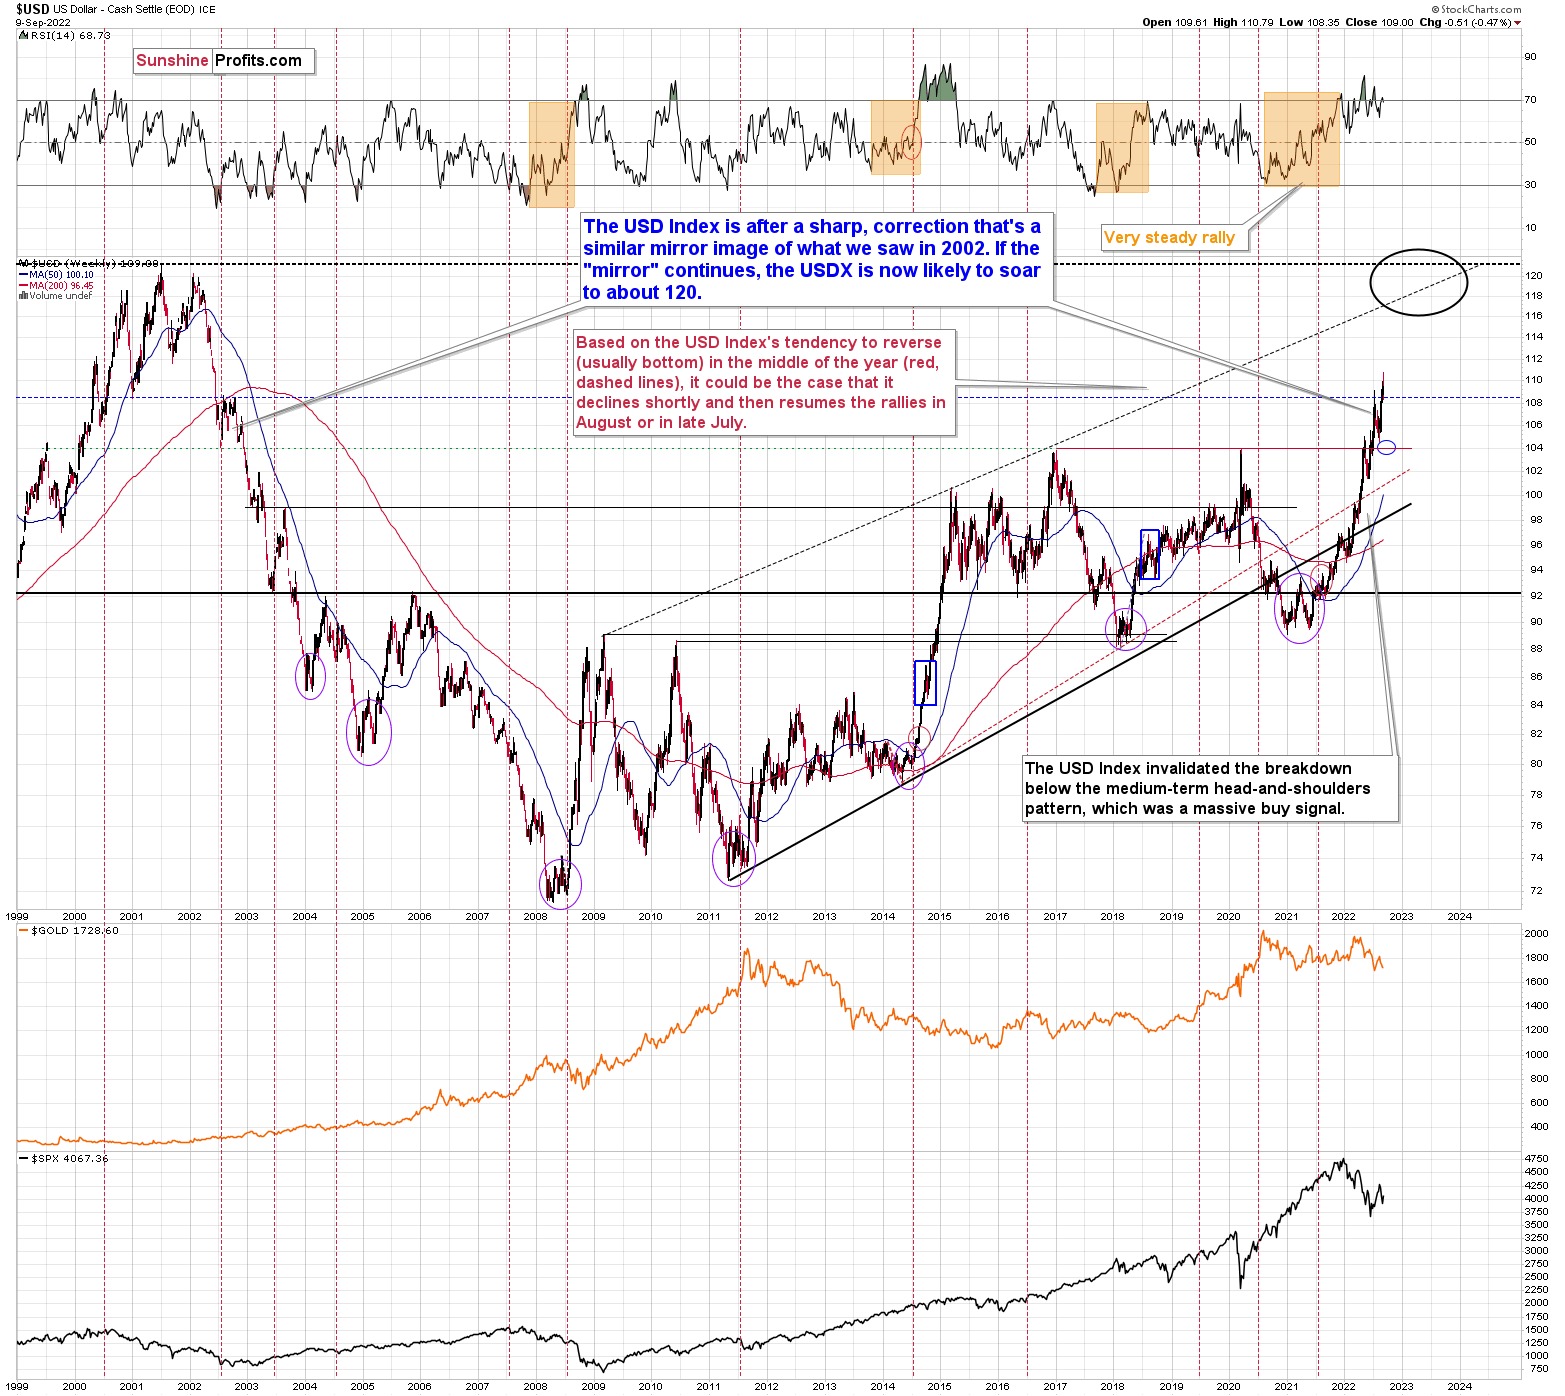
Back then, the corrective pause took quite a while before the movement continued. Due to sharply rising interest rates, it doesn’t have to be the case this time . However, even if the USD Index once again moves to the 104-105 area, the medium-term outlook will still remain very bullish.
Is it likely to happen?
Not necessarily.
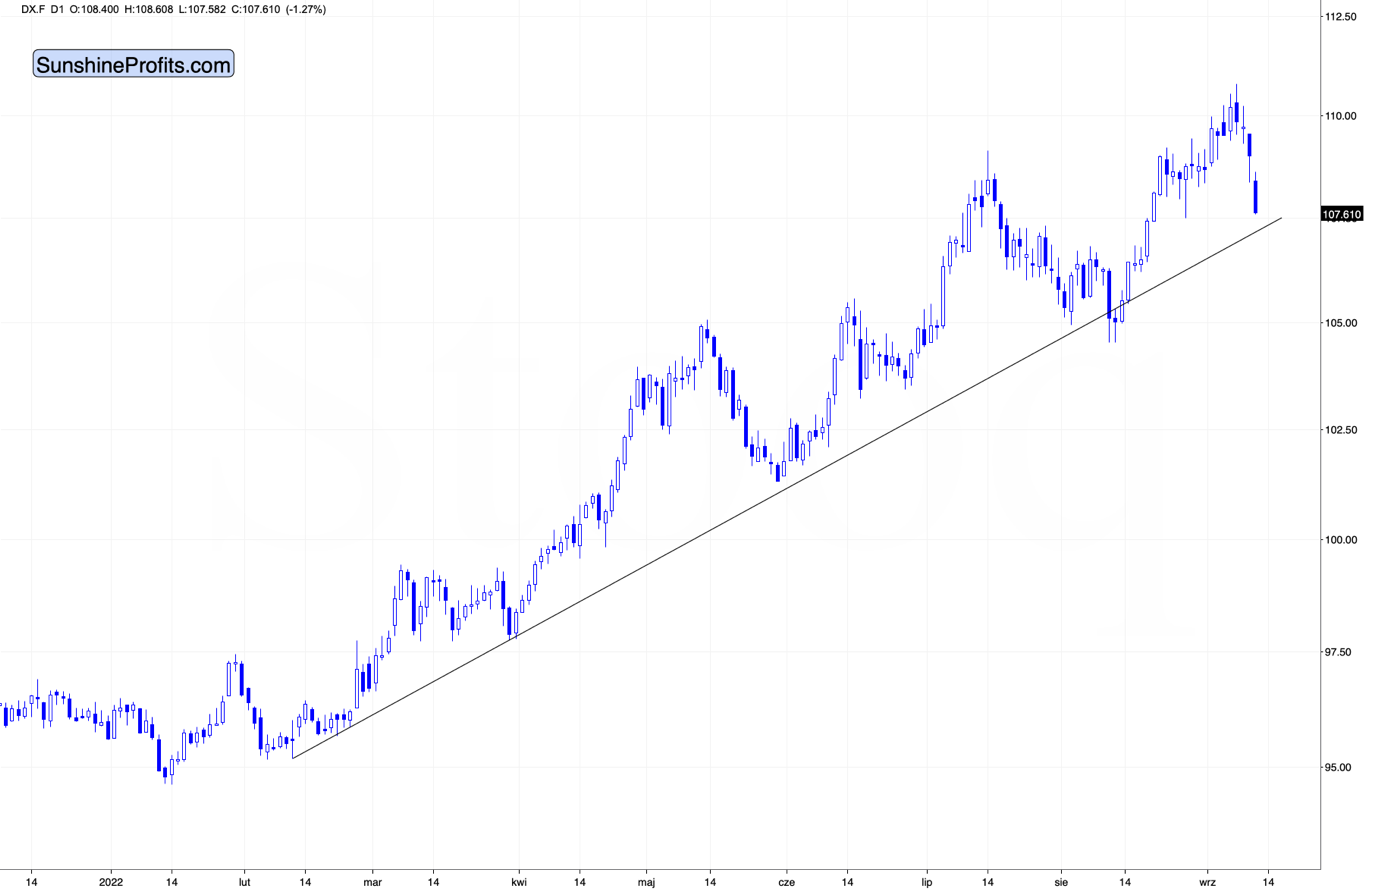
From the short-term point of view, the USD Index declined substantially today (likely the safe-haven demand decline based on the counter-offensive in Ukraine, which suggests that the war might be close to its end, and Russia could be on the losing side thereof), and it’s about to reach its rising support line.
This line kept the declines in check for months, so it’s quite likely that it will stop the declining prices also this time.
While the USD Index declined substantially in today’s pre-market trading (about 1.2%), did gold’s price rally substantially?
No. It’s up by just 0.38% so far today. (And silver’s price is up by over 1.6%, which means that it’s outperforming gold on an immediate-term basis – something that we often see right before bigger declines.)
So, we have a situation where gold doesn’t really want to rally based on the USD’s decline, and that’s bearish for gold, especially since the support for the USD Index appears to be just around the corner.
Also, regardless of the immediate-term effects on forex prices, please consider the following. If the situation in Ukraine stabilizes and things get back to the way they were before, at least in terms of borders (or Ukraine claims Crimea back), it means undoing a lot of what happened based on those changes in the past, right? And gold rallied in response to both events – the invasion of Crimea and the invasion of the rest of Ukraine. So, it could decline as things stabilize – mainly because the safe-haven demand wanes.
The second big thing that I want to feature today is the situation in the HUI Index. I like to analyze this index as it’s been trading for a long time, and therefore it’s able to provide a lot of context to the most recent price moves.
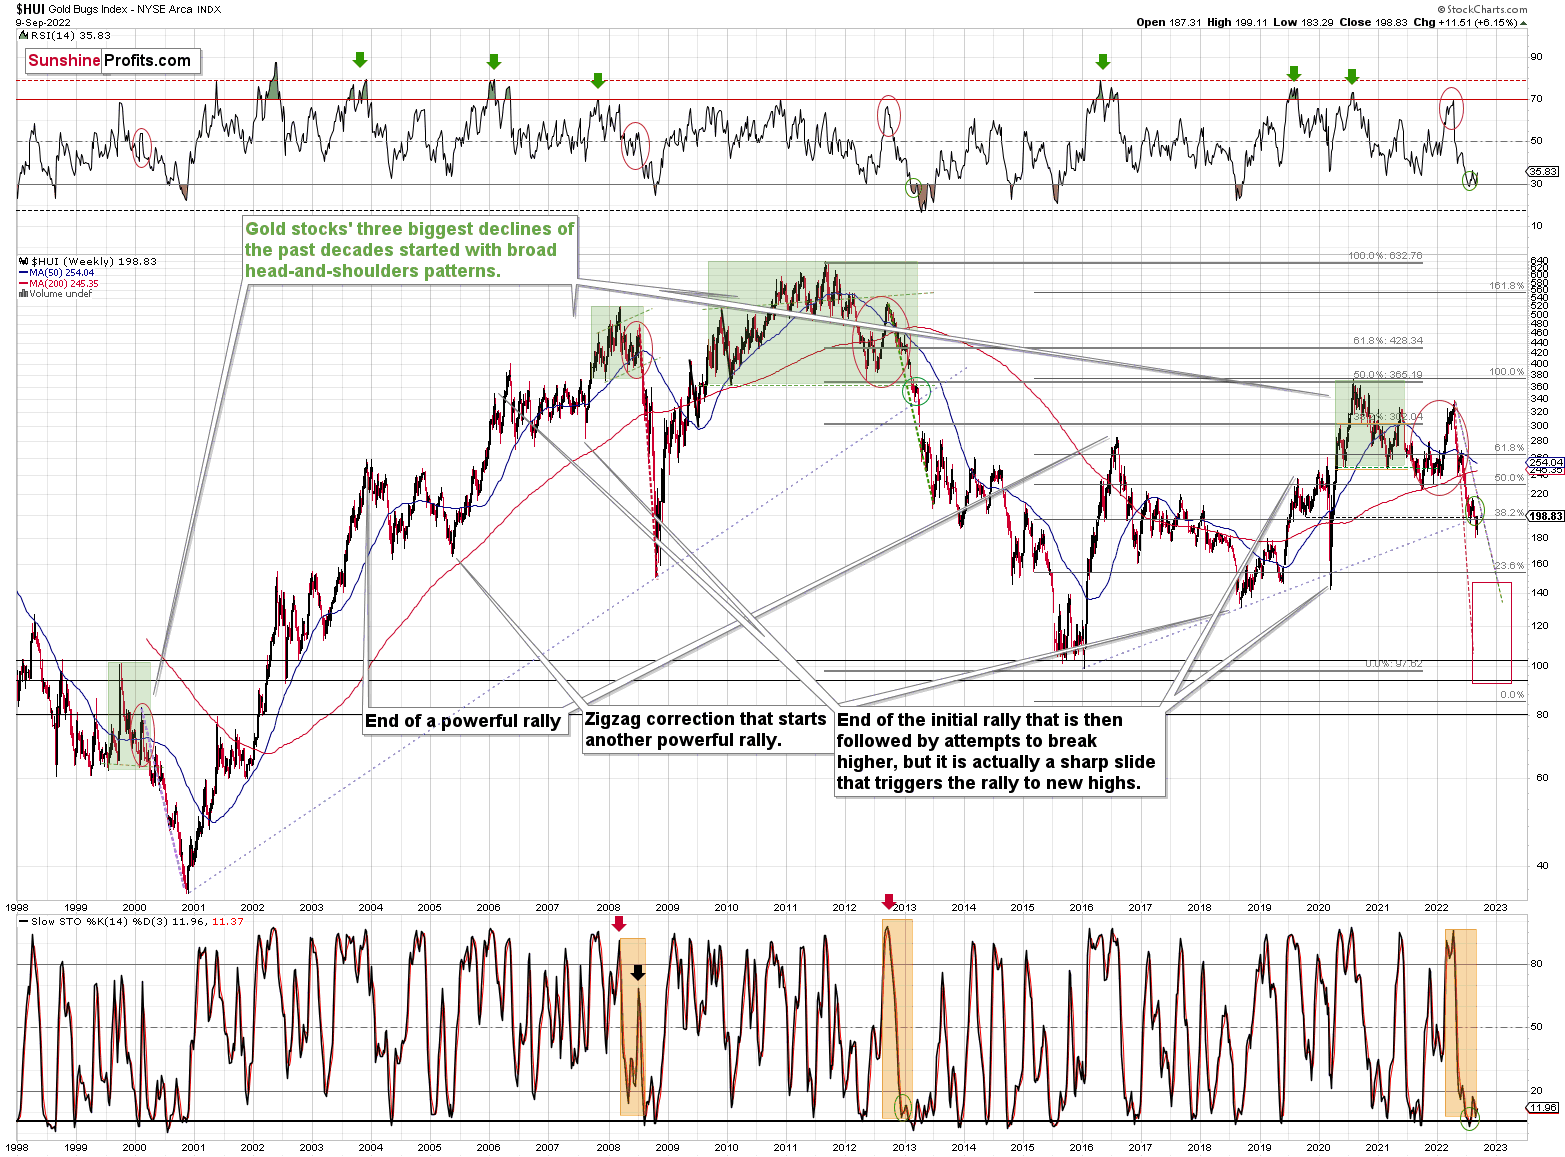
In this case, what I would like to emphasize is that the key breakdown is below the rising long-term support line that’s based on the 2016 and 2018 lows.
Back in 2020, the breakdown below this line was quickly invalidated. This time, it’s the opposite. The breakdown was confirmed.
The very recent move higher simply means that gold stocks are verifying the breakdown. Nothing more.
It is the huge decline that we saw this year that is what is really going on, and by focusing on just the last several trading days, one might completely miss the perspective. The big deal about gold stocks right now is that they are in a medium-term decline, not that they bounced recently.
As far as gold itself is concerned, it continues to correct from approximately its previous lows, which is exactly what we saw in 2013 right before the biggest part of the slide. I was there. I remember what the overall feeling among the investors back then was. The narrative was “the bottom is in, the rally will now surely resume, it’s a no-brainer”. Then gold plunged.
Nothing from what we saw recently (including today) invalidated this analogy. The outlook remains extremely bearish.
Having said that, let’s take a look at the markets from a more fundamental point of view.
Squeezing the S&P 500
With the S&P 500 seeking higher ground over the last three days, a small sliver of optimism helped unleash a short-covering rally. Moreover, with bears afraid of being caught wrong-footed should a larger rally unfold, their covering activity gives off the impression that the price action is bullish.
However, the gambit has unfolded several times in 2022, and financial assets’ medium-term downtrends are likely far from complete.
Please see below:
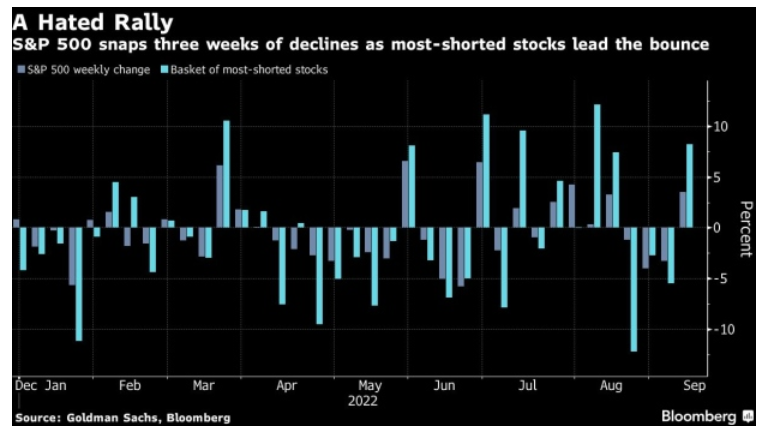
To explain, the gray bars above track the S&P 500’s weekly percentage change, while the light blue bars above track the weekly performance of Goldman Sachs Most Shorted Basket. If you analyze the right side of the chart, you can see that the index of most shorted stocks roughly doubled the return of the S&P 500. As a result, the majority of last week’s gains were driven by investors covering bearish bets, not opening bullish ones.
To that point, I’ve warned on numerous occasions that the GDXJ ETF is a liquidity beneficiary, and when high-beta assets bounce, the junior miners often participate.
Please see below:
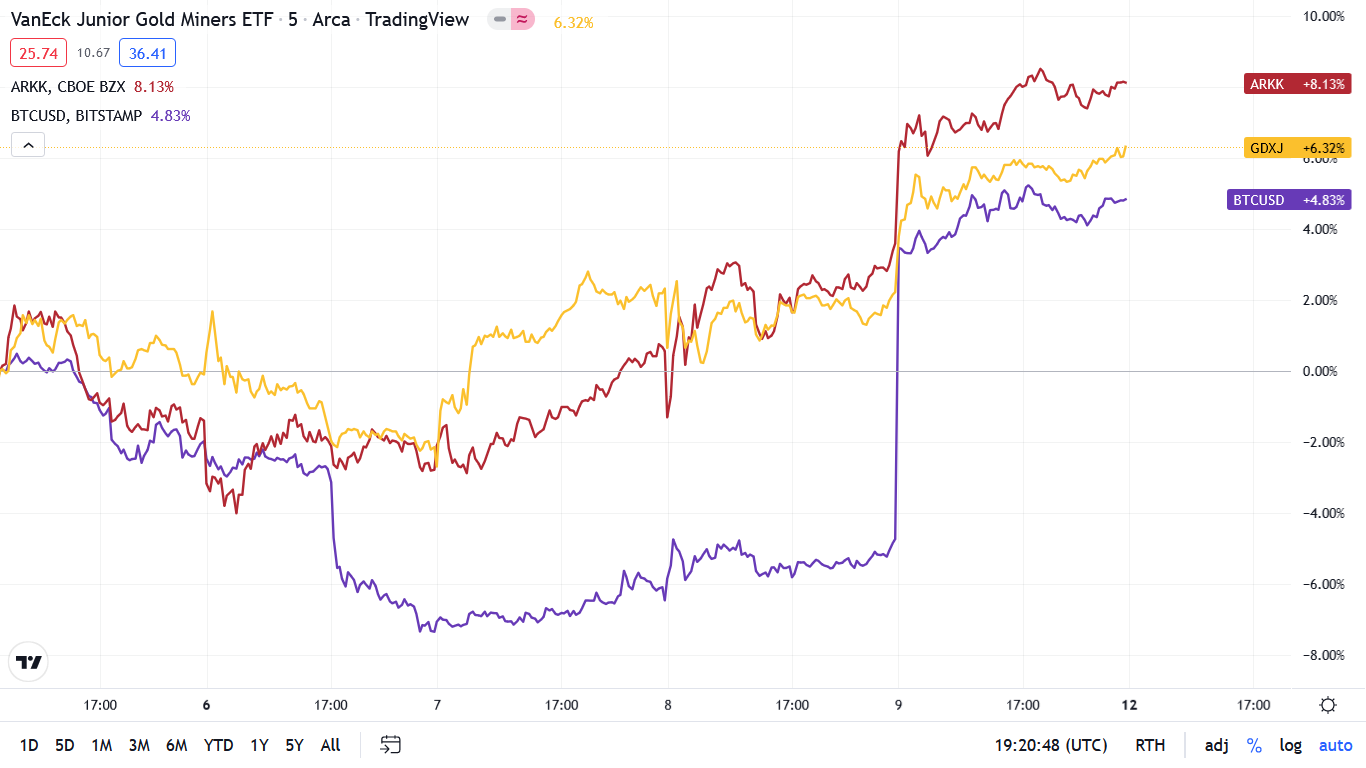
To explain, the gold line above tracks the five-minute movement of the GDXJ ETF, while the red and purple lines above track the five-minute movement of the ARK Innovation ETF and Bitcoin. As you can see, the trio followed similar paths, as the worst-performing assets often bounce the most during short-covering spurts.
More importantly, the data highlights how the GDXJ ETF’s strength had little to do with idiosyncratic factors confronting the precious metals market, and more to do with sentiment uplifting the 2022 laggards. As such, gold, silver and mining stocks’ medium-term outlooks remain profoundly bearish, and bouts of short covering have been present throughout the PMs’ journeys to lower lows.
The Good Times Won’t Last
While investors will likely buy into the Fed’s “soft landing” forecast until the very end, the central bank has not curbed inflation without triggering a recession since 1954. Likewise, with historical S&P 500 bottoms often occurring mid-way through recessions, more downside should confront the U.S. equity benchmark before the bear market is complete.
Please see below:
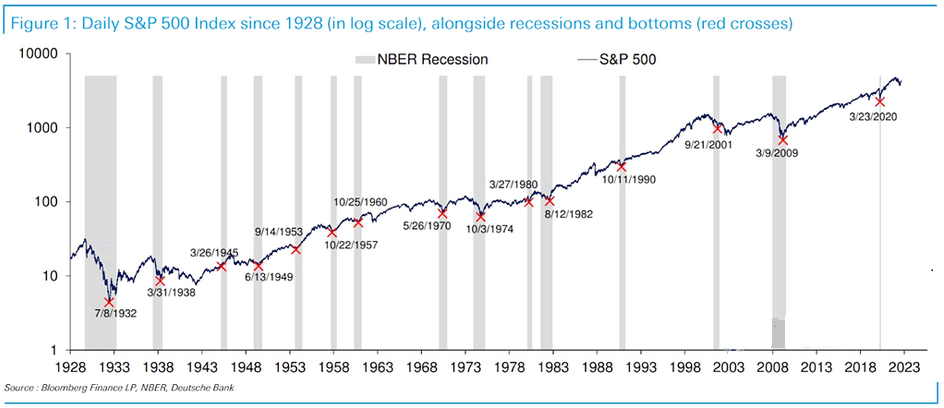
To explain, the blue line above tracks the S&P 500 (daily log scale), while the gray bars above represent historical recessions. If you analyze the red Xs, you can see that the S&P 500 often bottoms midway through a downturn. Therefore, unless Fed Chairman Jerome Powell accomplishes something that no other committee before him has, the S&P 500 should suffer a sharp re-pricing as the Fed’s inflation fight takes its toll on the U.S. economy.
Likewise, the Fed needs to reduce demand to cool the pricing pressures. As a result, the current fundamental backdrop of QT and positive real yields is the opposite of the pandemic party that included QE and negative real yields.
Please see below:
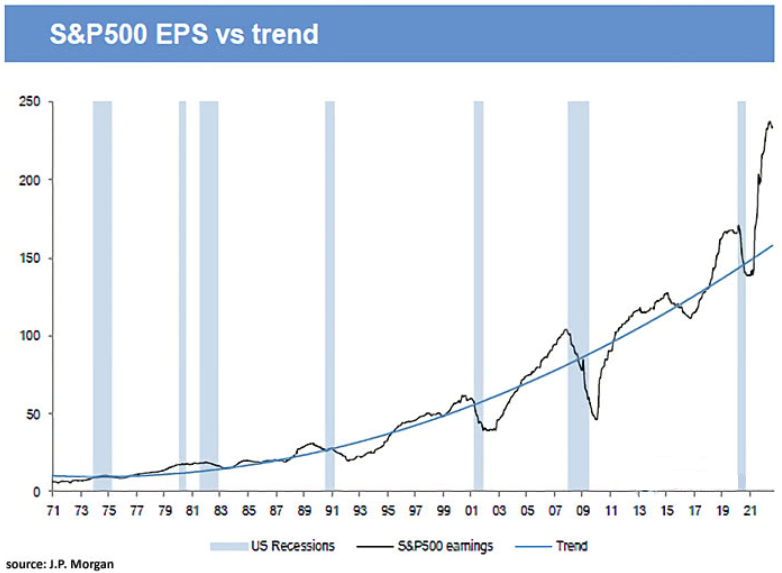
To explain, the black line above tracks the S&P 500's historical earnings per share (EPS), while the vertical blue bars represent recessions. In addition, the upward sloping blue line represents the index's trends EPS. If you analyze the ebbs and flows, you can see that the realized EPS (the black line) often fluctuates around the trend EPS (the blue line).
However, if you focus your attention on the right side of the chart, you can see that the black line has completely run away from the blue line. As a result, stimulus checks, enhanced unemployment benefits and record wage growth helped push S&P 500 companies' EPS in a vertical direction. Remember, though, they also helped create the highest inflation in 40+ years.
Thus, for the Fed to normalize inflation back to its 2% target, realized EPS will also have to normalize back toward its historical trend. As such, if S&P 500 companies continue to hike their output prices, it will force the Fed to raise interest rates even more to slow down demand. Therefore, the equity bulls don't realize that current EPS levels are unsustainable.
To that point, Morgan Stanley's Leading Earnings Model points to a material deceleration in EPS growth over the next 12 months.
Please see below:
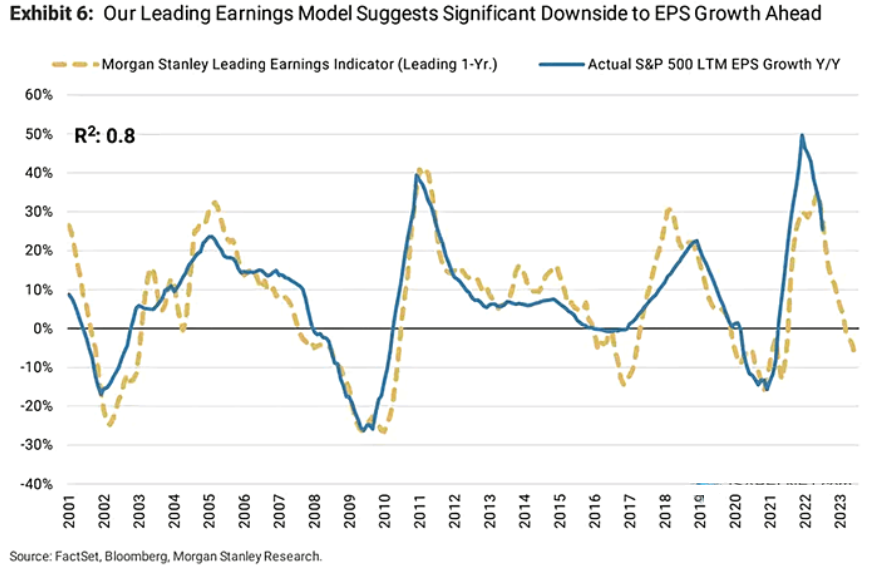
To explain, the blue line above tracks the year-over-year (YoY) percentage change in realized 12-month S&P 500 EPS growth, while the gold dashed line above tracks the expected EPS growth 12 months ahead. If you analyze the relationship, you can see that the two have a relatively close fit.
More importantly, the sharp decline in the gold dashed line on the right side of the chart signals a substantial slowdown ahead. Thus, the S&P 500’s optimism is unlikely to last, and further weakness should have drastic consequences for gold, silver and mining stocks.
More Hawk Talk
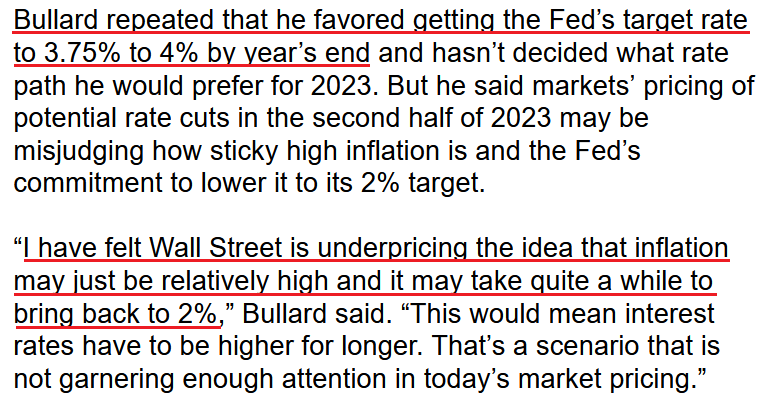
With Fed officials emphasizing their commitment to controlling inflation, their united message is bullish for the USD Index and the U.S. 10-Year real yield, and is bearish for the PMs. For example, St. Louis Fed President James Bullard said on Sep. 9:
“The general strategy of trying to front-load these rate increases is working well and putting us in a position where we can have a level of the policy rate that is putting downward pressure on inflation very soon. And sooner tends to be better in my mind.”
He added:
“There is just a lot of trouble hiring. This isn’t very comforting on the big picture. You still have to pay up if you want to get labor. That sounds like a lot of wage pressure.”
As a result, he emphasized that a slight deceleration in the Consumer Price Index (CPI) is nowhere near the threshold required to loosen monetary policy:
“We are going to need to see more sustained, longer-run evidence. Not all the future reports will go in the right direction. Some will go up and some will go down. We understand we are going to have to have a preponderance of the data in favor of the view that inflation is clearly coming back on multiple measures to 2%.”
Please see below:
 Source: Bloomberg
Thus, while Bullard noted how a scenario of higher-for-longer interest rates "is not garnering enough attention in today's market pricing," that's precisely what should unfold over the medium term. With the consensus underestimating the resiliency of inflation, investors' belief that it will recede to 2% without any economic damage contrasts historical precedent. In fact, it's never happened. As a result, there is plenty of room for expectations to shift further.
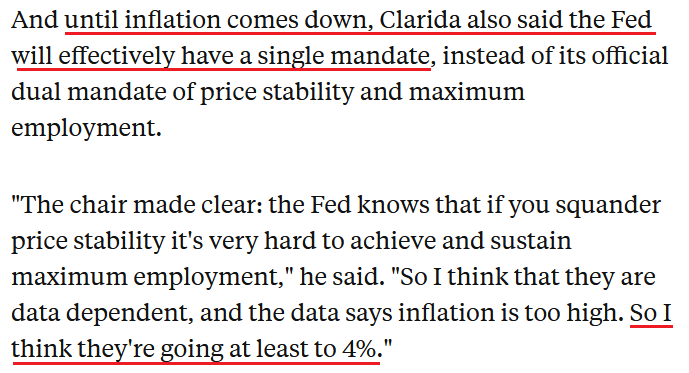
Finally, former Fed Vice Chairman Richard Clarida said on Sep. 9 that the central bank will raise interest rates come "hell or high water" and that "failure is not an option." Therefore, it's ironic how honest assessments flow once Fed members depart their posts. For context, Clarida left the Fed on Jan. 14.
Please see below:
 Source: Markets Insider
The Bottom Line
With short squeezes a dime a dozen in 2022, the recent rally was much more semblance than substance. Moreover, while the price action can cloud investors’ judgment, the reality is that none of the fundamental issues plaguing the S&P 500 and the PMs have been resolved.
In fact, more current and former Fed officials are using 4% as the new goalpost for the U.S. federal funds rate (FFR), when the peak was expected near 3% to 3.5% not that long ago. As such, inflationary realities have enlightened Fed officials, and it’s likely only a matter of time until they realize that 4% still isn’t hawkish enough.
In conclusion, the PMs rallied on Sep. 9, as risk assets squeezed higher. However, with the Fed still far from its 2% inflation target, the liquidity drain should continue in the months ahead. Therefore, since QE was bullish for the S&P 500 and the PMs, QT should be the exact opposite.
Overview of the Upcoming Part of the Decline
- It seems to me that the corrective upswing is over, and that the next big move lower is already underway. We’re probably seeing the final small corrective upswing right now.
- If we see a situation where miners slide in a meaningful and volatile way while silver doesn’t (it just declines moderately), I plan to – once again – switch from short positions in miners to short positions in silver. At this time, it’s too early to say at what price levels this could take place and if we get this kind of opportunity at all – perhaps with gold prices close to $1,600.
- I plan to exit all remaining short positions once gold shows substantial strength relative to the USD Index while the latter is still rallying. This may be the case with gold prices close to $1,400. I expect silver to fall the hardest in the final part of the move. This moment (when gold performs very strongly against the rallying USD and miners are strong relative to gold after its substantial decline) is likely to be the best entry point for long-term investments, in my view. This can also happen with gold close to $1,400, but at the moment it’s too early to say with certainty.
- The above is based on the information available today, and it might change in the following days/weeks.
You will find my general overview of the outlook for gold on the chart below:
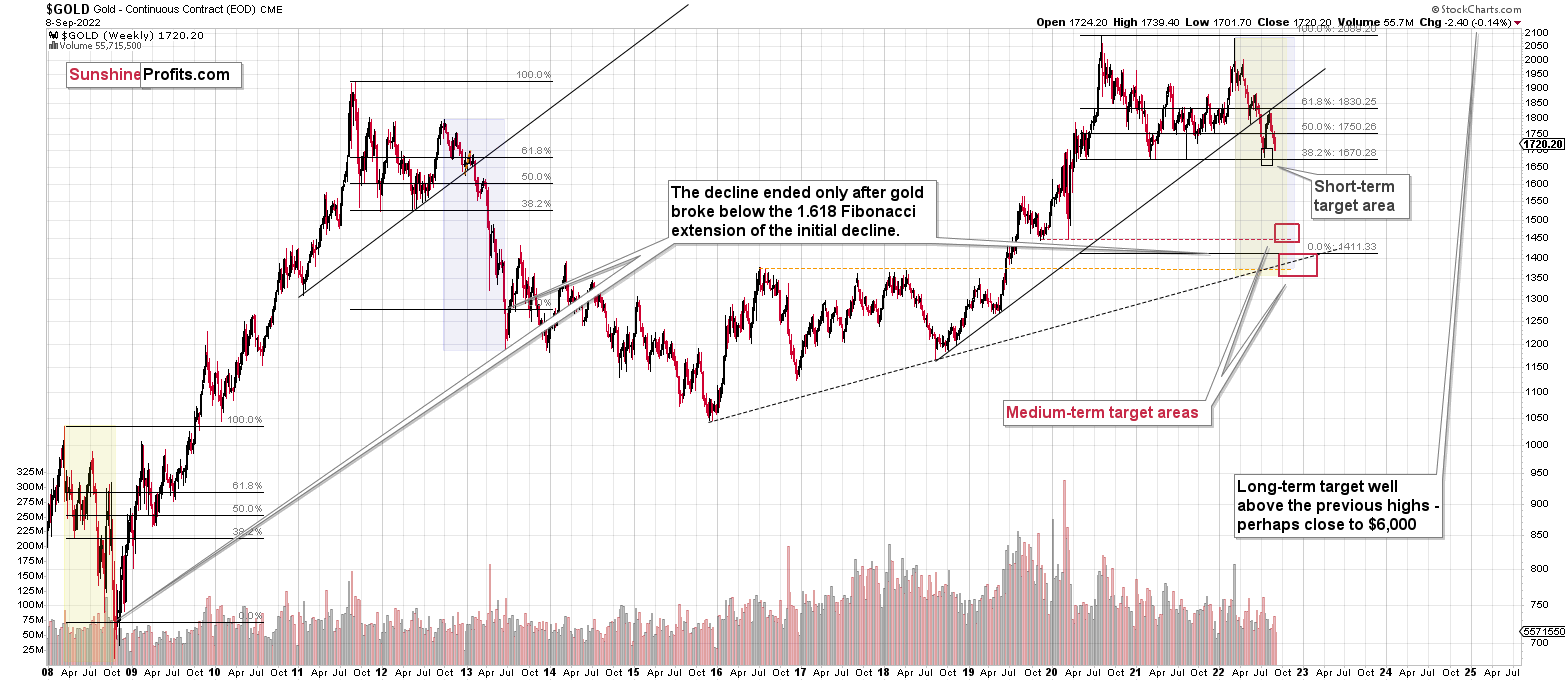
Please note that the above timing details are relatively broad and “for general overview only” – so that you know more or less what I think and how volatile I think the moves are likely to be – on an approximate basis. These time targets are not binding nor clear enough for me to think that they should be used for purchasing options, warrants, or similar instruments.
Summary
Summing up, it seems that the corrective upswing is over or is about to be over, which means that the powerful medium-term downtrend can resume any day now – the current corrective upswing simply appears to be of a very short-term nature. And based on the analogy to 2013, it seems that the next wave down might be really spectacular.
You have been profiting from how this situation develops practically throughout the entire year, and the above indicates (I’m not making any guarantees, of course) that the biggest gains are likely just ahead.
After the final sell-off (that takes gold to about $1,350-$1,500), I expect the precious metals to rally significantly. The final part of the decline might take as little as 1-5 weeks, so it's important to stay alert to any changes.
As always, we'll keep you – our subscribers – informed.
To summarize:
Trading capital (supplementary part of the portfolio; our opinion): Full speculative short positions (300% of the full position) in junior mining stocks are justified from the risk to reward point of view with the following binding exit profit-take price levels:
Mining stocks (price levels for the GDXJ ETF): binding profit-take exit price: $20.32; stop-loss: none (the volatility is too big to justify a stop-loss order in case of this particular trade)
Alternatively, if one seeks leverage, we’re providing the binding profit-take levels for the JDST (2x leveraged). The binding profit-take level for the JDST: $29.87; stop-loss for the JDST: none (the volatility is too big to justify a SL order in case of this particular trade).
For-your-information targets (our opinion; we continue to think that mining stocks are the preferred way of taking advantage of the upcoming price move, but if for whatever reason one wants / has to use silver or gold for this trade, we are providing the details anyway.):
Silver futures downside profit-take exit price: $12.32
SLV profit-take exit price: $11.32
ZSL profit-take exit price: $79.87
Gold futures downside profit-take exit price: $1,504
HGD.TO – alternative (Canadian) 2x inverse leveraged gold stocks ETF – the upside profit-take exit price: $19.87
HZD.TO – alternative (Canadian) 2x inverse leveraged silver ETF – the upside profit-take exit price: $49.87
Long-term capital (core part of the portfolio; our opinion): No positions (in other words: cash)
Insurance capital (core part of the portfolio; our opinion): Full position
Whether you’ve already subscribed or not, we encourage you to find out how to make the most of our alerts and read our replies to the most common alert-and-gold-trading-related-questions.
Please note that we describe the situation for the day that the alert is posted in the trading section. In other words, if we are writing about a speculative position, it means that it is up-to-date on the day it was posted. We are also featuring the initial target prices to decide whether keeping a position on a given day is in tune with your approach (some moves are too small for medium-term traders, and some might appear too big for day-traders).
Additionally, you might want to read why our stop-loss orders are usually relatively far from the current price.
Please note that a full position doesn't mean using all of the capital for a given trade. You will find details on our thoughts on gold portfolio structuring in the Key Insights section on our website.
As a reminder - "initial target price" means exactly that - an "initial" one. It's not a price level at which we suggest closing positions. If this becomes the case (as it did in the previous trade), we will refer to these levels as levels of exit orders (exactly as we've done previously). Stop-loss levels, however, are naturally not "initial", but something that, in our opinion, might be entered as an order.
Since it is impossible to synchronize target prices and stop-loss levels for all the ETFs and ETNs with the main markets that we provide these levels for (gold, silver and mining stocks - the GDX ETF), the stop-loss levels and target prices for other ETNs and ETF (among other: UGL, GLL, AGQ, ZSL, NUGT, DUST, JNUG, JDST) are provided as supplementary, and not as "final". This means that if a stop-loss or a target level is reached for any of the "additional instruments" (GLL for instance), but not for the "main instrument" (gold in this case), we will view positions in both gold and GLL as still open and the stop-loss for GLL would have to be moved lower. On the other hand, if gold moves to a stop-loss level but GLL doesn't, then we will view both positions (in gold and GLL) as closed. In other words, since it's not possible to be 100% certain that each related instrument moves to a given level when the underlying instrument does, we can't provide levels that would be binding. The levels that we do provide are our best estimate of the levels that will correspond to the levels in the underlying assets, but it will be the underlying assets that one will need to focus on regarding the signs pointing to closing a given position or keeping it open. We might adjust the levels in the "additional instruments" without adjusting the levels in the "main instruments", which will simply mean that we have improved our estimation of these levels, not that we changed our outlook on the markets. We are already working on a tool that would update these levels daily for the most popular ETFs, ETNs and individual mining stocks.
Our preferred ways to invest in and to trade gold along with the reasoning can be found in the how to buy gold section. Furthermore, our preferred ETFs and ETNs can be found in our Gold & Silver ETF Ranking.
As a reminder, Gold & Silver Trading Alerts are posted before or on each trading day (we usually post them before the opening bell, but we don't promise doing that each day). If there's anything urgent, we will send you an additional small alert before posting the main one.
Thank you.
Przemyslaw Radomski, CFA
Founder, Editor-in-chief

