
tools spotlight

-
Is Gold Going to Drop Like Every Year After US Labor Day?
September 6, 2022, 8:02 AMFor at least 10 years, we have seen a trend in gold prices at the beginning of September - they have been falling. Will this happen again now?
In my Friday’s analysis, I wrote about the very bearish medium-term trend the precious metals sector is currently in, and in today’s issue, I’ll supplement it with the timeliest details that relate directly to the specific factors that we have right now. These are:
- We’re right after U.S. Labor Day, and the gold price behaves very specifically at this time of the year.
- It’s the September before the U.S. mid-term elections, and there’s also a very specific tendency present in the S&P 500 that’s related to this time.
Let’s start with the first point.
Actually, I already wrote about gold’s behavior after U.S. Labor Day last year, and what happened next confirmed this tendency even more. Quoting my Sep. 1, 2021 analysis:
The U.S. Labor Day is almost here, and thus the time for gold’s rally is running out. Tick-tock, tick-tock… and then the party stops.
Chart analysis is a very interesting activity. You need to keep your mind open, your cognitive and emotional biases at bay, and you have to stay humble, as you always have something new to discover and you might need to change your mind in a flash. Moreover, the indications can arrive from all over the place. You can expect that the key signal will come from this price analysis technique, or that one, or maybe based on the price link between some assets. Or it could even be the case that it will not be the price or volume that will be critical in a given situation… but time.
The cyclical nature of many areas of life is present in the markets, and it is usually the case that the seasonal factors have only a mild effect on the prices while other factors are much more important, as they are specific to a given situation. Sometimes, however, we have a recurring event that’s so precise in its implications and so accurate that its importance could dwarf other techniques.
This could be the case with gold’s post-U.S. Labor-Day performance.
A poet might say that at that time, a golden dolphin jumps joyfully into the air, shining briefly in the evening sun, preparing for a deep and dangerous dive.
A data scientist might say that 10 out of 10 efficiency with regard to short-term implications and 8 out of 10 performance with regard to medium-term implications is something that seems opposite to the efficient market theory, even in its weak form.
A trader might say: “Great! Let’s make some money on it!”
I’ll let you be the judge as to which approach is best, while I will feature my observations regarding gold’s price performance around U.S. Labor Day.
(…)
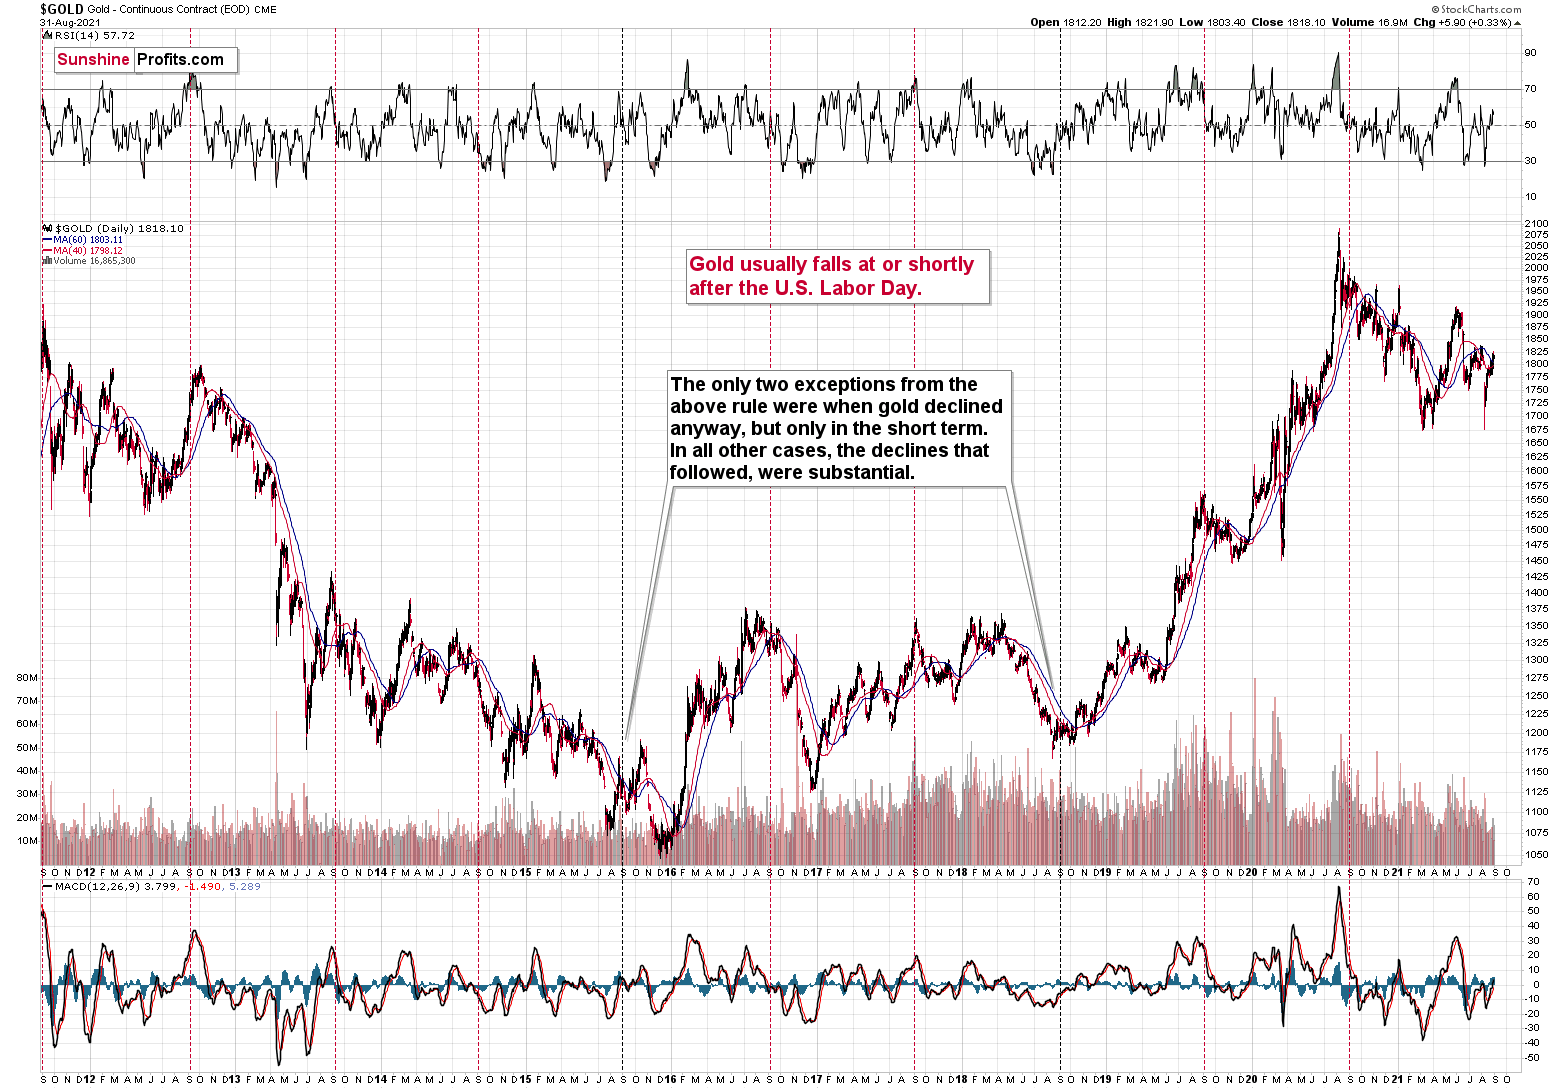
We’re now less than one week away from Labor Day in the U.S., which is particularly important for the gold price movement.
You see, in the previous 10 years, gold almost always declined profoundly right after U.S. Labor Day — I marked that on the above chart with red, dashed lines. There were only two cases (in 2015 and in 2018) when gold didn’t slide profoundly after that day, but… it was when gold declined in the short term anyway. There was simply no major downswing later.
In other words, in all 10 of the previous 10 years, gold moved lower in the short term after U.S. Labor Day. Of course, it’s debatable what one describes as the short term. In this case, I mean a period between a few days and a few weeks. Then again, if you look at the chart, it’s clear what we can expect. Please have a look at how far gold usually falls (red lines) and how far it fell during the exceptionally bullish years when it declined just in the short run.
This is very important, as it tells us that even if gold doesn’t decline this week, it will be very likely to do so based on this surprisingly accurate cyclicality.
What happened next?
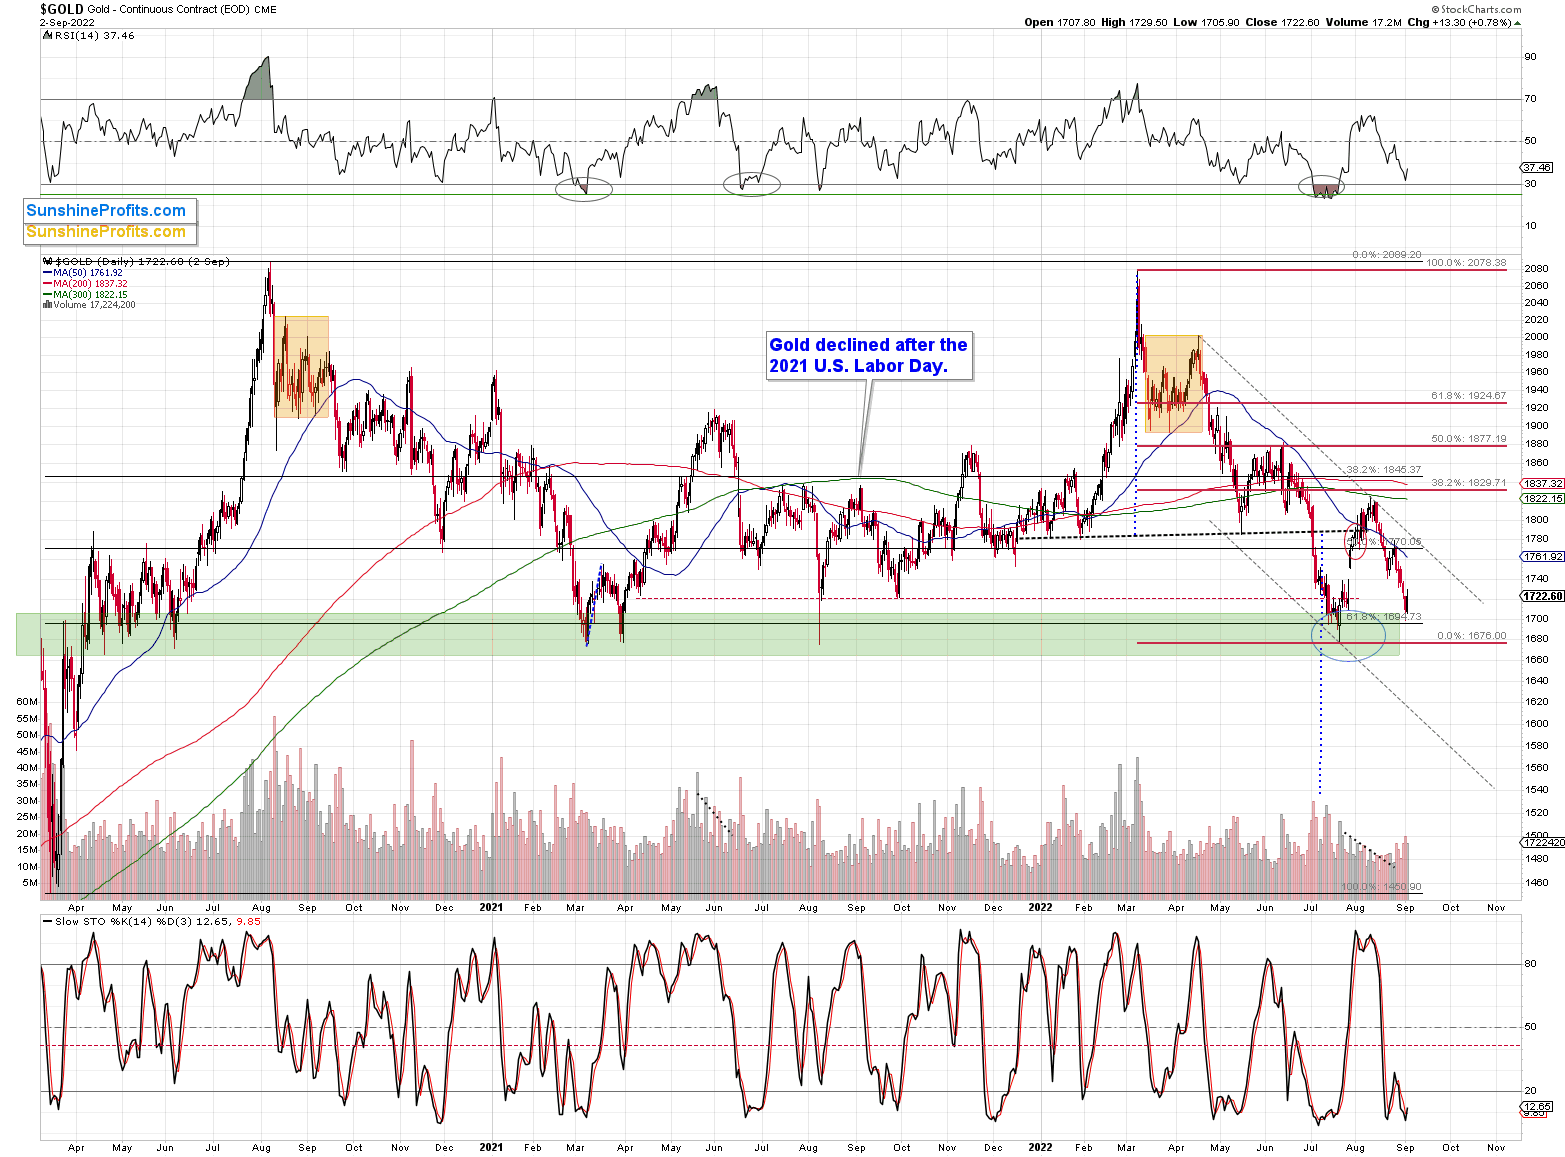
Gold declined, just as I had expected it to – no surprise here.
So, what is the gold price likely to do next based on such an effective historical tendency? That’s right, even though – of course – it’s not guaranteed, gold’s price is likely to decline.
Thank you for reading our free analysis today. Please note that the above is just a small fraction of the full analyses that our subscribers enjoy on a regular basis. They include multiple premium details such as the interim targets for gold and mining stocks that could be reached in the next few weeks. We invite you to subscribe now and read today’s issue right away.
Sincerely,
Przemyslaw Radomski, CFA
Founder, Editor-in-chief -
Is the Corrective Upswing in Gold and Silver Over?
September 2, 2022, 8:49 AMAvailable to premium subscribers only.
Thank you for reading our free analysis today. Please note that the above is just a small fraction of the full analyses that our subscribers enjoy on a regular basis. They include multiple premium details such as the interim targets for gold and mining stocks that could be reached in the next few weeks. We invite you to subscribe now and read today’s issue right away.
Sincerely,
Przemyslaw Radomski, CFA
Founder, Editor-in-chief -
Gold Miners Avoided Volatility, but More Downside Lies Ahead
September 1, 2022, 8:50 AMDon't be fooled by the green color on the junior miners' chart. A momentary gleam is unlikely to make much difference in the medium term.
While the GDXJ ETF closed near the flat line on Aug. 31, the S&P 500 suffered another daily sell-off and closed at the lows. Moreover, with the bulls celebrating a victory before the battle was even won, I warned on Aug. 12 that the bear market was far from over. I wrote:
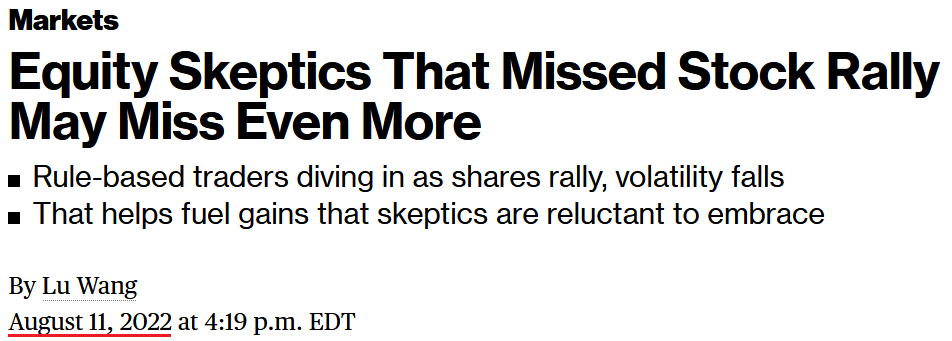
With FOMO seeping into the mindsets of hedge funds and long-only managers, you better get on board before you “miss even more.”
Please see below:
 Source: Bloomberg
(…) While the consensus and the media want you to believe that the bear market is over, their lack of fundamental objectivity highlights why narratives are so destructive. Remember, if normalizing inflation and reducing its balance sheet were so easy, the Fed would have done it already.
Think about it: the Fed was so cautious about tapering its asset purchases that officials waited until inflation was so unanchored that it couldn’t be ignored. But now, the Fed will hike interest rates to 3.4%, sell $95 billion in bonds per month and increase the U.S. unemployment rate to 3.7% (the Fed’s 2022 SEP projections) while the S&P 500 hits new highs? All the while, reducing the YoY headline CPI to 2%, even though it’s never been done since 1954 without the FFR coming within ~50 basis points of the cycle peak. Good luck.
Thus, with reality reasserting itself and the financial markets now heeding Fed members' hawkish warnings, U.S. Treasury yields rose on Aug. 30 and have risen sharply in recent days.
Please see below:
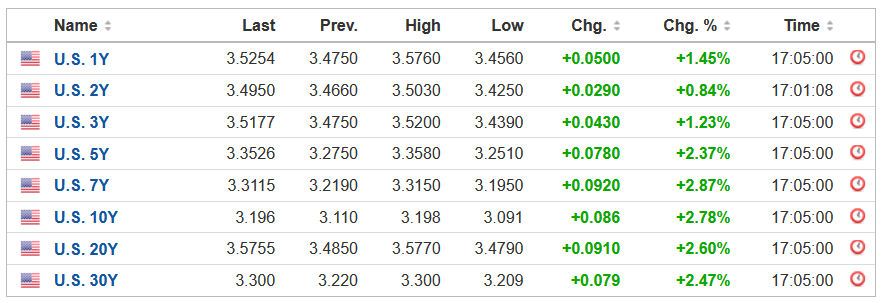 Source: Investing.com
To that point, the U.S. 5-Year Treasury yield hit its highest level since 2008, and its monthly rate of change (ROC) in August was the largest since 2009.
Please see below:
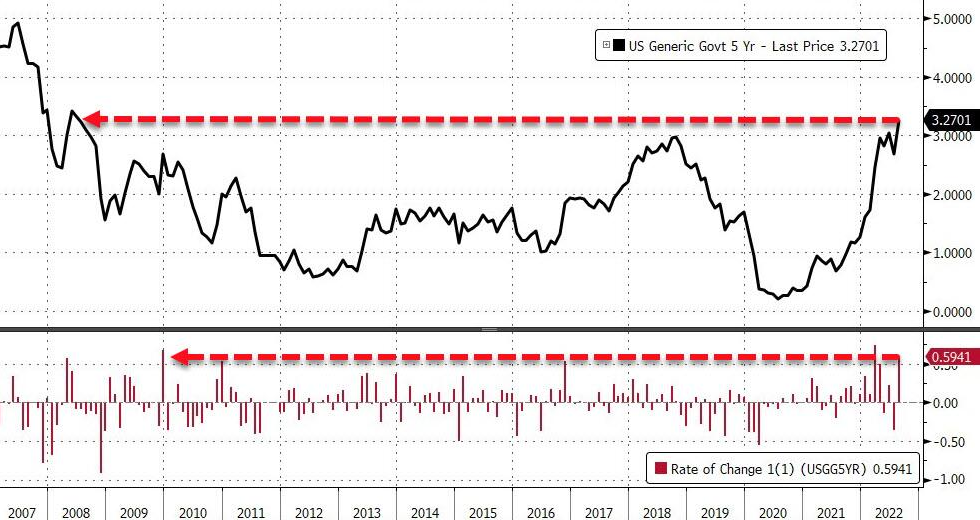 Source: Bloomberg/ZeroHedge
To explain, the black line at the top tracks the U.S. 5-Year Treasury yield, while the red line at the bottom tracks the monthly ROC. As you can see, both rallied materially in August, which was profoundly bearish for gold, silver, mining stocks, and the S&P 500.
In addition, with rate hike expectations rising sharply as well, hawkish realities have rattled the bulls.
Please see below:
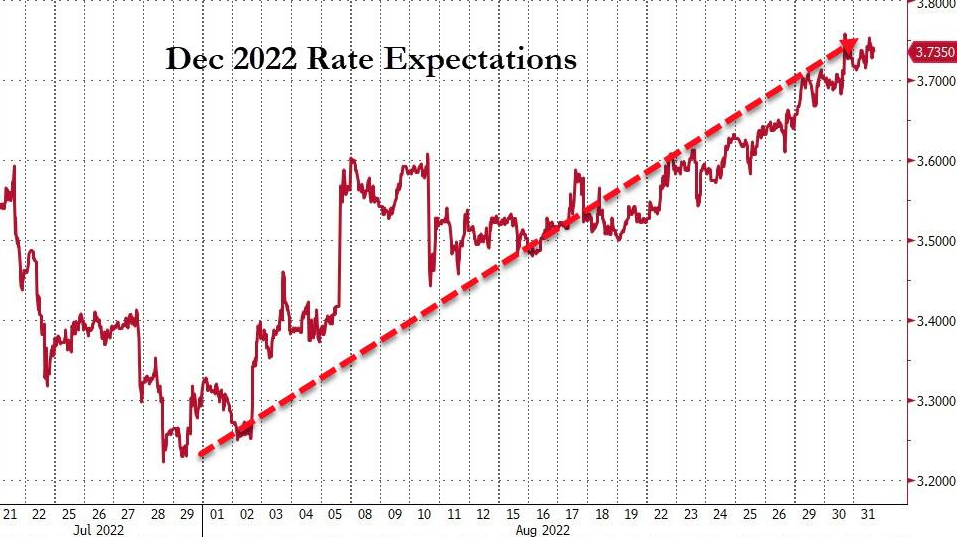 Source: Bloomberg/ZeroHedge
To explain, the red line above tracks the number of rate hikes priced in for December 2022. If you analyze the clear uptrend, you can see that futures traders went from expecting a ~3.35% U.S. federal funds rate (FFR) to expecting a ~3.74% FFR by the end of the year. As such, the easing of financial conditions reversed in August, and the bulls are now on their back foot.
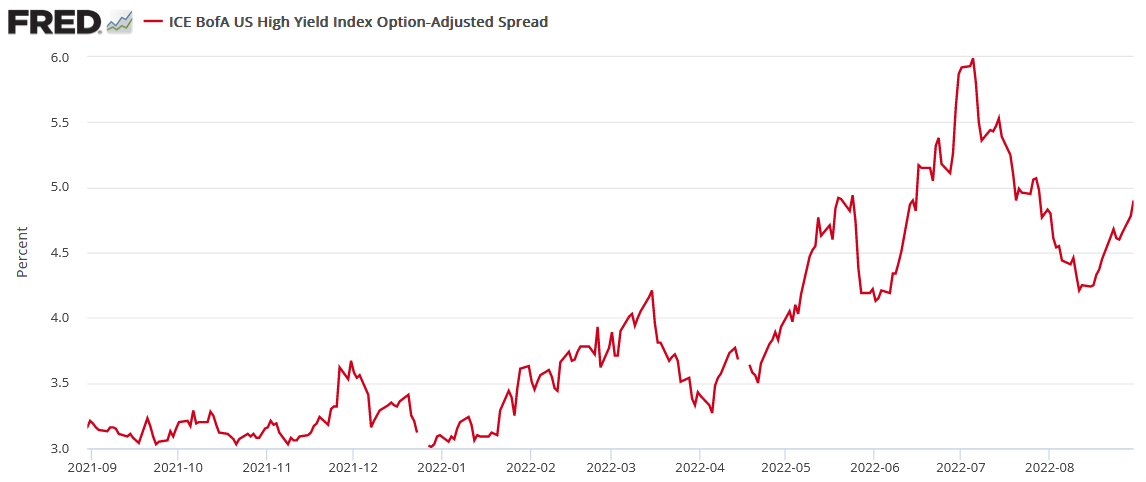
As further evidence, the ICE-Bank of America U.S. High Yield Option-Adjusted Spread (OAS) rose to 4.90% on Aug. 30 and has rallied nearly 70 basis points off the recent lows.
Please see below:
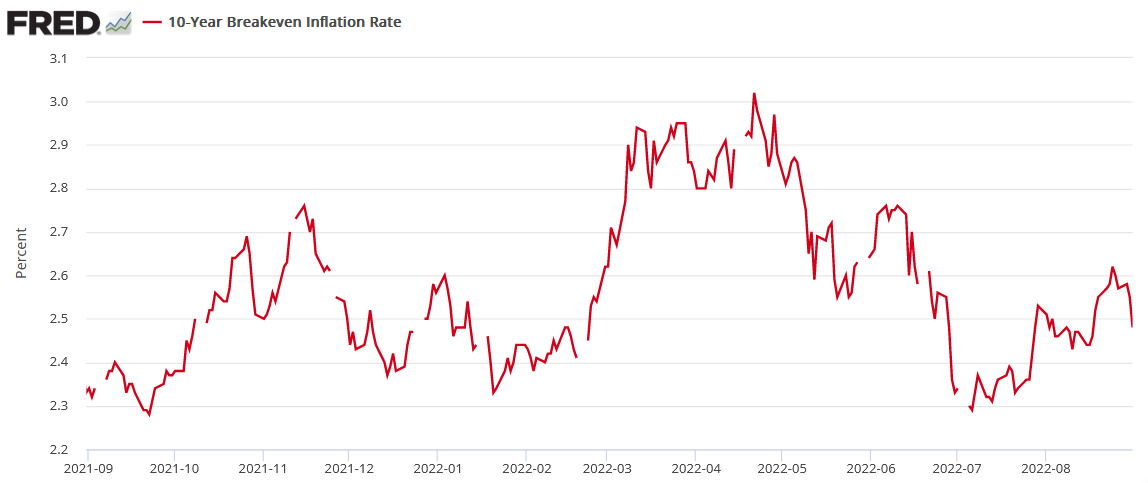
On top of that, the U.S. 10-Year breakeven inflation rate declined to 2.48% on Aug. 31; and with the U.S. 10-Year Treasury yield closing at 3.15%, a little math tells us the U.S. 10-Year real yield increased to 0.67%.
Please see below:
Moreover, I warned on Jan. 12 that higher real interest rates would upend the PMs. I wrote:
[Like] hyper-growth NASDAQ stocks and speculative assets like cryptocurrencies, PMs suffer from a similar fundamental affliction. For context, the PMs are less volatile than speculative assets. However, it's important to remember that gold, silver, and mining stocks peaked amid the liquidity-fueled surge in the summer of 2020. Likewise, their uprisings coincided with real interest rates that were at all-time lows at the time.
Conversely, with the Fed's liquidity drain already unfolding and real interest rates poised to rise in the coming months, the PMs should suffer from the likely re-pricings.
Thus, while the USD Index has been a reliable performer in 2022, the metrics above didn’t pull their weight in July. However, with material reversals occurring in August, the PMs have encountered heavy fundamental resistance.
Moreover, with the technicals painting a similar portrait, the PMs’ medium-term outlooks are profoundly bearish. As a result, while the GDXJ ETF managed to sidestep the volatility on Aug. 31, more downside should confront the junior miners in the months ahead.
Four Is a Crowd
While narratives about rampant inflation lured unsuspecting investors into precious metals long positions, I warned that the “the Fed is trapped” crowd was fighting a losing battle. I wrote:
The narrative implies that the Fed can’t tighten monetary policy without crashing the U.S. economy. Thus, Fed officials are “trapped,” and the PMs should soar as inflation runs wild. However, this hyper-inflationist theory is much more semblance than substance.
To explain, adopters assumed that the Fed couldn’t taper its asset purchases without crashing the U.S. economy. However, the Fed tapered, then accelerated the taper, and the U.S. economy remained resilient. Now, the new narrative is that the Fed can’t raise interest rates without crashing the U.S. economy. However, it’s simply misleading.
Furthermore, with nine rate hikes realized in 2022, the hyper-inflationists suffered the same fate as the “transitory” promoters. Moreover, with Cleveland Fed President Loretta Mester the fourth official to echo my warning about the 1970s and 1980s, their message couldn’t be clearer.
Please see below:
 Source: CNBC
She added:
“My current view is that it will be necessary to move the fed funds rate up to somewhat above 4% by early next year and hold it there. I do not anticipate the Fed cutting the fed funds rate target next year (…). Even if the economy were to go into a recession, we have to get inflation down.”
Therefore, while her mention of an FFR “somewhat above 4% by early next year” aligns with our way of thinking, the financial markets are still pricing in rate cuts. As a result, the expectations gap leaves room for more hawkish re-pricings in the months ahead.
Peak Nothing
While the headline Consumer Price Index (CPI) should decelerate somewhat when the data is released on Sept. 13, the consensus materially underestimates how difficult it will be to normalize the metric to 2%. Moreover, with Eurozone inflation exceeding expectations on Aug. 31, the data highlights why the pricing pressures pose a major challenge to global central banks.
Please see below:
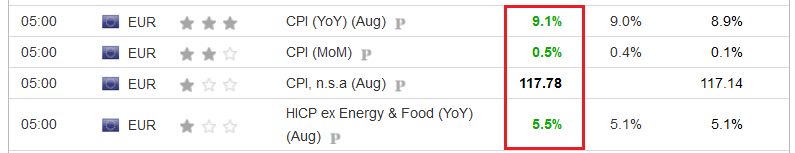 Source: Investing.com
In addition, it’s important to remember that the U.S. is not immune to what unfolds in Europe. For example, roughly 30% of S&P 500 companies’ earnings are generated overseas, so weakness in foreign markets could heavily impact U.S. stocks, and, therefore, the PMs.
Furthermore, Sam’s Club – a warehouse retailer owned by Walmart – raised its annual membership fees for the first time in nearly a decade on Aug. 31. The higher prices take effect on Oct. 17 and will jump from $45 to $50 for club members and from $100 to $110 for “Plus” members. As a result, the 10% to 11% price increases are another example of U.S. companies protecting their profit margins.
Please see below:
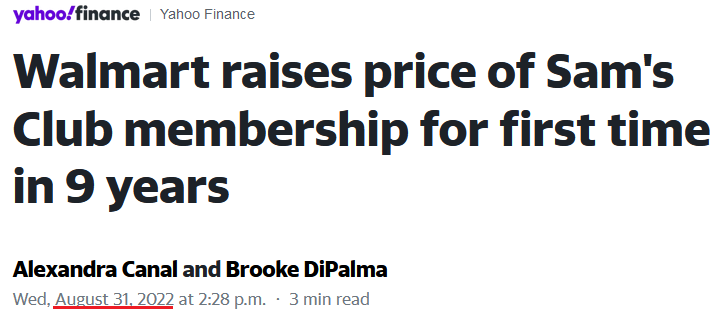 Source: Yahoo Finance
 Finally, the ISM released its Chicago Business Barometer on Aug. 31. The headline index increased from 52.1 in July to 52.2 in August.
Please see below:
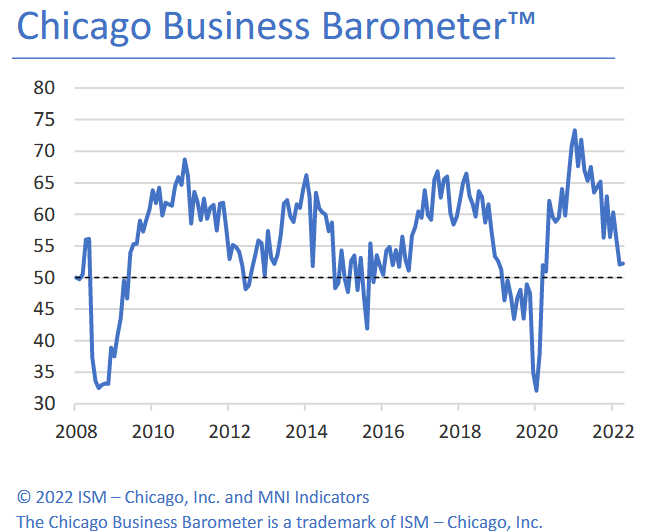
Moreover, the report revealed that “prices paid held firm in August, all but unchanged at 81.8, with price pressures remaining acute.” In addition, “employment edged down 1.5 points to 54.6, implying little change in the tightness of the labor market.”
Thus, with both indexes remaining relatively uplifted, the U.S. labor market and inflation are slowing at a snail’s pace. Therefore, the Fed will have to continue its hawkish crusade in order to normalize wage and output inflation.
The Bottom Line
With the technical and fundamental outlooks unfolding exactly as expected, our GDXJ ETF short position has paid handsomely in 2022. However, asset prices don’t move in a straight line, and counter-trend rallies will likely occur during the GDXJ ETF’s medium-term drawdown. Yet, with the junior miners making lower closing and/or intraday lows throughout their 2021 and 2022 journeys, similar outcomes should materialize in the months ahead. As such, a final sell-off should confront the PMs before long-term buying opportunities emerge.
In conclusion, the PMs were mixed on Aug. 31, as the GDXJ ETF ended the day in the green. However, with the Fed hawked up, real yields rising, and the USD Index poised to make higher highs, the fundamental and technical environments do not support higher precious metals prices.
Thank you for reading our free analysis today. Please note that the above is just a small fraction of the full analyses that our subscribers enjoy on a regular basis. They include multiple premium details such as the interim targets for gold and mining stocks that could be reached in the next few weeks. We invite you to subscribe now and read today’s issue right away.
Sincerely,
Przemyslaw Radomski, CFA
Founder, Editor-in-chief -
Nothing Is Stopping the GDXJ From Reaching 2020 Lows
August 31, 2022, 9:25 AMBoth gold and silver’s results sagged, but gold stocks are the worst performers so far. What is this decline leading to?
Gold moved visibly lower yesterday, silver closed at the second-lowest level in over 2 years, and miners (both GDX and GDXJ) formed their lowest daily close in over 2 years! If someone has chosen to take short positions, profits have increased.
Let’s take a closer look at what happened.
Weaker and Weaker
The freefall in gold stocks continues. Remember when I wrote that miners were about to slide profoundly, when they were trading over 320 earlier this year? Very few of my colleagues agreed, and some laughed. I guess the laughter is silent by now.
The weakness that we saw in previous weeks – and during yesterday’s session – is truly profound, and what I wrote about it yesterday remains even more up-to-date, as we have now seen a breakdown to fresh lows. Quoting my yesterday’s analysis:
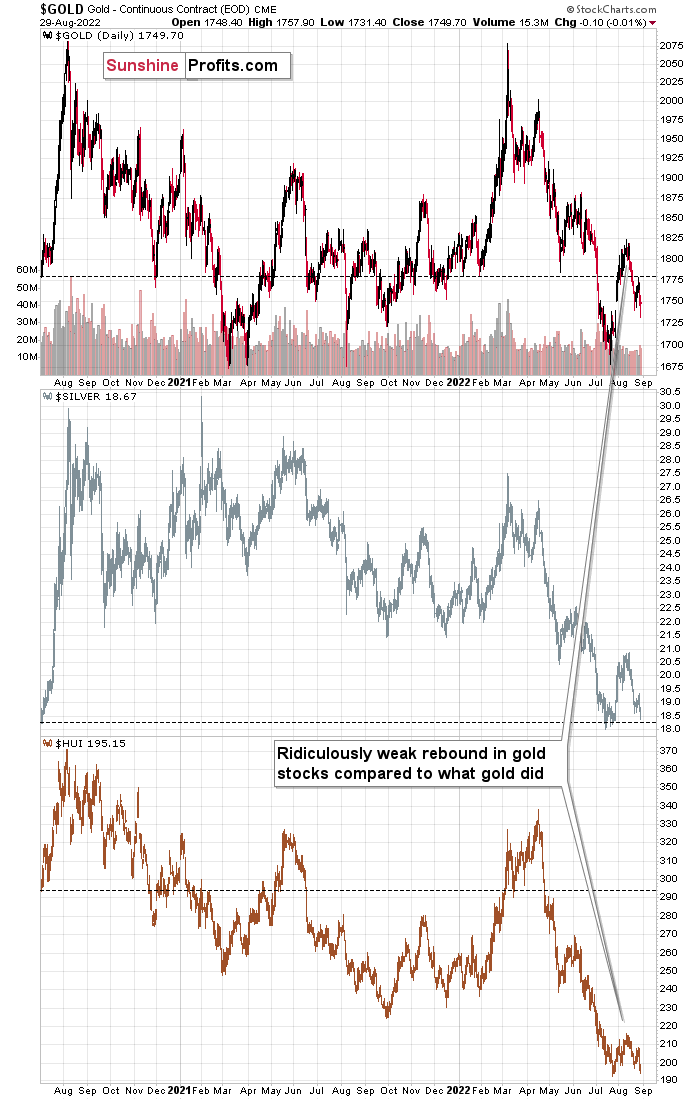
Gold and silver are currently more or less where they were trading about two years ago (before the final part of the mid-2020 rally).
What about gold stocks? The HUI Index would have to rally by almost 50% in order to get back to those analogous price levels!
Gold stocks usually lead gold higher and lower (there are some short-term exceptions, but they are not really applicable right now), and there’s no doubt that miners currently lead gold lower.
Please consider the size of the recent corrective upswing in gold, then in silver, and next, please look at how “much” gold stocks rallied.
Laughable, isn’t it?
Not only that – gold stocks already gave away almost the entire rally, even though gold is only about halfway down.
If you think that this is extremely bearish, then… Of course, you’re right. However, the situation is actually even more extreme than that.
You see, that’s the same thing we saw on the precious metals market in 2013, right before the biggest part of the slide!
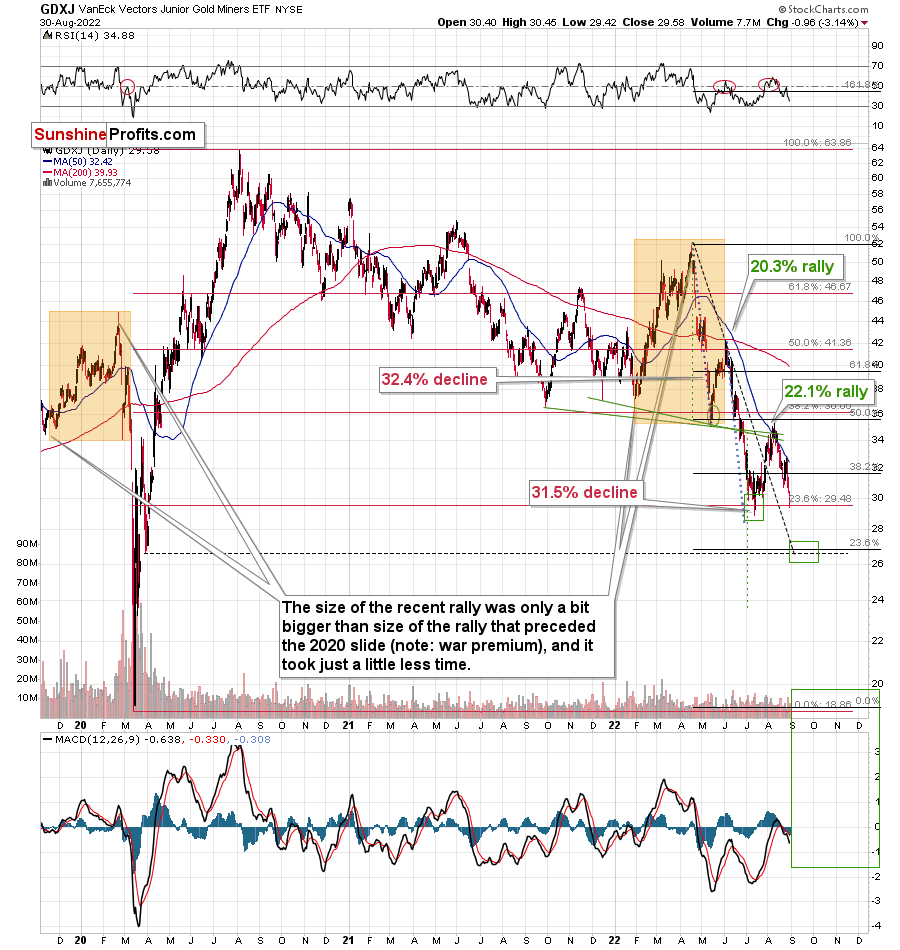
Now, as far as the GDXJ is concerned, it really seems that it’s on its way to its 2020 lows. The question is whether it will get there in the 2020 style or whether the decline will be more measured. If so, then where the corrections might be, and whether it’s a good idea to try to trade them.
Back in 2020, we had a global panic based on something that the modern markets haven’t experienced before (the pandemic, lockdowns). Now we have “relatively regular carnage.” The rates are going up, as well as the USD, and the stock market is going down.
However, it’s not a massive-event driven price move, and thus it can – and is likely to – take place in a rather regular manner.
So, while it’s still likely to be huge, like what we saw in 2008 and 2013, it’s also likely to be more measured and thus technical.
What Happened During the Crisis?
Back in 2008, the price moves were bankruptcy-news driven, while in 2013 the decline took the regular form. Despite the initial reason for gold to move up (Russian invasion in Ukraine), it failed to hold on to its gains, and instead it started to decline in a very visible way. Silver and miners are declining even more and faster.
The pressures from the USD Index and real interest rates are now greater than they were back in 2013, so the current decline has “bigger legs”. It lacks the dramatic circumstances of 2008, though.
What does it all mean? It indicates that the current big move lower is likely to be at least as significant as what we saw in 2013, but at the same time that it might be easier to trade than with the huge price swings that we saw in 2008.
Where does this discussion get us? It gets us to the indication that it’s still possible that we get a reliable rebound from the $27-28 area in the GDXJ, while gold rebounds one last time from the previous lows.
I previously commented that the above move is too uncertain to bet on it, and this remains to be the case However, I would like to point out that it’s still possible that I will write about adjusting the trade at those levels, after all.
This will depend heavily on the way in which the precious metals market falls in the following days. The more sudden and sharper the drop, and the stronger miners are relative to gold (so far this is completely absent), the bigger the odds that we’ll see a corrective upswing.
Thank you for reading our free analysis today. Please note that the above is just a small fraction of the full analyses that our subscribers enjoy on a regular basis. They include multiple premium details such as the interim targets for gold and mining stocks that could be reached in the next few weeks. We invite you to subscribe now and read today’s issue right away.
Sincerely,
Przemyslaw Radomski, CFA
Founder, Editor-in-chief -
Stocks: An Albatross Around Gold’s Neck
August 30, 2022, 7:18 AMLooking at the latest results of precious metals, it’s hard to cast out the impression that stocks are like a ball and chain for gold. Should we expect a repeat of the 2013 slide?
In today’s analysis, I would like to draw your attention to something that’s extremely important but that might be hidden in plain sight.
It’s the way gold stocks perform relative to gold. More precisely, how they fail to perform.
This is an important sign, and I have written about it on multiple occasions. However, what might not be obvious is that the implications of the relative strength or lack thereof are exponentially more important if the same indication is repeated over and over again. At some point, the day-to-day weakness becomes a medium-term trend, and that’s when it becomes really meaningful.
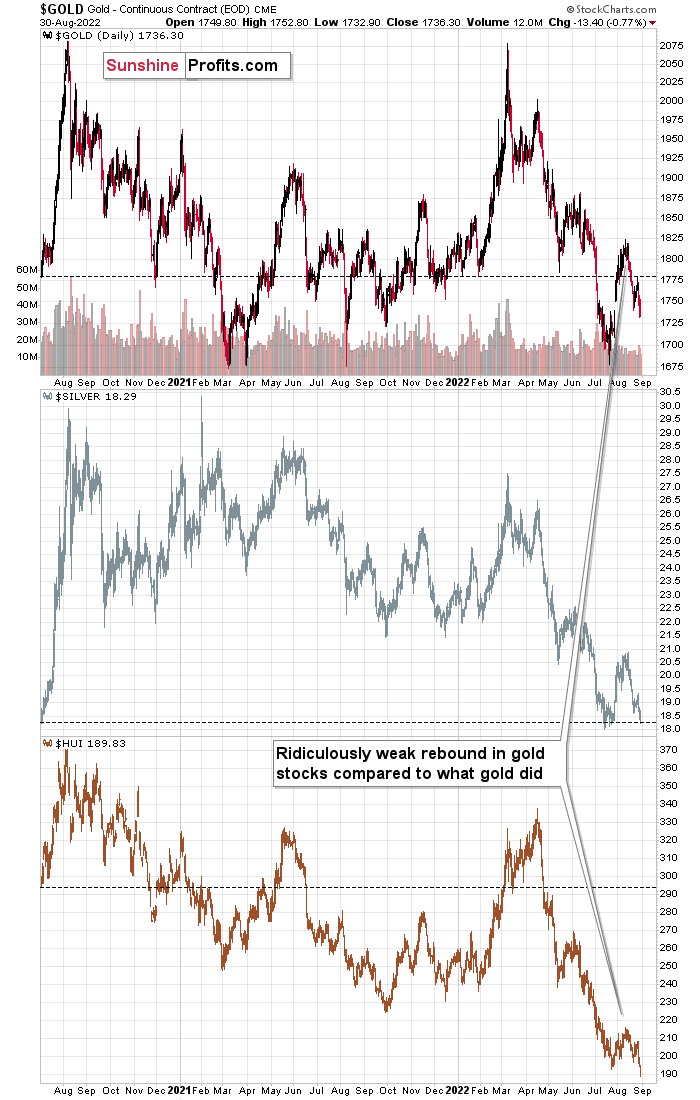
Gold and silver are currently more or less where they were trading about two years ago (before the final part of the mid-2020 rally).
What about gold stocks? The HUI Index would have to rally by almost 50% in order to get back to those analogous price levels!
Gold stocks usually lead gold higher and lower (there are some short-term exceptions, but they are not really applicable right now), and there’s no doubt that miners currently lead gold lower.
Please consider the size of the recent corrective upswing in gold, then in silver, and next, please look at how “much” gold stocks rallied.
Laughable, isn’t it?
Not only that – gold stocks already gave away almost the entire rally, even though gold is only about halfway down.
If you think that this is extremely bearish, then… Of course, you’re right. However, the situation is actually even more extreme than that.
You see, that’s the same thing we saw on the precious metals market in 2013, right before the biggest part of the slide!
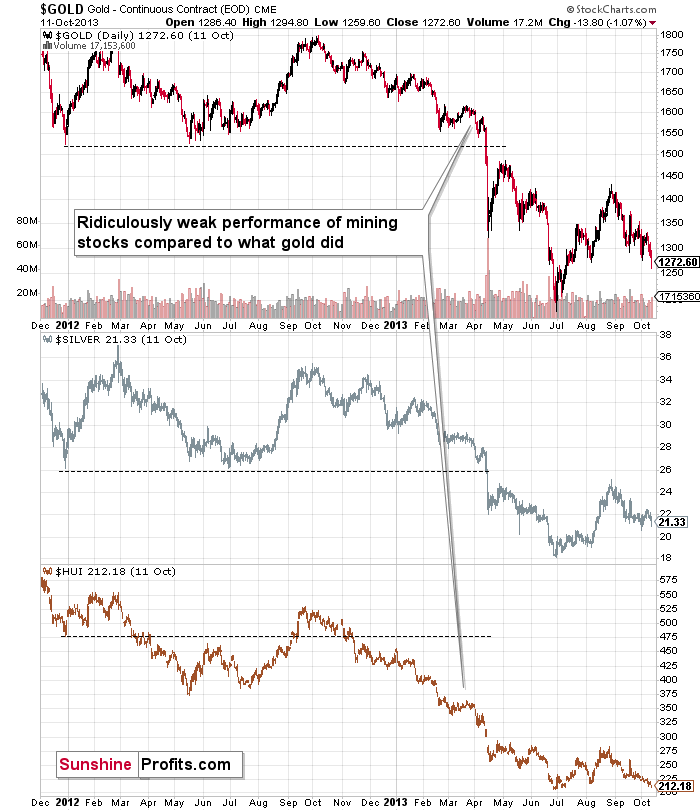
While gold was still in a medium-term horizontal trading pattern, gold stocks were already in a medium-term downtrend – just like what we see right now and what we’ve been seeing in the previous months.
Yes, the profits on our short positions increased once again yesterday, but the above tells us that it’s small potatoes compared to what’s to come. As always, I can’t make any guarantees with regard to price moves or profitability. However, I do think that the upcoming slide will truly be epic. Ever wanted to get back in time and not miss the profits on the 2008 and 2013 declines? Time travel is not yet included in our services, but the current slide is – in my opinion – the next best way to fulfill this wish.
If you can’t or don’t want to profit from declining mining stock prices, I also have good news. Please keep in mind that the decline is not likely to last forever. Based on how the precious metals sector declined in 2008 and 2013, and based on multiple other indications, it seems that we’ll see a major bottom this year. While higher prices are encouraging, please note that there are two moments that determine a given trade’s or investment’s profitability – it’s not just the exit price, but also the entry price.
Thanks to declines and lower prices, one can get in at much lower levels and thus greatly increase the profits (again, I’m not guaranteeing any profits or market performance – nobody can guarantee it) from the entire huge rally that’s likely to take place in the following years.
The “mother of all buying opportunities” in the precious metals sector is likely not here yet, but it’s likely to present itself in the not-too-distant future. Stay tuned!
Thank you for reading our free analysis today. Please note that the above is just a small fraction of the full analyses that our subscribers enjoy on a regular basis. They include multiple premium details such as the interim targets for gold and mining stocks that could be reached in the next few weeks. We invite you to subscribe now and read today’s issue right away.
Sincerely,
Przemyslaw Radomski, CFA
Founder, Editor-in-chief


Gold Investment News
Delivered To Your Inbox
Free Of Charge
Bonus: A week of free access to Gold & Silver StockPickers.
Gold Alerts
More-
Status
New 2024 Lows in Miners, New Highs in The USD Index
January 17, 2024, 12:19 PM -
Status
Soaring USD is SO Unsurprising – And SO Full of Implications
January 16, 2024, 8:40 AM -
Status
Rare Opportunity in Rare Earth Minerals?
January 15, 2024, 2:06 PM

