
tools spotlight

-
Is It Now Left to Wait for a Huge Slide in the Gold Market?
August 15, 2022, 8:21 AMAvailable to premium subscribers only.
-
Why Is the USDX Weak Lately and Gold Not Responding to It?
August 12, 2022, 6:23 AMThe PMs continued their relative underperformances on Aug. 11, as gold fell by 0.36%, silver by 1.89%, the GDX ETF by 1.88% and the GDXJ ETF by 2.15%. Moreover, since the drawdowns occurred alongside the USD Index’s 0.08% slide, the PMs’ inability to rally when the U.S. dollar is weak highlights their technical and fundamental fragility.
500 Narratives
With the S&P 500 in rally mode, short-covering morphed into momentum bids, which have now morphed into FOMO. Moreover, with the bulls brimming with confidence and inflation showing its first signs of slowing, investors are tripping over themselves to position for a dovish pivot.
Please see below:
 Source: CNBC
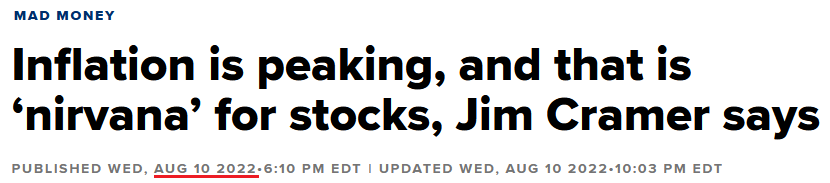
To that point, CNBC’s Jim Cramer said:
“Peak inflation is nirvana for stocks, especially for out-of-favor stocks, like fast-growing tech plays or the financials or the consumer discretionary names. That means you can buy everything from Microsoft to Wells Fargo to Target.”
He added:
“Some companies will absolutely be hurt by the upcoming recession, but others will see their stocks soar because they’re worth more in an environment where inflation is at last possibly under control,”
Thus, while ‘soaring stocks’ are not part of historical recessions, the narrative is another example of making it up as you go along.
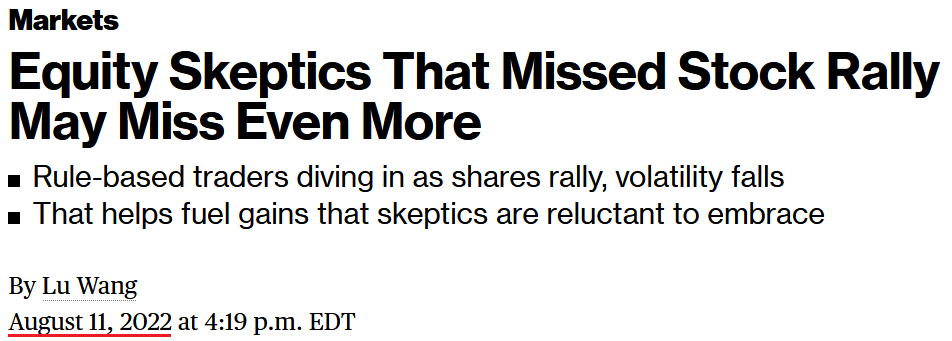
Second, the algorithmic funds – which shift their positions based on realized volatility – have increased their stock holdings as the Cboe Volatility Index (VIX) declined. In addition, with FOMO seeping into the mindsets of hedge funds and long-only managers, you better get on board before you “miss even more.”
Please see below:
 Source: Bloomberg
Third, with investor sentiment doing a complete 180 from June, the chorus calling for 3,000 on the S&P 500 is now calling for new highs. For example, some believe that eclipsing 4,232 (which the S&P 500 did intraday on Aug. 11) signals the end of the bear market. CFRA Chief Investment Strategist Sam Stovall said:
“This remains a bear market rally until we close above the 4,232 level on the S&P. After that, history reminds us that no bear market ever recovered 50% of its decline only to set an even lower low. It would be an early signal that the bear is behind us.”
However, while investors cite erroneous reasons for why the S&P 500 is destined for new all-time highs, “history reminds us” that ‘never’ is also present from a fundamental perspective.
To explain, I’ve noted on numerous occasions that reducing inflation to the Fed’s 2% annual target will require much more economic pain than the consensus realizes. I wrote on May 26:
If you analyze the chart below, you can see that the U.S. federal funds rate (FFR) (the green line) nearly always rises above the year-over-year (YoY) percentage change in the headline Consumer Price Index (the red line) to curb inflation. Therefore, investors are kidding themselves if they think the Fed is about to re-write history.
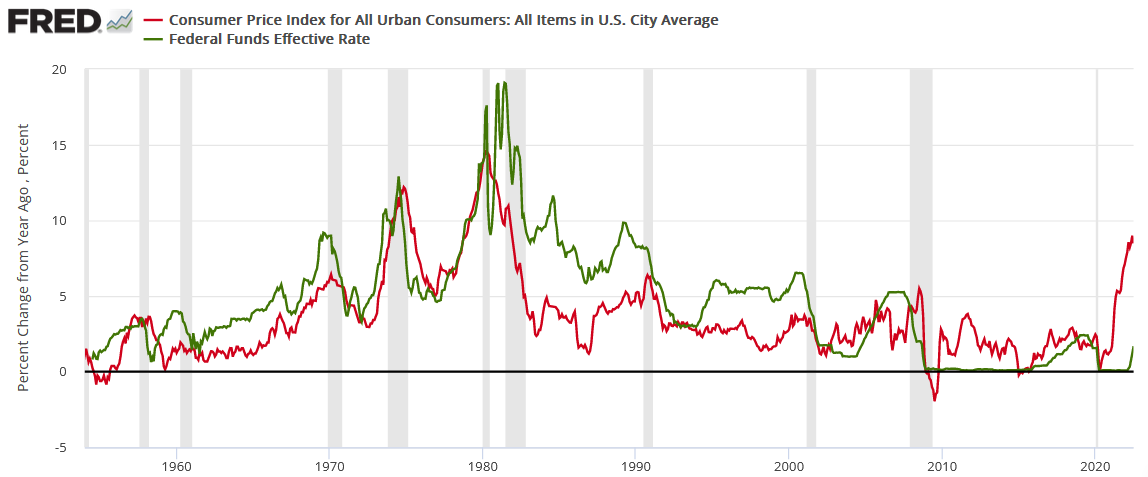
To be specific, the FFR has either eclipsed the YoY headline CPI or come within ~50 basis points of its peak in every inflation battle since 1954. Therefore, please see the unprecedented gap on the right side of the chart. With the YoY headline CPI peaking (for now) at 9.1% and the FFR at 2.5% (the high end of the Fed's 2.25% to 2.5% range), the difference is 6.6%.
As a result, history implies the FFR needs to hit at least 8.6% (which marks ~50 basis points below the current CPI peak). Moreover, while we don't expect the FFR to hit this level, the purpose is to show just how laughable a 3% FFR and 9%+ inflation is from a historical perspective. In reality, a 4.5%+ FFR is much more realistic, and the prospect is far from priced in.
In addition, notice how every inflation spike leads to a higher FFR and then a recession (the gray bars). As such, do you really think this time is different?
Thus, while the bulls unveil several narratives for why the S&P 500 is on the fast track to 5,000, the reality is that inflation is much more problematic than they realize. Also, if you celebrated every substantial inflation peak since 1954, you were left holding the bag when the recession hit soon after.
On top of that, the Fed will double quantitative tightening (QT) to $95 billion per month in September. Therefore, if QE is bullish, what is QT?
Please see below:
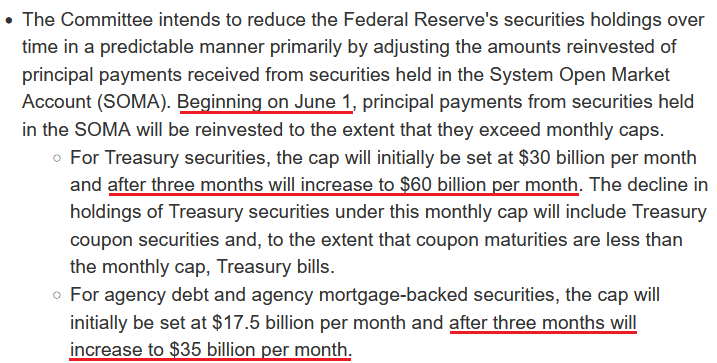 Source: U.S. Fed
As further evidence, none of the current cross-asset metrics signal a bear market low.
Please see below:
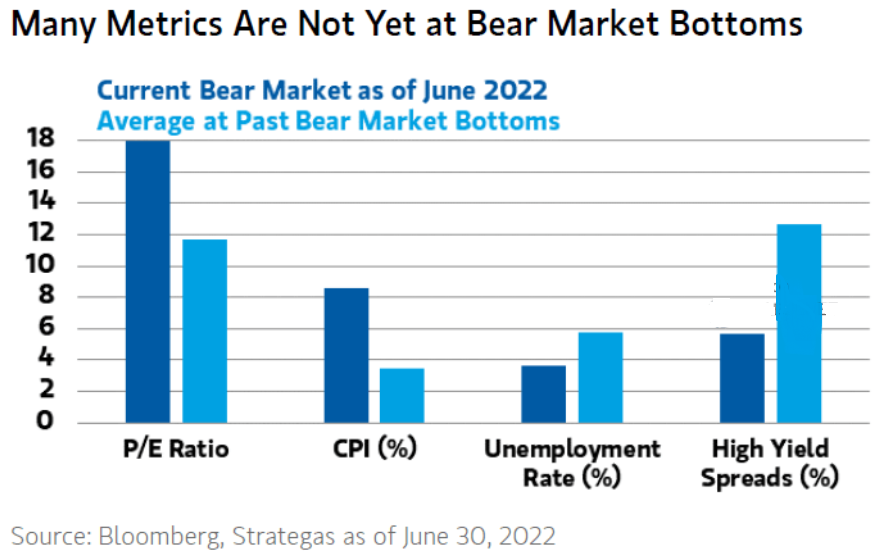
To explain, Morgan Stanley’s data is as of Jun. 30 (the dark blue bars), but the averages (the light blue bars) are the most important. As you can see, the average bear market doesn’t end with a P/E above 17, a CPI at 8%+, high yield spreads at 4.33% and an unemployment rate at 3.5%.
To that point, the U.S. unemployment rate hit a new 2022 low of 3.5% in July. However, the metric always bottoms before a recession.
Please see below:
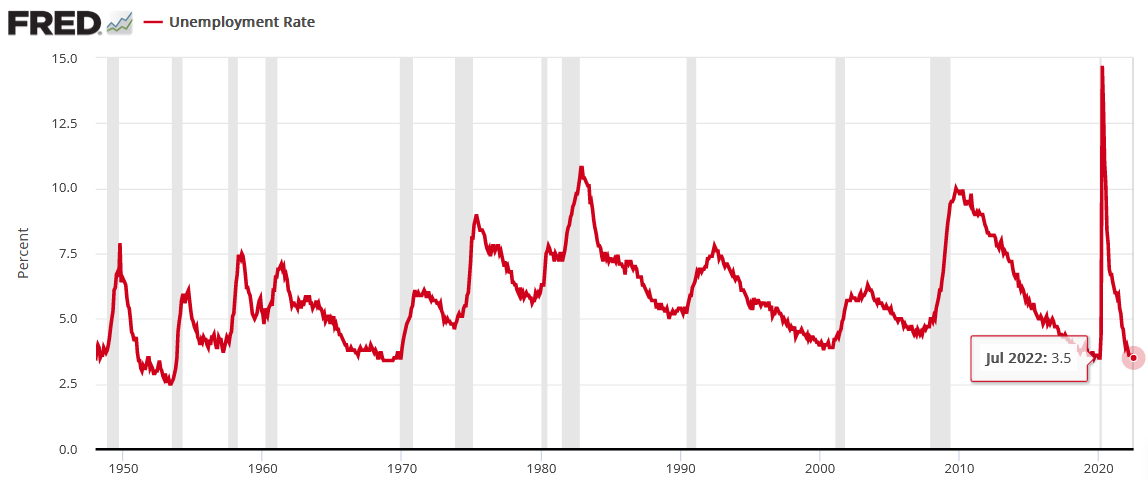
To explain, notice how the U.S. unemployment rate always troughs and then steadily rises before a recession hits. Thus, with the metric heading south in July, the bearish turn still awaits us. Of course, the uninformed crowd assumes that this time is different.
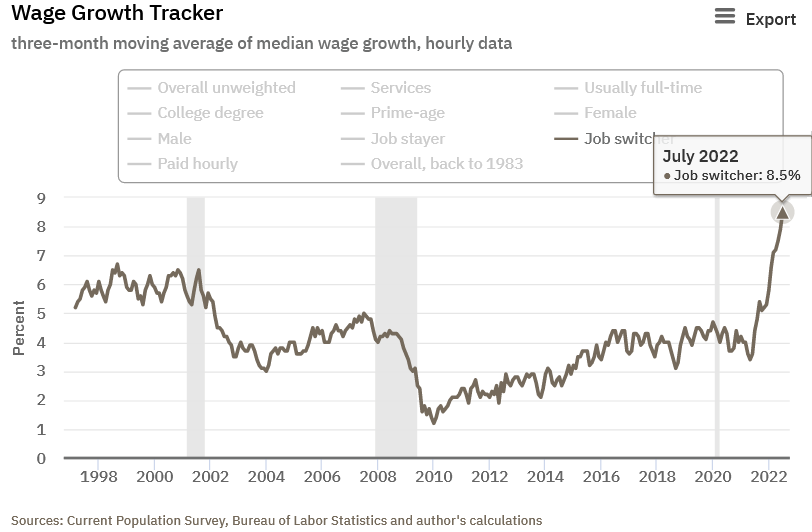
Furthermore, the unemployment rate needs to rise to curb inflation. The Atlanta Fed updated its Wage Growth Tracker on Aug. 11. Moreover, the overall index matched its record high set in June at 6.7%. However, job switchers – Americans that leave their job for a new one – saw their wages increase by 8.5% (a new all-time high and up from 7.9% in June). As a result, it highlights how companies are still paying up to attract new employees.
Please see below:
All in all, while the consensus and the media want you to believe that the bear market is over, their lack of fundamental objectivity highlights why narratives are so destructive. Remember, if normalizing inflation and reducing its balance sheet were so easy, the Fed would have done it already.
Think about it: the Fed was so cautious about tapering its asset purchases that officials waited until inflation was so unanchored that it couldn’t be ignored. However, now that the Fed will hike interest rates to 3.4%, sell $95 billion in bonds per month and increase the U.S. unemployment rate to 3.7% (the Fed’s 2022 SEP projections), while the S&P 500 hits new highs? All the while, reducing the YoY headline CPI to 2%, even though it’s never been done since 1954 without the FFR coming within ~50 basis points of the cycle peak. Good luck.
What’s Wrong With the USD Index?
With the USD Index languishing recently, you may be concerned about the dollar basket's recent pullback. However, the short answer is: nothing is wrong with the greenback. For starters, the U.S. dollar always suffers when investors adopt a risk-on mentality; and with short squeezes lifting the most speculative assets, the fervor has spread to the currency market and uplifted the 2022 laggards.
However, it's important to remember that the same unrealistic expectations that fuel the S&P 500's rise also fuel the USD Index's fall.
Please see below:
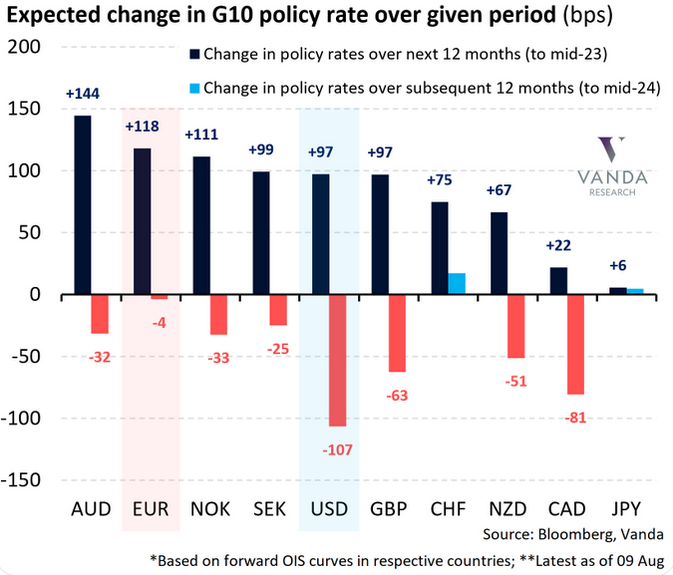
To explain, the dark blue bars above depict the market-implied changes in overnight policy rates for various currencies (regions) from now until mid-2023, while the light blue and red bars above depict the market-implied changes 12 months thereafter.
If you analyze the USD column, you can see that “peak inflation” has investors pricing in 97 basis points of rate increases over the next 12 months and 107 basis points of rate cuts from mid-2023 to mid-2024. Therefore, the consensus expects the U.S. dollar to be a relative underperformer as other central banks play catch-up.
To that point, the EUR column shows that investors expect 118 basis points of rate increases over the next 12 months and 4 basis points of rate cuts from mid-2023 to mid-2024. Thus, expectations are bullish for the EUR/USD, which accounts for nearly 58% of the USD Index’s movement.
However, investors’ rate hike/cut expectations are in la-la land. The idea that the ECB will out-hawk the Fed by hiking more and cutting less contrasts with fundamental reality. Furthermore, the Eurozone is in much worse economic shape than the U.S., and the EUR/USD should continue its descent when investors realize this.
The Bottom Line
Down is up, bad is good, and the narrative is that if you don’t board the bull train, it may leave the station. However, while the crowd is eager to ignore the fundamental imbalances that threaten the outlooks for the S&P 500, gold, silver, and mining stocks, it’s important to remember that gravity is undefeated. Therefore, while sentiment can keep asset prices uplifted in the short term, fundamental warning signs are flashing red.
In conclusion, the PMs declined on Aug. 11, and the GDXJ ETF was the worst performer. Moreover, while the USD Index has suffered recently, it’s likely only a correction within a medium-term uptrend. Furthermore, with investors expecting much more heavy lifting than the ECB can deliver, the EUR/USD’s recent rally is likely on borrowed time.
Thank you for reading our free analysis today. Please note that the above is just a small fraction of the full analyses that our subscribers enjoy on a regular basis. They include multiple premium details such as the interim targets for gold and mining stocks that could be reached in the next few weeks. We invite you to subscribe now and read today’s issue right away.
Sincerely,
Przemyslaw Radomski, CFA
Founder, Editor-in-chief -
The GDXJ Didn’t Benefit From Investors’ Bullish Frenzy
August 11, 2022, 5:57 AMA weaker-than-expected headline Consumer Price Index (CPI) print didn’t provide the PMs with much stimulation, as gold rallied by 0.08%, silver by 1.27%, the GDX ETF by 0.71% and the GDXJ ETF by 0.12%. In contrast, the NASDAQ Composite and the S&P 500 rallied by more than 2%. Moreover, with the USD Index declining by 1.10% and U.S. Treasury yields also dropping, the PMs’ relative weakness is profoundly bearish.
Gold Left Out in the Cold
With the Consumer Price Index (CPI) coming in cold on Aug. 10, jubilation overwhelmed the financial markets, as the S&P 500 and risk-on currencies surged. However, with gold, silver, and mining stocks underperforming, the PMs were largely forgotten during the bullish feeding frenzy.
Moreover, while the consensus celebrates the inflation deceleration, I warned before the opening bell that a slowdown was likely. I wrote:
With investors eagerly awaiting the release of the CPI, the results could sway short-term sentiment. Moreover, while the headline CPI is expected to show a year-over-year (YoY) deceleration – due to the decline in oil and gas prices – the economic pain required to reduce the metric to 2% is materially underestimated by the consensus.
Therefore, while investors may take a glass-half-full approach when analyzing the data, the medium-term implications of eliminating inflation should weigh heavily on gold, silver, and mining stocks.
To that point, with lower oil and gas prices as the main culprits, the medium-term roadmap continues to unfold as expected.
Please see below:
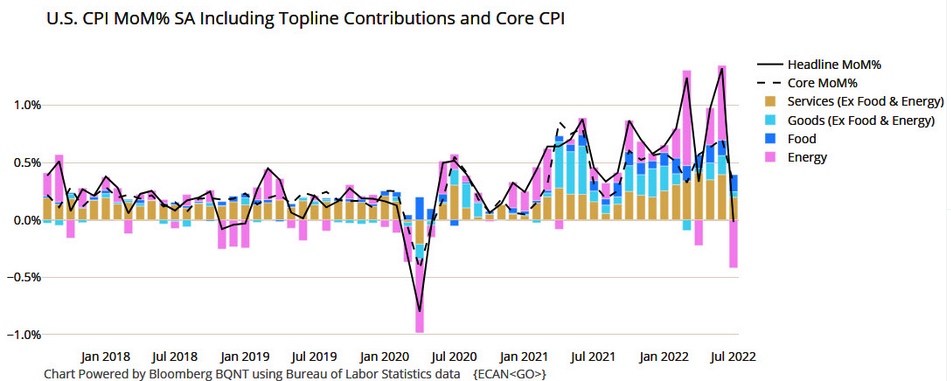
To explain, the black line above tracks the month-over-month (MoM) percentage change in the headline CPI, while the colored bars above represent the various components' contributions. If you analyze the right side of the chart, you can see that energy (the purple bar) was the only component to decline MoM in July. As a result, the print didn't reveal anything that we didn't expect.
Likewise, the idea of "peak inflation" is much more semblance than substance. For example, there is a misnomer in the financial markets that the battle is won when inflation stops going up. However, the reality is that reducing inflation to 2% is much more difficult than reducing the pace of the increases. As such, the consensus drastically underestimates the amount of economic pain that's required to achieve true normalization.
In addition, the core CPI increased by 0.31% MoM in July, so inflation is still increasing despite the energy respite. More importantly, investors celebrated an event that occurred several times in the 1970s and1980s, in June 2021 and in March 2022.
Please see below:
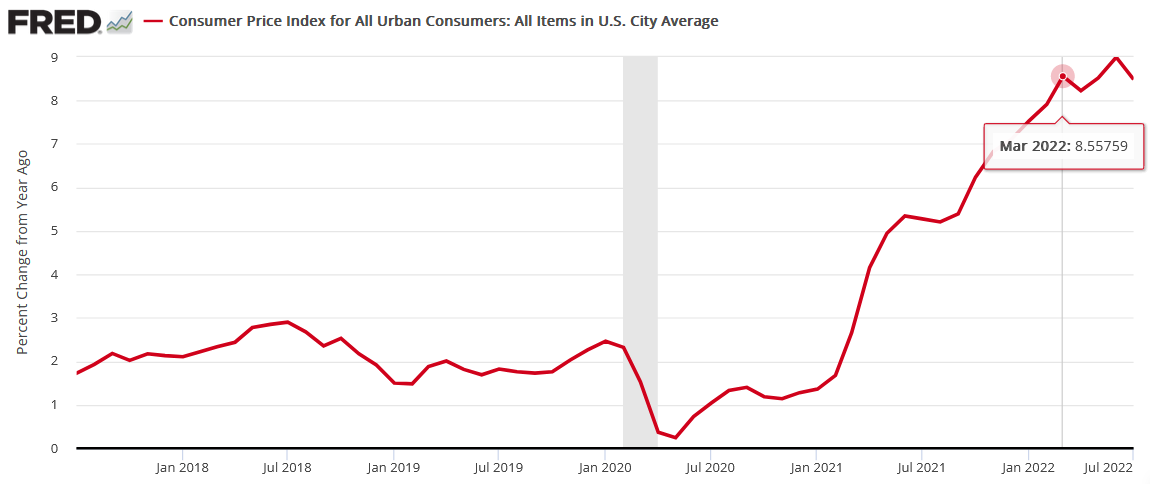
To explain, the red line above tracks the YoY percentage change in the headline CPI. Remember when “peak inflation” was initially present in March? Likewise, the headline CPI also decelerated from June to August 2021 before increasing once again.
Furthermore, the “peak inflation” crowd also enjoyed plenty of premature celebrations in the 1970s and 1980s.
Please see below:
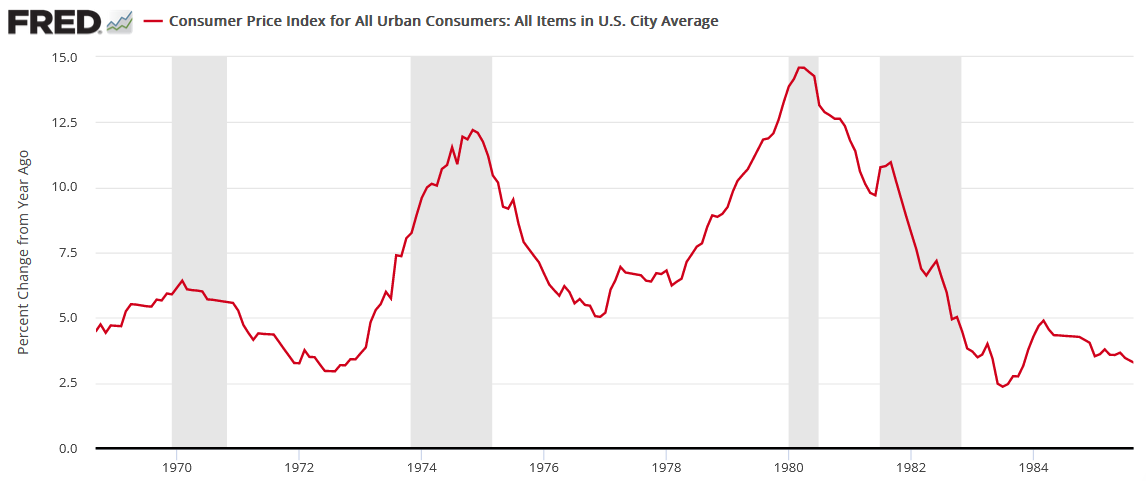
To explain, the red line above also tracks the YoY percentage change in the headline CPI, and the gray vertical bars represent recessions. Moreover, notice how plenty of short-term decelerations (declines or pauses in the red line) were present. Even during the largely uninterrupted surge from 1978 to 1980, the YoY percentage change in the headline CPI declined or flatlined twice along the way. Therefore, while sentiment rules the day in the short term, the crowd is overly-optimistic about how this all ends.
As further evidence, the Atlanta Fed’s Sticky CPIs hit new 2022 highs.
Please see below:
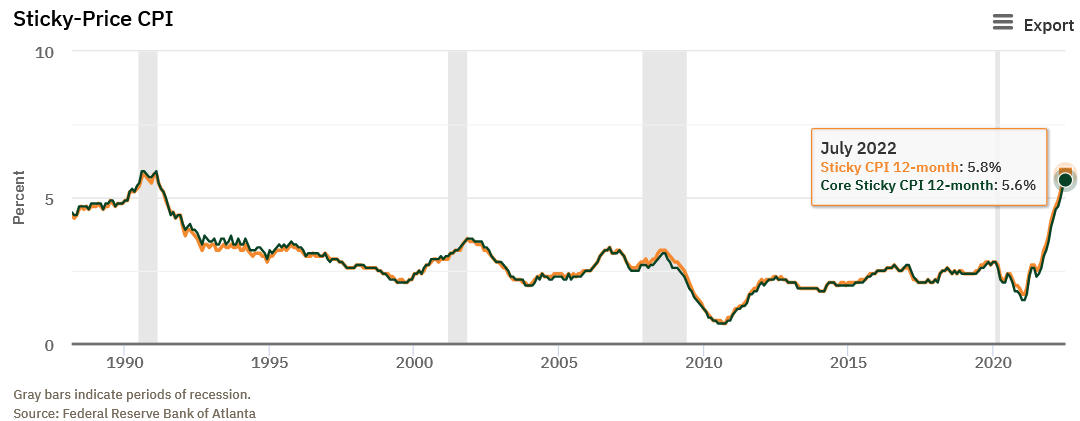
To explain, the orange and green lines above track the YoY percentage changes in the Sticky and core Sticky (excluding food and energy) CPIs. If you analyze the right side of the chart, you can see that neither decelerated in July. For context, the Atlanta Fed defines the metrics as:
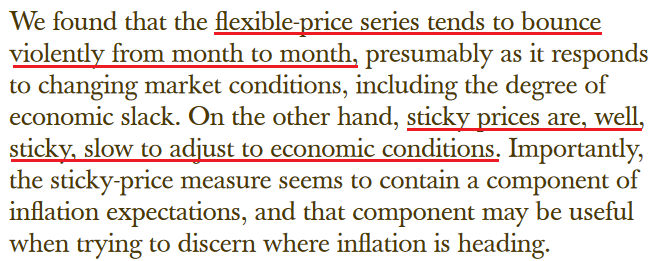
“The Sticky CPI is calculated from a subset of goods and services included in the CPI that change price relatively infrequently. Because these goods and services change price relatively infrequently, they are thought to incorporate expectations about future inflation to a greater degree than prices that change on a more frequent basis. One possible explanation for sticky prices could be the costs firms incur when changing price.”
Moreover, a report by Atlanta and Cleveland Fed researchers came to the same conclusion. An excerpt read:
“We are interested in whether changes in the flexible CPI or sticky CPI improve the forecast of headline inflation at various numbers of months into the future…. We find that forecasts of the headline CPI that are based on the sticky-price data tend to be more accurate than the forecasts based on headline inflation. Further, CPI predictions using sticky-price data perform pretty well relative to CPI forecasts using core CPI data. We also find that the relative accuracy of the sticky-price Phillips curve increases as the forecast horizon gets longer.”
Please see below:
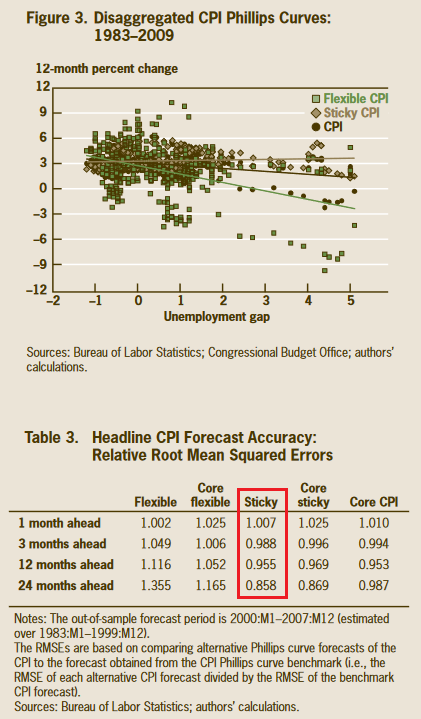
To explain, the chart and the red box above show how the Sticky CPI has the smallest forecasting error when attempting to predict the future direction of the headline CPI. Therefore, with the metric hitting a new 2022 high in July, investors' optimism contrasts with the “sticky” realities. To that point, the researchers concluded:
 Source: Atlanta/Cleveland Fed
Thus, while volatility in the energy markets made the headline CPI look more attractive to the “soft landing” crowd, the Sticky CPI provides important clues about how embedded inflation is in the U.S. economy.
Continuing the theme, I’ve long warned that rent inflation would prove problematic for the headline CPI. Moreover, with the Shelter CPI hitting a new 2022 high, it’s another indicator of why the Fed’s war with inflation will be one of attrition.
Please see below:
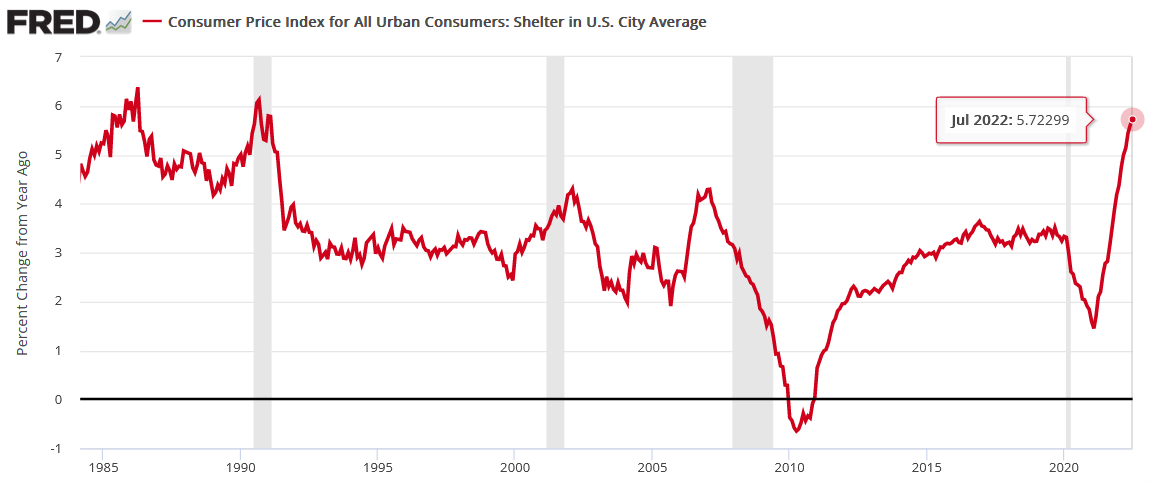
Finally, while the inflation pause was met with applause, the headline CPI could repeat the feat for another eight months and still be 1.1% above the Fed’s 2% target in March 2023.
Please see below:
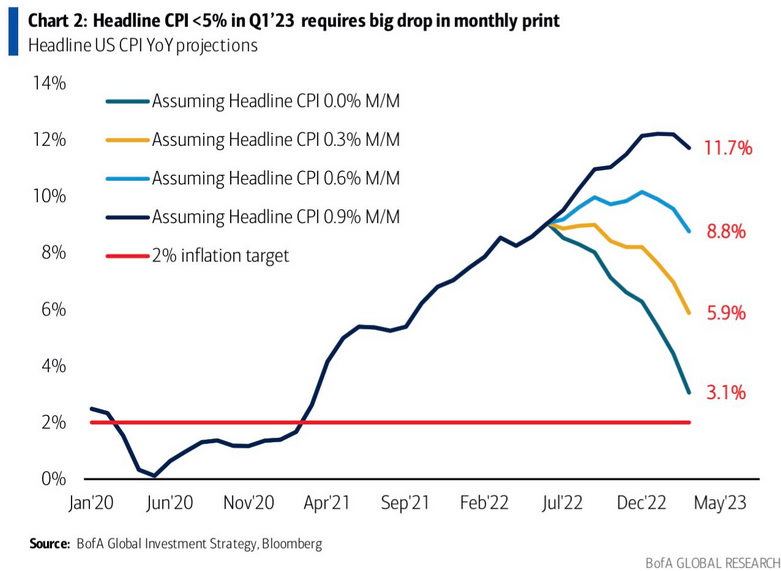
To explain, the various lines above track the trajectory of the YoY percentage change in the headline CPI, assuming different MoM scenarios. If you analyze the teal line, you can see that a flat headline CPI for the next eight months would put the headline CPI at 3.1% YoY in March 2023.
However, with the sticky inflation components still increasing, that forecast would require energy prices to decelerate MoM for the next eight months. Conversely, the light blue and gold lines are more reflective of fundamental reality. Under those scenarios, 0.3% to 0.6% MoM increases would put the headline CPI at 5.9% YoY and 8.8% YoY in March 2023.
Thus, those front-running a potential dovish pivot don’t realize that material deflation is needed to reach the Fed’s 2% target anytime soon; and with the Sticky CPI hitting a new 2022 high, does it seem like we’re near that point?
Fed Not Impressed
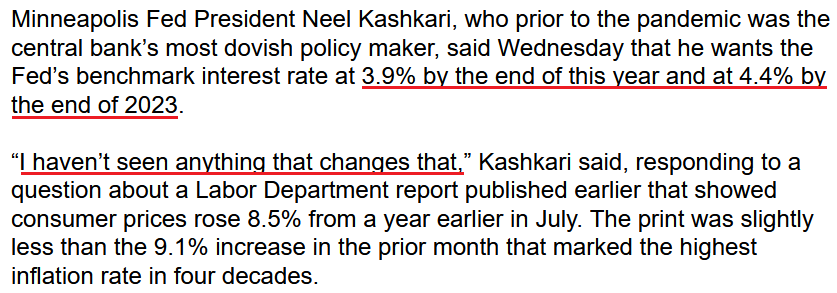
While investors clamor for the next round of QE, Fed officials poured cold water on that notion on Aug. 10. For example, Minneapolis Fed President Neel Kashkari (a reformed dove) said, “I think a much more likely scenario is we will raise rates to some point and then we will sit there until we get convinced that inflation is well on its way back down to 2% before I would think about easing back on interest rates.”
As a result, the man “who prior to the pandemic was the central bank’s most dovish policymaker” sees the U.S. federal funds rate (FFR) moving materially higher in the months ahead.
Please see below:
 Source: Bloomberg
Moreover, while Chicago Fed President Charles Evans welcomed the monthly pullback, he said on Aug. 10 that inflation remains “unacceptably high” and “that we will be increasing rates the rest of this year and into next year to make sure inflation gets back to our 2% objective.”
The Bottom Line
While the headline CPI retreated in July, the impact of lower oil and gas prices was far from unexpected. Moreover, while stock investors went all in, the PMs underperformed, and the GDXJ ETF gave up nearly all of its intraday gains. In addition, the relative weakness occurred alongside a decline in U.S. Treasury yields and a sharp drop in the USD Index. As such, the PMs likely understand what the stock bulls will realize in the months ahead.
In conclusion, the PMs rallied on Aug. 10; but when considering the pullback in interest rates and the U.S. dollar, their performances were relatively poor. Therefore, the medium-term backdrop is much less optimistic than the S&P 500's price action suggests.
Thank you for reading our free analysis today. Please note that the above is just a small fraction of the full analyses that our subscribers enjoy on a regular basis. They include multiple premium details such as the interim targets for gold and mining stocks that could be reached in the next few weeks. We invite you to subscribe now and read today’s issue right away.
Sincerely,
Przemyslaw Radomski, CFA
Founder, Editor-in-chief -
The Gold Market Holds Its Breath Ahead of the CPI Release
August 10, 2022, 9:12 AMThe PMs went their separate ways on Aug. 9, as gold rallied by 0.39%, silver fell by 0.64%, the GDX ETF fell by 0.22%, and the GDXJ ETF underperformed, declining by 1.07%. Moreover, the USD Index declined by 0.07%, while U.S. Treasury yields rallied. Furthermore, while today’s Consumer Price Index (CPI) release may induce some intraday volatility, the medium-term implications are unchanged: the PMs’ technical and fundamental outlooks continue to worsen, and lower lows should materialize in the months ahead.
Here Comes the CPI
With investors eagerly awaiting the release of the Consumer Price Index (CPI), the results could sway short-term sentiment. Moreover, while the headline CPI is expected to show a year-over-year (YoY) deceleration – due to the decline in oil and gas prices – the economic pain required to reduce the metric to 2% is materially underestimated by the consensus.
Therefore, while investors may take a glass-half-full approach when analyzing the data, the medium-term implications of eliminating inflation should weigh heavily on gold, silver, and mining stocks.
For example, the U.S. Bureau of Labor Statistics (BLS) released its productivity report on Aug. 9. Moreover, with nonfarm productivity declining by the most on record in Q2, the data is profoundly inflationary.
Please see below:
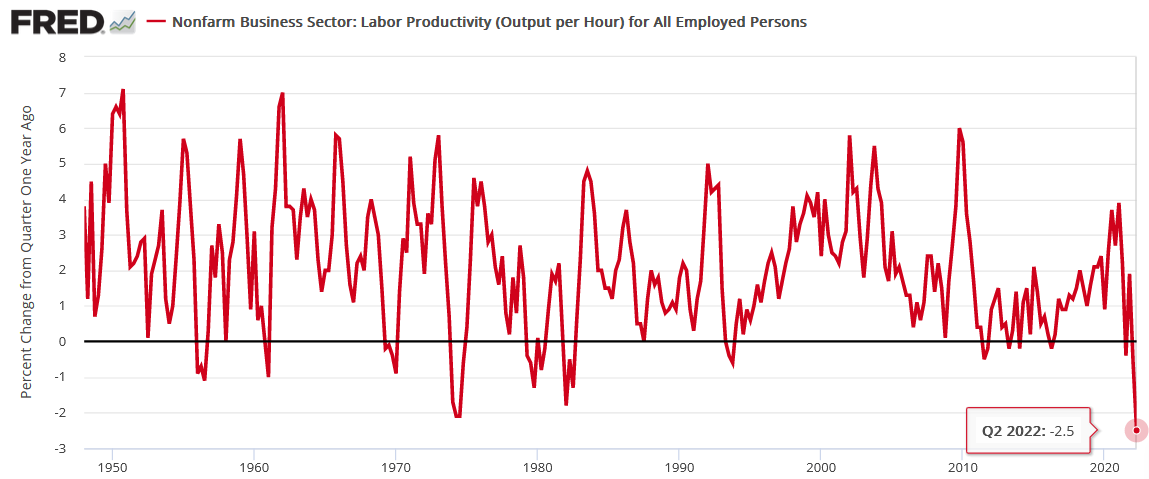
To explain, the red line above tracks the percentage change from the quarter one year ago. If you analyze the right side of the chart, you can see that the metric has never printed a lower figure in its nearly 75-year history.
Furthermore, productivity measures the amount of output produced per hour. Therefore, when productivity declines, it means that companies produced the same amount of goods in more time or less goods in the same amount of time. In a nutshell: a lack of efficiency increases companies’ expenses, and the results are inflationary.
To that point, unit labor costs – which factor in wage increases and productivity – increased by 10.8% in Q2 and outperformed economists’ consensus estimate.
Please see below:
 Source: Investing.com
 The official BLS report stated:
“Unit labor costs in the nonfarm business sector increased 10.8 percent in the second quarter of 2022, reflecting a 5.7-percent increase in hourly compensation and a 4.6-percent decrease in productivity. Unit labor costs increased 9.5 percent over the last four quarters. This is the largest four-quarter increase in this measure since a 10.6-percent increase in the first quarter of 1982.”
Thus, with employees’ efficiency down and their wages up, U.S. companies must raise prices to protect their profit margins. If not, the excess costs will decrease their earnings, and investors will grow restless. As such, the data paints an ominous portrait of the medium-term inflation backdrop.
The Earnings Picture
With 'macro' analysts only seeing a bird's-eye view of the inflation picture they miss the realities on the ground. As a result, while the crowd uses top-down charts to explain why inflation should decline sharply, they don't realize that the bottom-up data suggests otherwise.
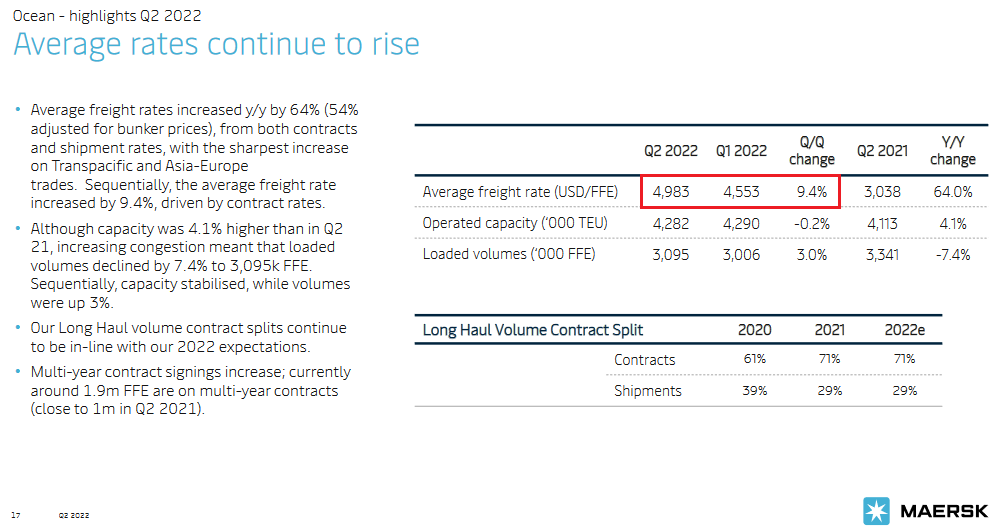
For example, freight rates have declined substantially, which reduces the burden of higher shipping costs. However, A.P. Møller-Mærsk – the largest shipping company in the world – is still charging higher prices for ocean freight. The company released its second-quarter earnings on Aug. 2, and CEO Soren Skou said during the conference call:
“As of today, the average contract rate for the year is expected to be $1,900 per FFE higher than in 2021. The increase of $500 compared to our expectations at the end of Q1 reflects much better performance in Q2 itself, higher conclusion of deals in the latter part of Q2 and over the summer, a positive effects from higher share of contracts being hit all than expected, and a small positive buff effects.”
CFO Patrick Jany added:
“Q2 saw a continuation of the global congestions, with an accumulation of several disruptions, offsetting the weakening demand and lower economic outlook and implying still a very high level freight rates. Although spot rates softened slightly, during the quarter, they remained high in absolute terms, and we continue to sign contracts at higher rates than previously, leading to an average rate increase of 64% compared the previous year.”
Thus, the average ocean freight rate was 9.4% higher in Q2 than in Q1.
Please see below:
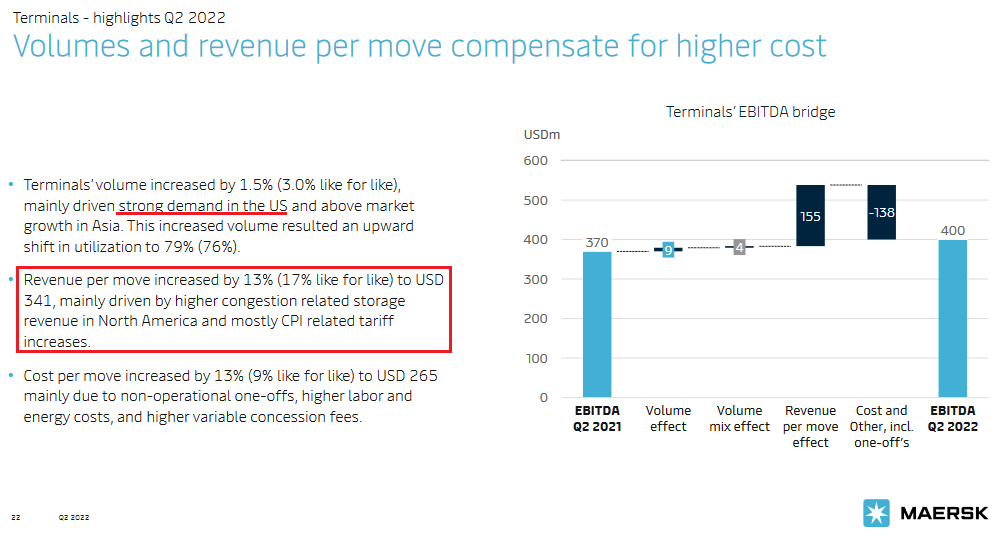
In addition, the company’s terminals segment – which aids the transport process through loading and/or unloading cargo – saw its revenue per move increase by 13% as “CPI related tariff increases” were implemented to offset higher costs.
Please see below:
As a result, since the 'macro' community doesn't comb through these earnings reports, they miss the critical details showcasing inflation's stickiness. To that point, Skou concluded:
“I think there's really any doubt on where the global economy is going, right? So there will be a reduced demand at one point in time. But we would expect for all the factors, which we typically have, as we discussed earlier on, that this will be a gradual development and that ultimately as well freight rates will stabilize at a higher level than they were in the past and higher than the cost scale.”
Thus, with higher-for-longer freight rates poised to persist, management increased the company’s profitability and cash flow guidance for the second time in 2022. As such, does it seem like demand destruction has unfolded?
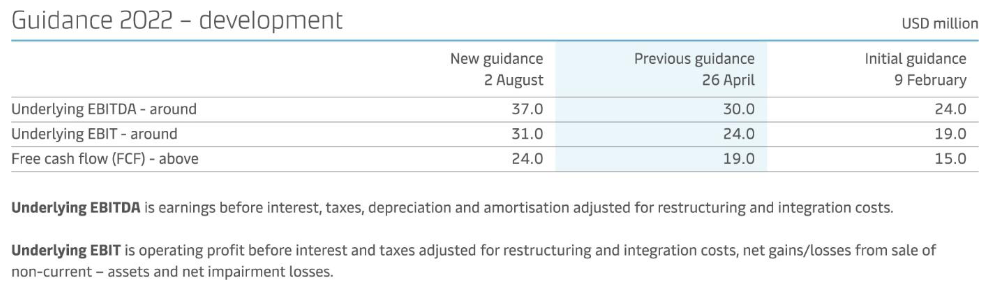 Source: A.P. Møller-Mærsk
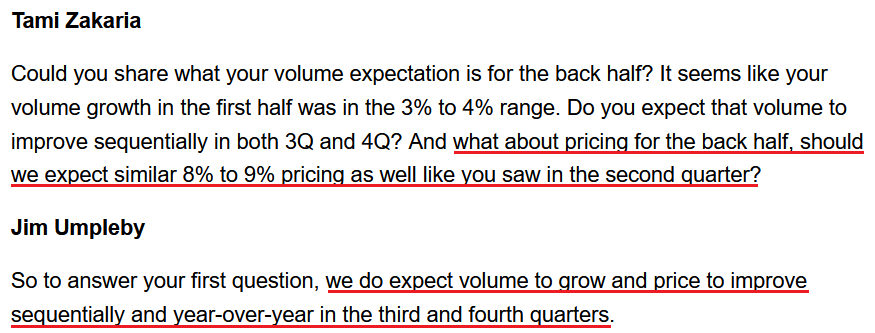
On top of that, Caterpillar – an industrial company with a nearly $100 billion market cap – released its second-quarter earnings on Aug. 2. When asked about the recent decline in commodity prices, CEO Jim Umpleby responded:
“We're still dealing with an inflationary environment, and we have not seen a decrease from our suppliers as a result of commodity price reductions. As you know, it takes a while for those kind of changes to work their way through the supply chain. And of course, there's volatility there as well. So, no. The short answer to the question is no, we haven't seen any moderation in those costs.”
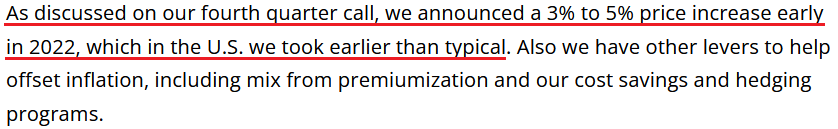
Furthermore, after increasing prices by 8% to 9% in Q2, Umpleby told analysts to expect “sequentially” higher prices in Q3 and Q4.
Please see below:
 Source: Caterpillar/Seeking Alpha
He added:
“We expect a volume and price realization to improve in the second half of the year, which should lead to sales growth in the remaining quarters of the year, both sequentially and year-over-year. We also expect adjusted operating profit margins will improve both sequentially and year-over-year in the second half of 2022 as our price realization will more than offset manufacturing cost increases.”
Continuing the theme, Molson Coors – the second-largest brewer in the U.S. – released its second-quarter earnings on Aug. 2. As a prelude, CFO Tracey Joubert said during the Q1 earnings call:
 Source: Molson Coors/AlphaStreet
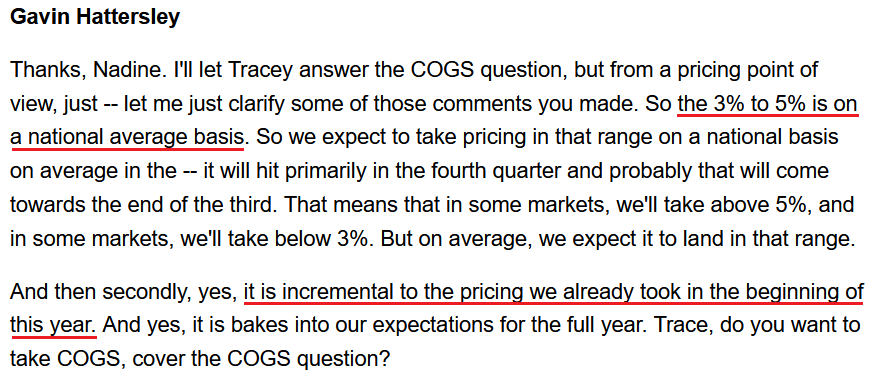
Moreover, CEO Gavin Hattersley provided an update during the Q2 earnings call:
“We knew we were going to take a price increase in the fall. We're probably going to get a little more than we were expecting. So it was our expectation that we're going to get it. But we're probably taking a little bit more (…). We will have the benefits of our fourth quarter U.S. price increase which will further help offset inflation.”
As well, consumers are not balking at the higher prices. He added:
“I think we said on the Q1 call that elasticity wasn't as high as one would have expected given the pricing that we put into the marketplace in January and February of this year. And we'll do the same thing again with this price increase. We'll watch the elasticities and we'll watch how our brands perform in the market very carefully. But without rehashing what I said, our brand performance from a share point of view is strong, and we're pleased with it.”
Therefore, with another 3% to 5% price increase scheduled for Q4, Hattersley made it clear that the hikes would be on top of the increases that commenced in early 2022.
Please see below:
 Source: Molson Coors/Seeking Alpha
Thus, while the consensus hopes that inflation will go quietly into the night, the reality is that U.S. corporations are still increasing their prices with little pushback from consumers. Furthermore, with average hourly earnings and unit labor costs outperforming expectations, the record decline in productivity highlights how input pressures stretch well beyond commodity prices.
As a result, the neutral U.S. federal funds rate (FFR) is much higher than investors and the Fed realize, and a wake-up call should have negative consequences for the PMs.
The Bottom Line
While a decelerating CPI may increase investors’ optimism, the decline in oil and gas prices will only enhance consumers’ spending power. Therefore, what’s bearish for the headline CPI is bullish for the core CPI. Furthermore, with financial conditions still too loose to curb inflation, the Fed needs higher real yields and lower asset prices to achieve its dual mandate. As such, reality should re-emerge in the months ahead.
In conclusion, the PMs were mixed on Aug. 9, though, the GDXJ ETF was a noticeable underperformer. Moreover, with the meme-stock surge fizzling, further drawdowns of the S&P 500 should weigh heavily on the junior miners. Thus, more downside should confront gold, silver, and mining stocks over the medium term.
Thank you for reading our free analysis today. Please note that the above is just a small fraction of the full analyses that our subscribers enjoy on a regular basis. They include multiple premium details such as the interim targets for gold and mining stocks that could be reached in the next few weeks. We invite you to subscribe now and read today’s issue right away.
Sincerely,
Przemyslaw Radomski, CFA
Founder, Editor-in-chief -
Is There Any Chance of an Interest Rate Cut in 2023?
August 9, 2022, 7:06 AMAs investors navigate the uncertain economic environment, the question on everyone’s mind is: when will the Fed pivot? With the U.S. economy slowing and unprecedented debt levels putting America in a precarious position, the consensus assumes that the Fed will let inflation rage to avoid widespread bankruptcies. Therefore, gold, silver, and mining stocks will surge as the dovish pivot approaches.
It’s Not a Choice
Moreover, our subscriber shared an article that outlines “why the Fed will have to change course.” In a nutshell: it presents the same arguments that perma-investors have cited since the Fed threatened to taper its asset purchases. However, while these narratives garner plenty of attention, they’re out of touch with economic reality and historical precedent.
For example, I’ve stated on many occasions that dealing with inflation is not a choice, and while the consensus assumes that a Fed pivot will set everything alight, a realization is the worst-possible economic outcome.
To explain, let’s conduct a history lesson. The Fed wrote an essay about “The Great Inflation” from 1965 to 1982. Moreover, when discussing the origins of the crisis, the report stated:
“Motivated by a mandate to create full employment with little or no anchor for the management of reserves, the Federal Reserve accommodated large and rising fiscal imbalances and leaned against the headwinds produced by energy costs. These policies accelerated the expansion of the money supply and raised overall prices without reducing unemployment.”
Sound familiar? More importantly, when inflation raged and a weakened U.S. economy led to a rise in unemployment, Americans and politicians soon realized that inflation was the greater evil. The report stated:
“As businesses and households came to appreciate, indeed anticipate, rising prices, any trade-off between inflation and unemployment became a less favorable exchange until, in time, both inflation and unemployment became unacceptably high. This, then, became the era of ‘stagflation’.”
“In 1964, when this story began, inflation was 1 percent and unemployment was 5 percent. Ten years later, inflation would be over 12 percent and unemployment was above 7 percent. By the summer of 1980, inflation was near 14.5 percent, and unemployment was over 7.5 percent.”
Remember, inflation is like termites; it eats away at the U.S. economy until it crumbles. Therefore, the greater risk is not curbing inflation. The report continued:
“Once in the position of having unacceptably high inflation and high unemployment, policymakers faced an unhappy dilemma. Fighting high unemployment would almost certainly drive inflation higher still, while fighting inflation would just as certainly cause unemployment to spike even higher.”
However, with the destructive nature of inflation now obvious (we’re not there yet in 2022), the answer to the “trade-off” was clear, and the narrative shifted dramatically. For starters:
 Source: U.S. Fed
Then:
 Source: U.S. Fed
As such, the idea that the Fed can pivot and inflation will subside may be the biggest bubble in the financial markets. Not only does it lack economic logic, but it is antithetical to historical precedent. To that point, while the chorus calls for Fed easing, I warned on Aug. 5 that unanchored inflation forced the Fed to raise interest rates during the 1970s and 1980s recessions. I wrote:
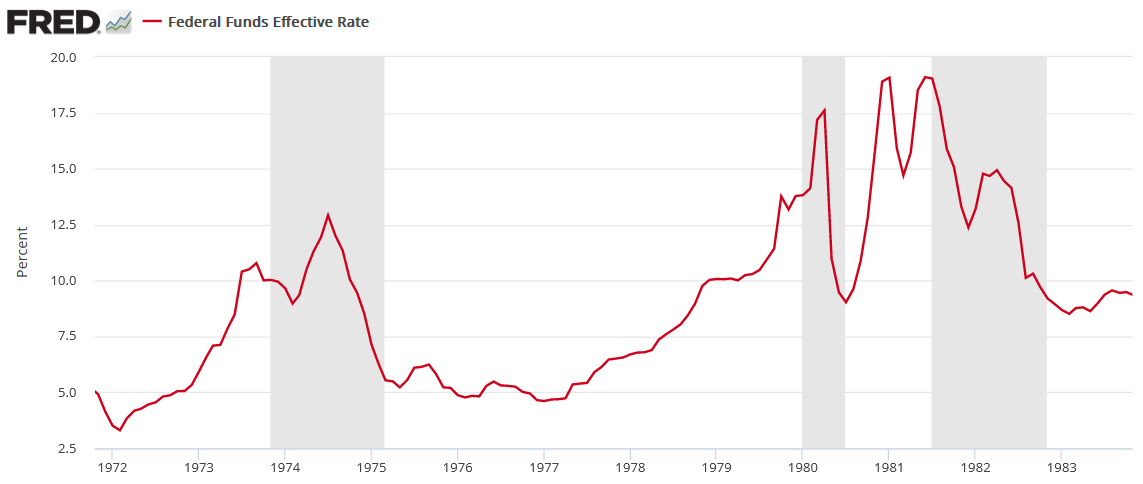
To explain, the red line above tracks the FFR during the 1970s and 1980s, and the vertical gray bars represent recessions. For one, unanchored inflation forced the Fed to raise interest rates during (not just before) all three recessions. In addition, the ~1974 and ~1982 recessions show how after the Fed cut rates to support economic growth, the central bank had to reverse course and raise the FFR once again. As such, the consensus underestimates how difficult it is to slay inflation once it gets going.
Furthermore, it’s important to remember that Arthur Burns was the Fed Chairman from 1970 to 1978, and he was much less hawkish than Paul Volcker (who was Chairman from 1979 to 1987). As a result, the rate cuts on the chart above that began in 1973 and then reversed sharply higher in 1974 were administered by Burns. However, when the Richmond Fed did a post-mortem on the monetary mistake, the findings mirrored the false narratives that are prevalent today. An excerpt read:
“Volcker still deserves credit for resisting political pressure to ease during the 1981–82 recession, which might have led to a continuation of the stop-go approach the Fed was seen as pursuing under Burns. What distinguishes Volcker from Burns in the minds of many is the fact that he followed through after initial disinflationary policy moves, a consistent approach that helped build and maintain the Fed’s credibility for keeping inflation in check.”
For context, a “stop-go approach” means the Fed cuts interest rates and then has to raise them once again. However, the mistakes of the past highlight how the Fed’s inflation gambit ends the same either way.
Please see below:
 Source: Richmond Fed
Thus, doesn’t that also sound familiar?
- We have politicians redefining the definition of a recession while investors clamor for a dovish pivot.
- The slightest drop in commodity prices, inflation expectations or the Consumer Price Index (CPI) is heralded as “peak inflation,” and therefore, the Fed can ease.
As such, Fed Chairman Jerome Powell can follow Volcker's path and raise the U.S. federal funds rate (FFR) to capsize inflation. Or, he can follow Burns' path and implement a "stop-go approach." However, history shows that both paths end with a much higher FFR.
Furthermore, don't you think that investors were calling for dovish pivots in the 1970s and 1980s? The Richmond Fed cited how "political pressure to stimulate the economy shook the Fed's resolve." As a result, it's naïve to assume that politicians and investors didn't argue about why the Fed needed to pivot back then.
However, the common denominator is that inflation didn't (and doesn't) magically disappear. In reality, economic pain is needed to reduce the pricing pressures. Thus, while I've stated it several times, if Powell chooses the Burns' path, the culminating recession will be much worse than if he chooses the Volcker path.
Fade the Squeeze
With gold, silver, and mining stocks rallying on Aug. 8, you may be a little unsettled by the recent price action. However, it’s important to understand the drivers of the move, and why the optimism is unlikely to last. To explain, I wrote on Aug. 5:
While the financial markets have turned back the clock to the summer of 2020, the fundamental environment couldn’t be more different. Moreover, with gold, silver, and mining stocks benefiting from the speculative fervor, fighting inflation should prove more challenging than investors realize (…). Michael Burry – who is famous for shorting the housing market in 2008 – highlighted retail investors’ renewed “Silliness” on Aug. 4.
Please see below:
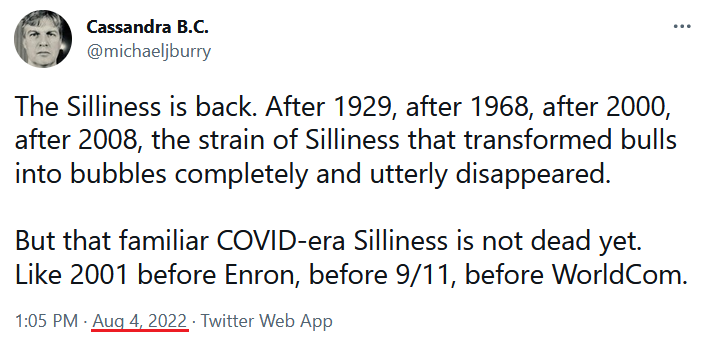
Therefore, with the “Silliness” continuing on Aug. 8, the rising tide helped uplift the PMs.
Please see below:
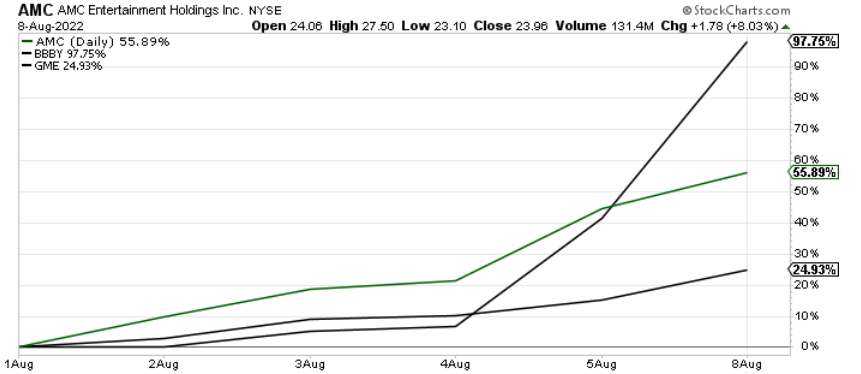
To explain, the green and black lines above track the one-week performances of meme stocks like GameStop. AMC and Bed Bath & Beyond. As you can see, the latter has soared by nearly 100% as the bubble buyers reasserted themselves.
Likewise, Goldman Sachs’ basket of the most-shorted stocks has risen for nine straight days, matching the longest winning streak on record.
Please see below:
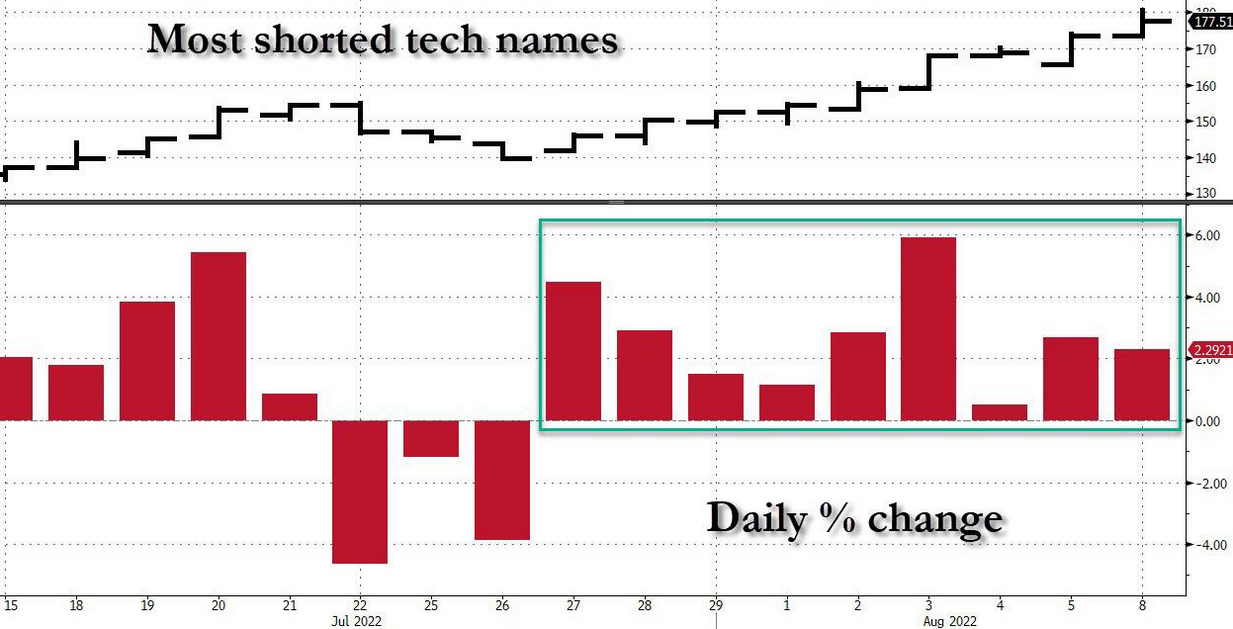 Source: Bloomberg/ZeroHedge
To explain, the red bars on the right side of the chart above highlight how the short squeeze has intensified as the most speculative U.S. stocks make a comeback.
Furthermore, retail’s gain has been hedge funds’ pain.
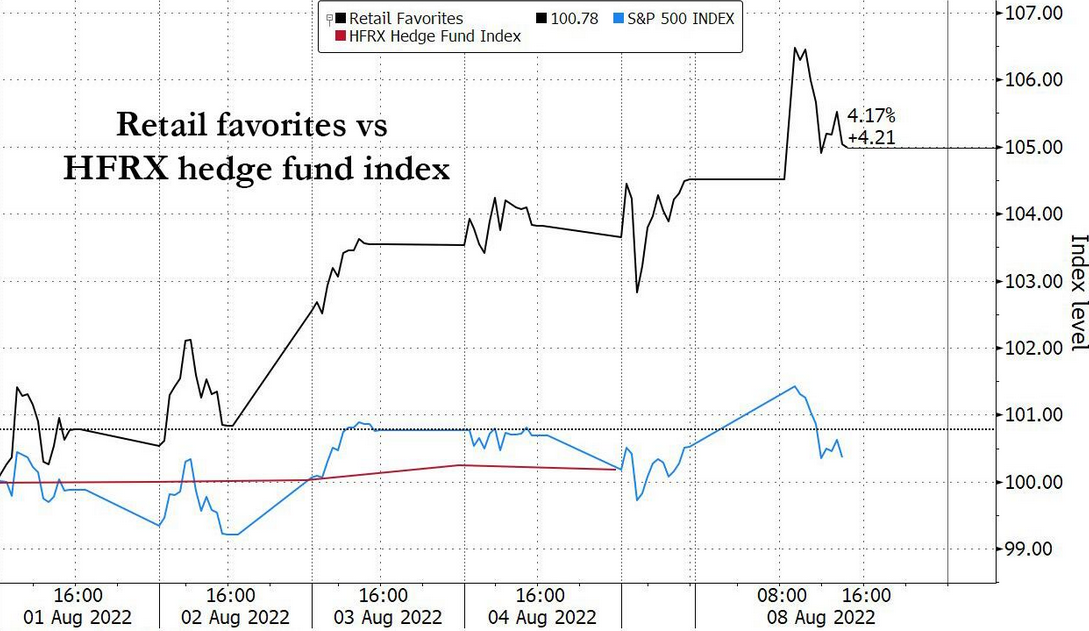 Source: Bloomberg/ZeroHedge
To explain, the black line above tracks an index of retail investors’ favorite stocks, while the blue line above tracks the HFRX hedge fund index. If you analyze the relationship, you can see that the spiking retail basket has led to mixed performance as hedge funds scramble to unwind their short positions.
As a result, the above developments are the main drivers of the PMs’ recent strength. However, as 2021 showed, gravity is undefeated, and the gains are unlikely to hold.
The Bottom Line
Investors live on a faulty foundation of “this time is different.” First, inflation was a supply-side phenomenon. Then, it was broadening but still “transitory.” Now, we’ve reached neutrality and rate cuts can commence in 2023. However, the prospect is ridiculous, and while history highlights the catastrophic pitfalls of dismissing inflation, the consensus doesn’t learn from their mistakes. Moreover, with a meme stock like Bed Bath & Beyond nearly doubling in a week, does it seem like we’re anywhere near neutral?
In conclusion, the PMs rallied on Aug. 8, as the speculative frenzy continued. However, short squeezes were part of the PMs’ journeys to lower lows in 2021 and 2022, and this time should be no different. Therefore, it’s prudent to focus on the big picture and ignore the day-to-day noise.
Thank you for reading our free analysis today. Please note that the above is just a small fraction of the full analyses that our subscribers enjoy on a regular basis. They include multiple premium details such as the interim targets for gold and mining stocks that could be reached in the next few weeks. We invite you to subscribe now and read today’s issue right away.
Sincerely,
Przemyslaw Radomski, CFA
Founder, Editor-in-chief


Gold Investment News
Delivered To Your Inbox
Free Of Charge
Bonus: A week of free access to Gold & Silver StockPickers.
Gold Alerts
More-
Status
New 2024 Lows in Miners, New Highs in The USD Index
January 17, 2024, 12:19 PM -
Status
Soaring USD is SO Unsurprising – And SO Full of Implications
January 16, 2024, 8:40 AM -
Status
Rare Opportunity in Rare Earth Minerals?
January 15, 2024, 2:06 PM

