
tools spotlight

-
After Powell’s Decision, the Outlook for Gold Remains Bearish
June 16, 2022, 8:08 AMThe FOMC's interest rate hike by 75 basis points to fight inflation became a fact. What do the Fed's hawkish actions and plans mean for the gold market?
Another Squeeze, Don’t Panic
With the FOMC increasing interest rates by 75 basis points on Jun. 15, inflation has officially forced the Fed’s hand. Moreover, with the latest rise expanding the count to six rate hikes in 2022 (25 basis point increments), the tally puts us on recession watch.
However, with the PMs (and most assets) rallying during Chairman Jerome Powell’s press conference, I warned earlier in the day that a short squeeze could materialize. For context, it wasn’t a prediction. I simply noted that extremely bearish positioning could lead to a reversion. I wrote:
With the recent carnage across the financial markets rattling the bulls, sentiment and positioning are extremely stretched. Therefore, while a ‘sell the rumor, buy the news’ event may unfold, it’s prudent to stay focused on the S&P 500 and the GDXJ ETF’s medium-term downtrends.
The liquidation frenzy (margin calls) that erupted recently coincided with hedge funds going on the largest two-day selling spree on record. If you analyze the chart below, you can see that Goldman Sachs’ prime brokerage data shows the z-score of combined net dollars sold on Jun. 10 and Jun. 13 exceeded the sell-off following the collapse of Lehman Brothers in 2008.
Thus, while it’s far from a sure thing, it’s prudent to note how these variables may impact the short-term price action.
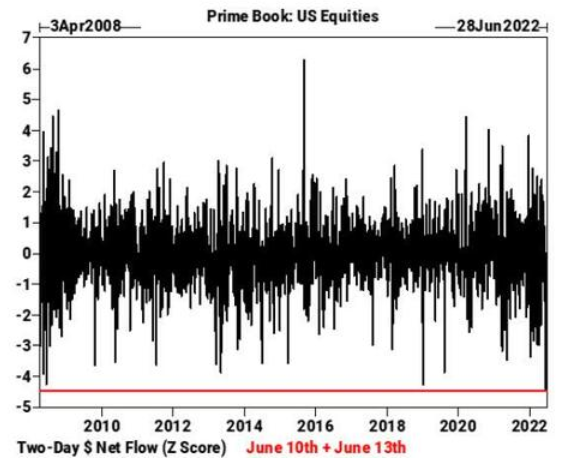 Source: Goldman Sachs
As such, while the PMs enjoyed daily relief rallies, hedge funds’ cumulative net flows on Jun. 10 and Jun. 13 were more than four standard deviations below the average. Therefore, we’ve seen several short squeezes before, and they haven’t impacted the PMs’ medium-term trajectories.
The FOMC Statement and the June SEP
As mentioned, the FOMC increased interest rates by 75 basis points on Jun. 15. The release read:
“The Committee seeks to achieve maximum employment and inflation at the rate of 2 percent over the longer run. In support of these goals, the Committee decided to raise the target range for the federal funds rate to 1‑1/2 to 1-3/4 percent and anticipates that ongoing increases in the target range will be appropriate. In addition, the Committee will continue reducing its holdings of Treasury securities and agency debt and agency mortgage-backed securities, as described in the Plans for Reducing the Size of the Federal Reserve's Balance Sheet that were issued in May.”
More importantly, the FOMC released its June Summary of Economic Projections (SEP).
Please see below:
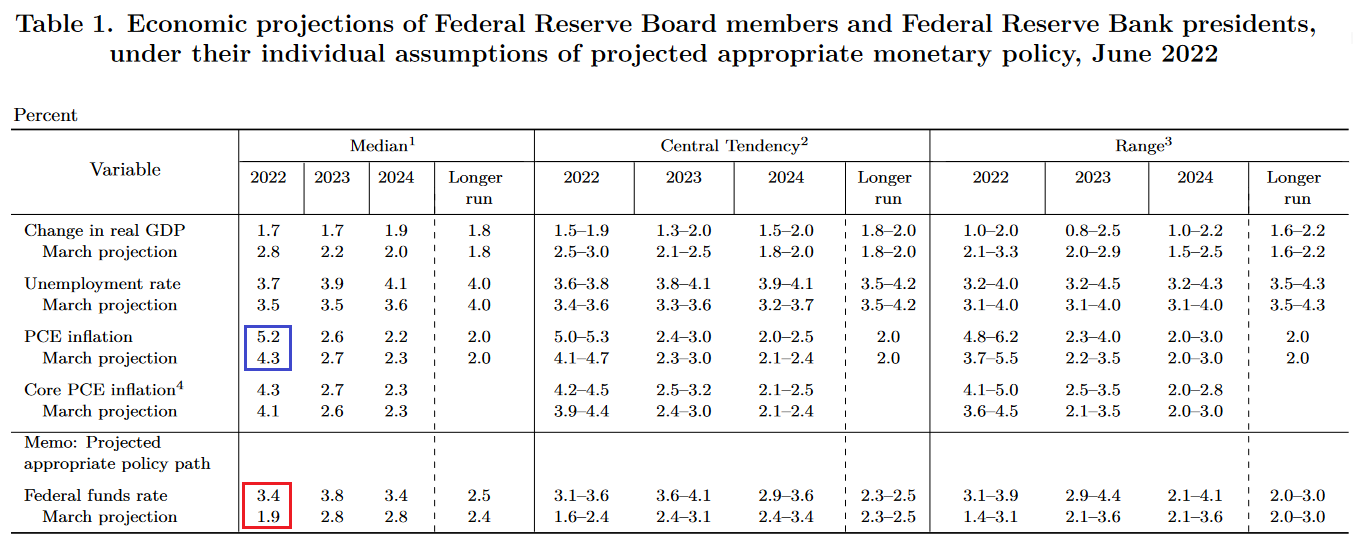 Source: U.S. Fed
To explain, the FOMC provides its economic forecasts every second meeting. If you analyze the blue box above, you can see that officials increased their median Personal Consumption Expenditures (PCE) index projection from 4.3% year-over-year (YoY) in March to 5.2% YoY in June. As a result, inflationary realities have proven forceful once again.
Furthermore, the red box at the bottom of the chart shows that officials’ median U.S. federal funds rate projection increased from 1.9% in March to 3.4% in May. Therefore, FOMC participants expect nearly 14 rate hikes in 2022.
For context, I have been bullish on the U.S. economy for a while and expected a much more hawkish Fed policy than the consensus. However, it’s a near certainty the U.S. will enter a recession as these rate hikes unfold.
Also noteworthy, officials’ median real GDP projection was cut from 2.8% in March to 1.7% in June. Moreover, I’ve long warned the Fed has to hike rates to contain inflation, and patience will only worsen the situation.
Yet, here we are. FOMC officials increased their inflation estimate and lowered their growth estimate, which has the mix going in the wrong direction. In addition, waiting only exasperates the ominous divergence. As such, that’s why I warned on Jun. 7 that hiking interest rates is the lesser of two evils. I wrote:
The Fed finds itself in a catch-22. Curbing inflation should lead to a recession, as nearly all bouts of unanchored inflation have ended with an economic downturn over the last ~70 years. Likewise, waiting for inflation to subside on its own would result in even more suffering.
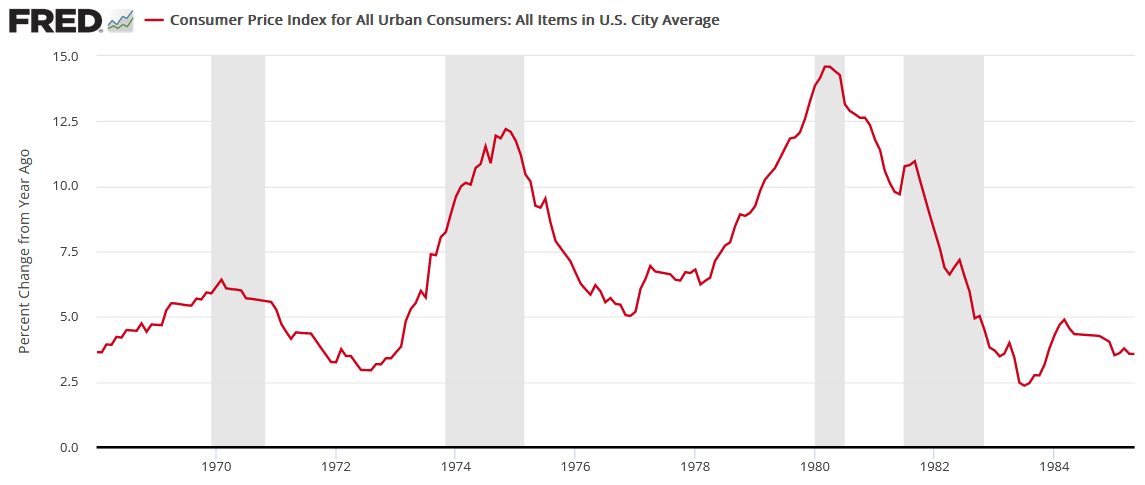
To explain, I noted above that unanchored inflation in the 1970s/1980s pushed the U.S. into recession four times over ~12 years. As such, that’s roughly one recession every three years. Conversely, stable inflation often coincides with a recession roughly every eight to 10 years.
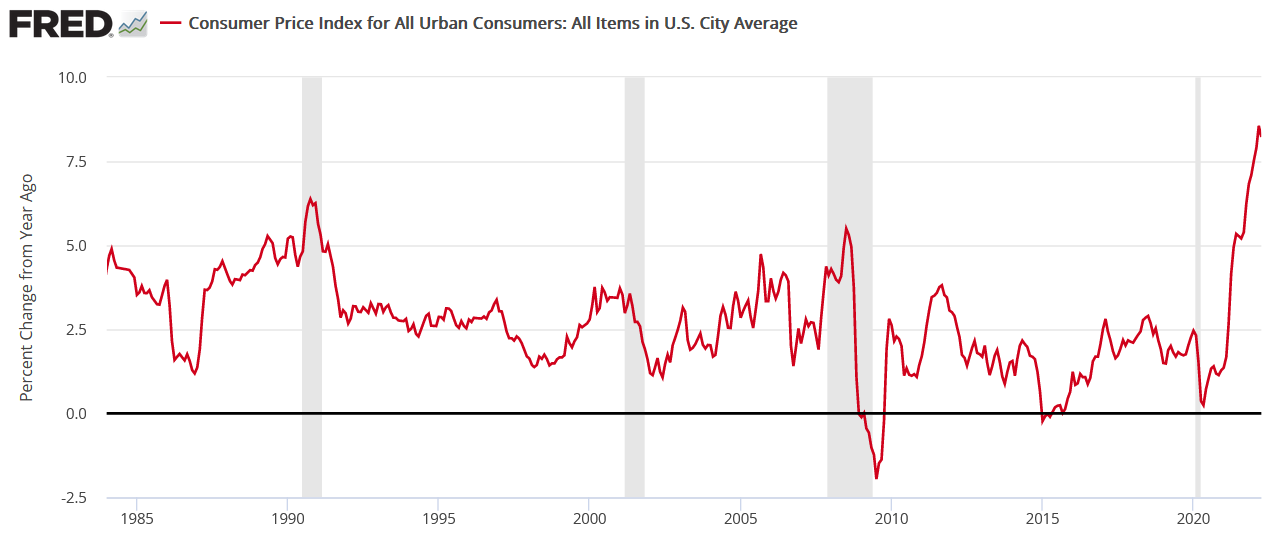
Moreover, the chart below highlights how all of the post-1970/1980 recessions coincided with rising inflation (except for COVID-19). Thus, with the current inflation rate much higher than any of those periods and more similar to the 1970/1980s, the Fed and the BoC should know that the smaller and less frequent recessions below are preferable to the larger and more frequent recessions above. As a result, the post-GFC crowd suffers from recency bias, and fails to understand these economic challenges.
The Balancing Act
While the fundamentals of the FOMC’s SEP and the potential for ~14 rate hikes are extremely hawkish, Powell was relatively dovish during his press conference. Moreover, this statement near the beginning helped light a fire under risk assets.
“Clearly today’s 75 basis point increase is an unusually large one, and I do not expect moves of this size to be common,” Powell said. “From the perspective of today, either a 50-basis-point or a 75-basis-point increase seems most likely at our next meeting.”
Therefore, while another 50 or 75 basis point hike in July is profoundly hawkish, Powell puts to rest fears of panic-like 1% or more increases. As a result, it was enough to uplift sentiment.
In addition, Powell added:
“As mentioned, 75 basis points today and the next meeting could well be about a decision between 50 and 75; that would put us at the end of the July meeting in a more normal range and that’s a desirable place to be because you begin to have more optionality about the speed with which you proceed going forward.”
Thus, the statement also increases hope that the Fed could pause and reassess its outlook after the July meeting. Therefore, it assuages investors’ fears of a swift hiking cycle on autopilot.
However, after the sharp sell-offs across bonds and equities recently, it’s reasonable that Powell would attempt to calm the situation. While he helped to uplift daily sentiment, the realities of unanchored inflation and ~14 rate hikes will be much more important over the medium term.
For example, Powell said:
“The federal funds rate, even after this move, is at 1.6%. The committee is moving rates up expeditiously to more normal levels, and we came to the view that we’d like to do a little more front-end loading on that.”
He added:
“Committee participants widely would like to see policy at a modestly restrictive level at the end of this year” and “that is generally 3% to 3.5%.”
However, the most important quote of the press conference occurred when Powell was asked: does 3.8%-4% [federal funds rate] get the job done and break the back of inflation?
He responded:
“I think we’ll know when we get there. You would have positive real rates and inflation coming down. I think you would have positive real rates across the curve.”
Thus, Powell confirmed what I’ve been warning about for months: the Fed needs higher real yields to curb inflation. Moreover, while beneficiaries of lower real interest rates like Bitcoin, the ARK Innovation ETF, and the GDXJ ETF have suffered in 2022, I warned on Dec. 23, 2021 that the liquidity drain would take no prisoners. I wrote:
Please note that when the Fed called inflation “transitory,” I wrote for months that officials were misreading the data. As a result, I don’t have a horse in this race. However, now, they likely have it right. Thus, if investors assume that the Fed won’t tighten, their bets will likely go bust in 2022.
Finally, Powell also made my point about how further patience will only intensify inflation and exacerbate the stagflationary cocktail. For context, this was the second most important quote of the press conference. Powell said:
“The worst mistake we could make would be to fail. It’s not an option. We have to restore price stability. It’s the bedrock of the economy. If you don’t have price stability, the economy is really not going to work the way it’s supposed to. It won’t work for people. Their wages will be eaten up. So we want to get the job done.”
As a result, while Powell softened his overall tone to reduce the panic across the financial markets, the fundamentals of the day were clear:
- The FOMC increased its median rate hike projection to ~14 in 2022.
- Powell wants higher real interest rates.
- Letting inflation rage is “not an option.”
- The FOMC “widely” wants “a modestly restrictive” policy by the end of 2022.
Therefore, while I’ve stated this many times throughout 2021 and 2022, the PMs’ medium-term fundamental outlooks continue to worsen.
The Bottom Line
While Powell sounded relatively dovish, actions speak louder than words. Moreover, with six rate hikes on the books and another 50 to 75 basis point increase scheduled for July, that would take us to eight or nine 25 basis point rate hikes in 2022. In addition, with FOMC officials’ median estimate for the U.S. federal funds rate nearly doubling from 1.9% to 3.4%, the liquidity drain should occur even faster than expected a few months ago. As a result, the developments are profoundly bearish for the S&P 500 and the PMs.
Furthermore, while the USD Index and U.S. Treasury nominal and real yields declined on Jun. 15, we’ve seen this movie before. Investors often sell the news after strong rallies. Yet, all three keep climbing as the fundamental realities commence. Thus, this time should be no different.
In conclusion, the PMs rallied on Jun. 15, as Jay saved the day. However, their bearish medium-term fundamentals intensified. As such, while sentiment ruled the day, the optimism should evaporate in the coming weeks and months.
Thank you for reading our free analysis today. Please note that the above is just a small fraction of the full analyses that our subscribers enjoy on a regular basis. They include multiple premium details such as the interim targets for gold and mining stocks that could be reached in the next few weeks. We invite you to subscribe now and read today’s issue right away.
Sincerely,
Przemyslaw Radomski, CFA
Founder, Editor-in-chief -
How Will the Fed’s Hawkish Announcement Affect Gold Stocks?
June 15, 2022, 5:06 AMIn yesterday’s analysis, I wrote about how the current situation is similar to what happened in 2008 and what we can learn from that. Today, after another increase in our profits, I’d like to show you that there are quite a few fundamental similarities to 2008, which only increases the importance of my yesterday’s comments.
Tick-Tock
It’s decision day for the FOMC, as a 50 or 75 basis point rate hike is likely a done deal. Moreover, with the U.S. economic clock counting down the seconds until a recession, the Fed’s rate hike cycle should be the straw that breaks the camel’s back. To that point, with interest rates rising rapidly in recent days, the medium-term effects should be profound.
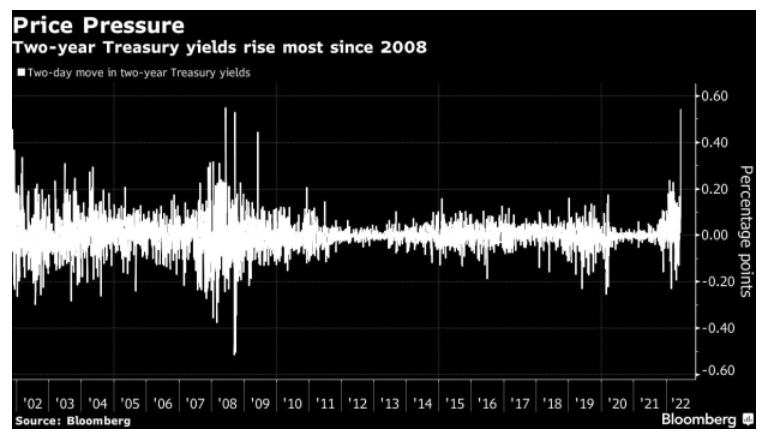
For example, the U.S. 2-Year Treasury yield rallied by 54 basis points combined on Jun. 10 and Jun. 13 – the largest two-day increase since 2008 (the white bar on the right side of the chart below). As a result, panic percolated throughout the bond market.
Please see below:
Likewise, the drama continued on Jun. 14, as U.S. Treasury yields increased across the board. Thus, investors have taken front-running the Fed to a whole new level.
Please see below:
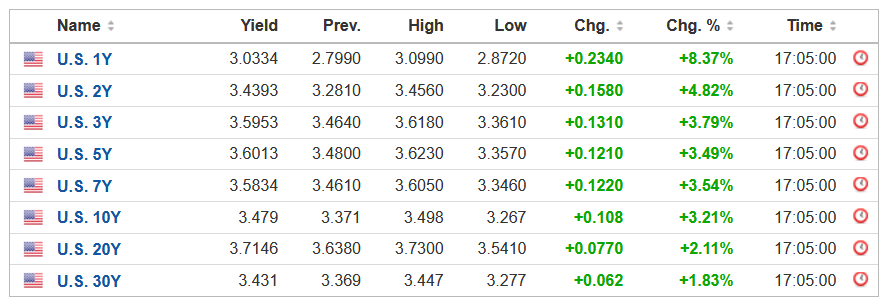 Source: Investing.com
Furthermore, the U.S. 10-Year Treasury yield continued its ascent, and I warned on Apr. 20 that more carnage would unfold. I wrote:
Plenty of technical damage has been done, and the data could be used to support higher bond prices and lower long-term interest rates. However, even if oversold conditions elicit a short-term rally, the medium-term fundamentals remain intact.
Please see below:
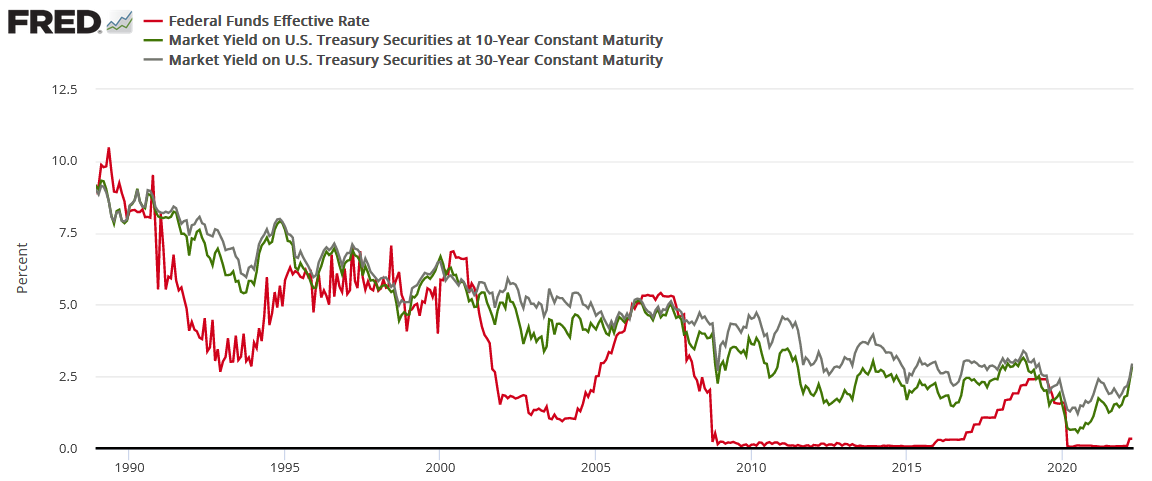
To explain, the red line above tracks the U.S. federal funds rate, while the green and gray lines above track the U.S. 10-Year and 30-Year Treasury yields. If you analyze the connection, you can see that the latter two often take their orders from the former. In a nutshell: when the Fed raises interest rates, it takes several hikes of 0.25% before long-term yields rollover. For example:
- In 2018, the U.S. 10-Year Treasury yield peaked after ~9 rate hikes.
- In 2006, the U.S. 10-Year Treasury yield peaked after ~17 rate hikes.
- In 2000, the U.S. 10-Year Treasury yield peaked after ~7 rate hikes.
- In 1994, the U.S. 10-Year Treasury yield peaked after ~12 rate hikes.
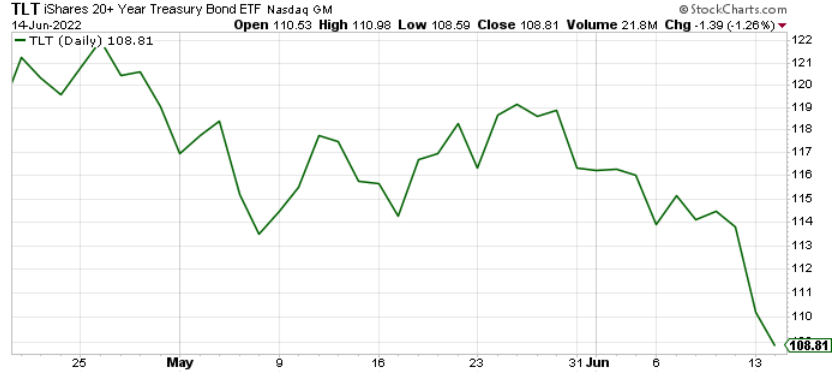
For context, I'm prioritizing the U.S. 10-Year Treasury yield because its real yield is what we use to value gold. However, if you focus your attention on the red and gray lines above, you can see that the 10-and-30-year nominal yields have a tight relationship. As a result, it's an ominous medium-term sign for TLT.
Thus, with modern history showcasing that the U.S. 10-Year Treasury yield doesn't peak until the Fed is well within its rate hike cycle, please remember that the Fed has only hiked once. Therefore, with seven rate hikes as the minimum to elicit a peak over the last ~28 years, the U.S. 10-Year Treasury yield should have room to run, and this is bullish for real yields and bearish for gold.
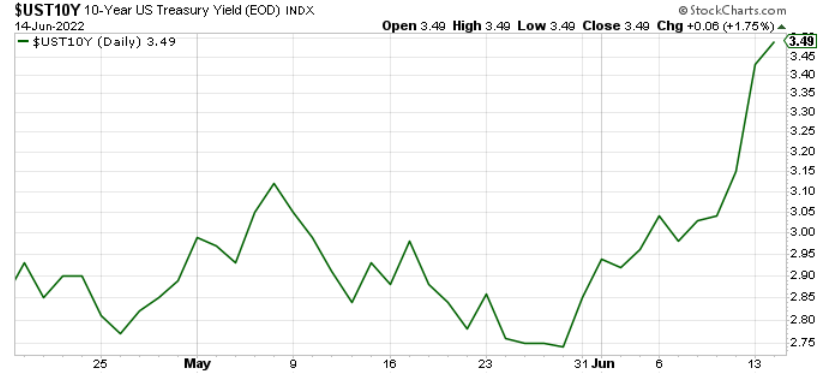
As such, with the prediction proving prescient, the Treasury benchmark has behaved as expected.
Please see below:
In addition, TLT has gone in the opposite direction:
More importantly, the U.S. 10-Year breakeven inflation rate has also suffered amid the hawkish re-pricings, ending the Jun. 14 session at 2.60%.
Please see below:
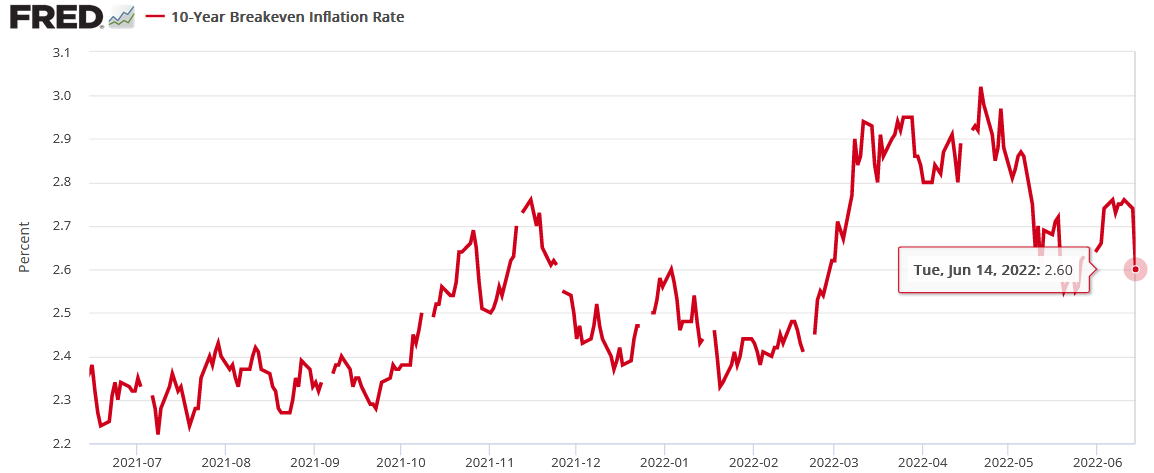
Therefore, the U.S. 10-Year real yield hit another 2022 high of 0.89%, and the PMs’ medium-term fundamental outlooks remain profoundly bearish.
Also, the tremors in the bond market matter because they spread throughout the real economy. Thus, the implications of higher interest rates should help underwrite the next U.S. recession. Case in point: Mortgage News Daily reported on Jun. 14 that the 30-year fixed mortgage rate “moved above 6% yesterday for the first time since 2008.”
Moreover: “Today was just an addendum by comparison, but an unpleasant one in which rates moved even higher into the 6% range” the report stated. “The average lender is quoting top tier 30-yr fixed rates in the 6.25-6.375% range.”
Please see below:
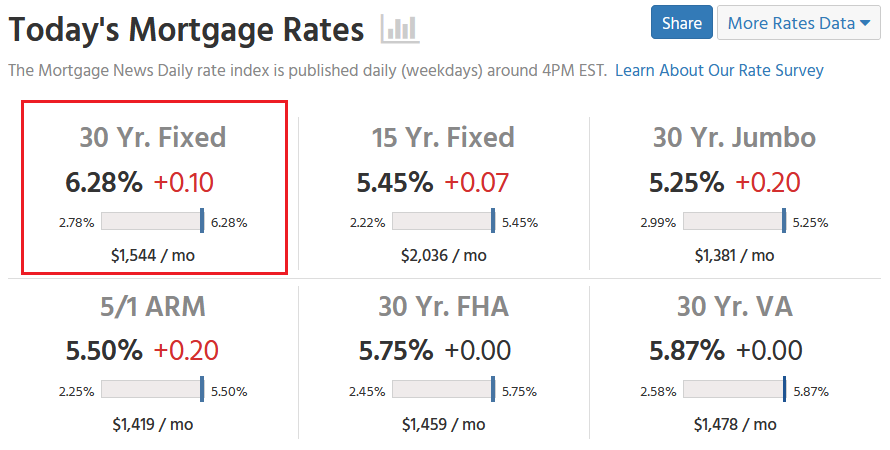 Source: Mortgage News Daily
In addition:
“The fate of the current trend will be determined by the Fed tomorrow – at least in the short term. There are several avenues through which the Fed could surprise the market, but it's worth noting that some of those surprises could be good for rates as well. Either way, expect a substantial amount of volatility tomorrow afternoon starting at 2pm.”
Inflation and More Inflation
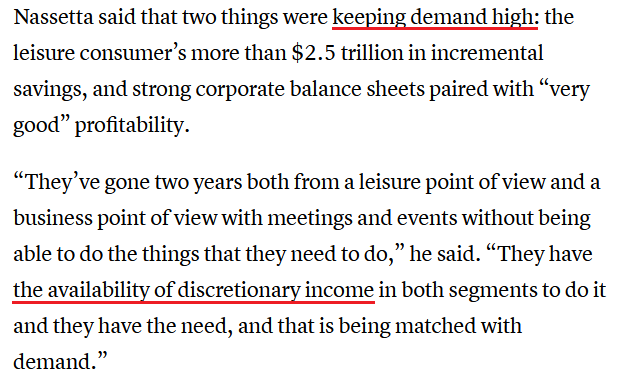
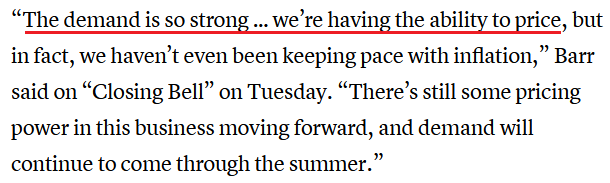
While I’ve been warning for months that inflation would showcase its might, investors have awoken to the harsh realities. Moreover, Hilton CEO Chris Nassetta said on Jun. 9 that the hotel chain will “have the biggest summer we’ve ever seen in our 103-year history this summer.”
“The price has gone up for everything, so we’re not different than when you go to a gas pump or the grocery store or any other aspect of life; it’s discretionary.”
Moreover, while I warned on numerous occasions that U.S. consumers were in better shape than many predicted, Nassetta noted that demand for accommodations is fueling the price increases.
Please see below:
 Source: CNBC
Likewise, Marriott CEO Tony Capuano added that over Memorial Day weekend the company’s revenue per available room increased by ~25% versus 2019. “I think as long as we’re delivering on service, which can be challenged in markets where labor is difficult, we continue to see really remarkable pricing,” he said.
Making three of a kind, IHG Hotels & Resorts CEO Keith Barr said robust demand should fuel more price increases in the summer months.
Please see below:
 Source: CNBC
Therefore, while I continuously warned that market participants underestimated the demand side of the equation, they’re waking up to the reality that inflation won’t abate on its own. As a result, the ball is in the Fed’s court, and we know how it usually ends.
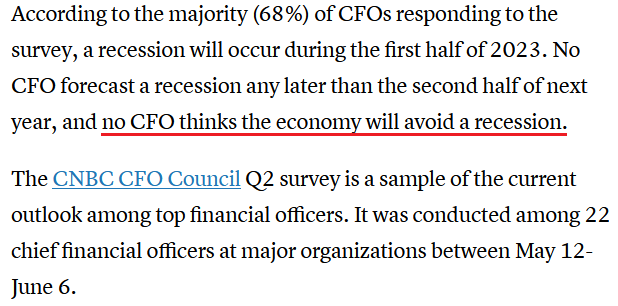
To that point, CNBC released its CFO Council Survey on Jun. 9. An excerpt read:
“Over 40% of chief financial officers cite inflation as the No. 1 external risk to their business” and “almost one-quarter (23%) of CFOs cite Federal Reserve policy as the biggest risk factor.”
As a result, our analysis is now the consensus.
Please see below:
 Source: CNBC
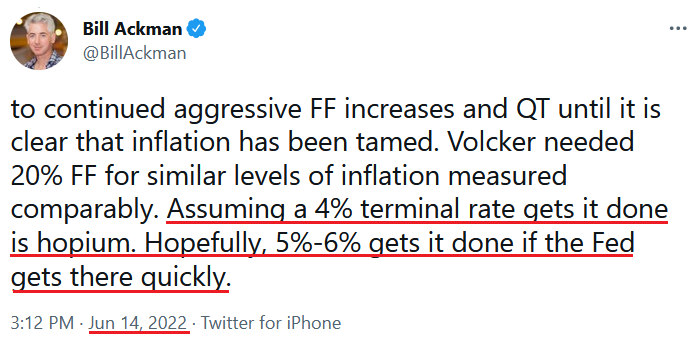
On top of that, I noted previously that billionaire hedge fund manager Bill Ackman shares our view of how demand destruction eventually cools inflation. In a nutshell: the Fed must do the heavy lifting, as patience will only embolden commodity investors and exacerbate the inflationary spiral.
Furthermore, Ackman added on Jun. 14 that “The [Fed] has allowed inflation to get out of control. Equity and credit markets have therefore lost confidence in the Fed. Market confidence can be restored if the Fed takes aggressive action with 75 bps tomorrow and in July, and a commitment to continued aggressive [federal funds rate] FF increases and QT until it is clear that inflation has been tamed.”
As a result, while I’ve long warned that nearly 70 years of data shows the U.S. federal funds rate needs to rise above the year-over-year (YoY) percentage change in the headline Consumer Price Index (CPI) to curb inflation, Ackman expects a similar outcome.
A Potential Short Squeeze
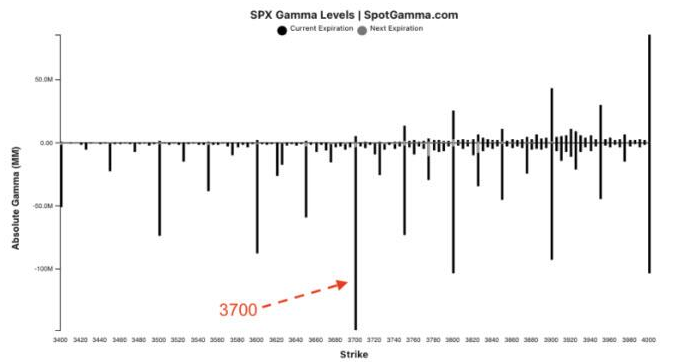
With the recent carnage across the financial markets rattling the bulls, sentiment and positioning are extremely stretched. Therefore, while a ‘sell the rumor, buy the news’ event may unfold, it’s prudent to stay focused on the S&P 500 and the GDXJ ETF’s medium-term downtrends.
For example, a heavy dose of S&P 500 put options expire on Jun. 17, and dealers may want to push the market higher to avoid paying out. Moreover, SpotGamma notes that 3,700+ is where most strike prices land, so a short-term squeeze reduces dealers’ potential losses.
Please see below:
Second, Nomura's Cross-Asset Macro Strategist Charlie McElligott noted that CTAs (quite often quant investors) have estimated net-short positions near the low-end of the historical range. As a result, the algorithms could cover and fuel a short-term spike.
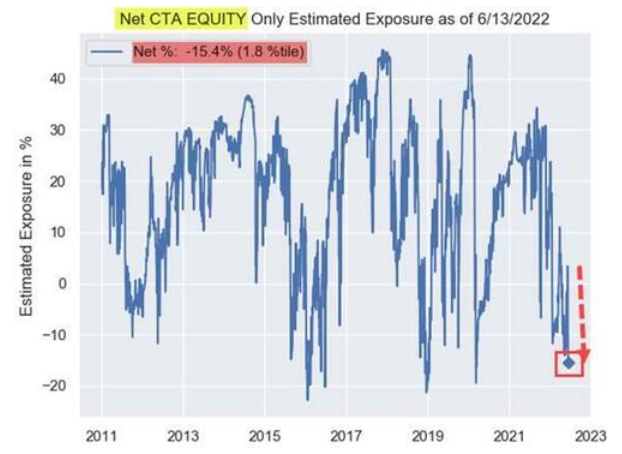 Source: Nomura
Finally, the liquidation frenzy (margin calls) that erupted recently coincided with hedge funds going on the largest two-day selling spree on record. If you analyze the chart below, you can see that Goldman Sachs’ prime brokerage data shows the z-score of combined net dollars sold on Jun. 10 and Jun. 13 exceeded the sell-off following the collapse of Lehman Brothers in 2008.
Thus, while it’s far from a sure thing, it’s prudent to note how these variables may impact the short-term price action.
Source: Goldman SachsThe Bottom Line
Volatile moves in interest rates have the potential to turn day into night. Moreover, when earthquakes cause sharp swings in asset prices and mortgage rates, we move closer to a U.S. recession. Therefore, while liquidations alone are profoundly bearish for the PMs, the U.S. 10-Year real yield has become unhinged, and the USD Index is gunning for new 2022 highs. As such, storm clouds are growing darker by the day.
In conclusion, the PMs declined on Jun. 14, and the GDXJ ETF underperformed once again (and profits on our short positions increased once again). Moreover, while positioning and sentiment may elicit a short-term relief rally, Fed Chairman Jerome Powell could channel a more hawkish tone and create the opposite. Either way, while the day-to-day is extremely difficult to predict, the S&P 500 and the PMs should confront lower prices in the months ahead.
Thank you for reading our free analysis today. Please note that the above is just a small fraction of the full analyses that our subscribers enjoy on a regular basis. They include multiple premium details such as the interim targets for gold and mining stocks that could be reached in the next few weeks. We invite you to subscribe now and read today’s issue right away.
Sincerely,
Przemyslaw Radomski, CFA
Founder, Editor-in-chief -
The Gold Market Is Getting Ready for Another Interest Rate Hike
June 14, 2022, 9:33 AMAs predicted, gold stocks are gradually declining. Their situation is unlikely to improve - the Fed is already planning another interest rate hike.
After yesterday’s huge slide in the PMs (GDXJ declined by over 8%!) and a sizable increase in our short positions in junior miners, gold and silver are moving back and forth, gathering strength for the next move. Or waiting for the next trigger.
They are likely to get it tomorrow (Wednesday, June 15), as the Fed is about to make another interest rate decision. The word got out yesterday that the Fed might hike interest rates by 0.75% instead of just 0.5%, and the markets reacted accordingly. Stocks and PMs fell, while the USD Index rallied.
The best part is that you knew about the bigger rate hike before almost everyone else – I wrote about that in the extra analysis that I posted/sent out on Saturday. Quoting:
The next interest rate decision is this Wednesday, and it’s probably going to be very interesting. I wouldn’t be surprised if we saw a rate hike by more than 0.5% - for example by 0.75%. This might be enough to send a message to the market that they are serious about the inflation and have positive political implications. Whether that happens or not, the following conference will likely aim to rebuild investors’ confidence in the Fed. It might or might not work with regard to confidence, but it should be enough to trigger declines in the markets (including PMs) – after all that’s how hawkish surprises work.
Okay, so, the precious metals declined significantly, and now they paused. What’s next?
Well, they might take a breather today, but since the interest rate decision is tomorrow and – in my view – a 0.75% rate hike is indeed likely along with some hawkish rhetoric, the markets might tumble even more (and the USDX would be likely to rally further).
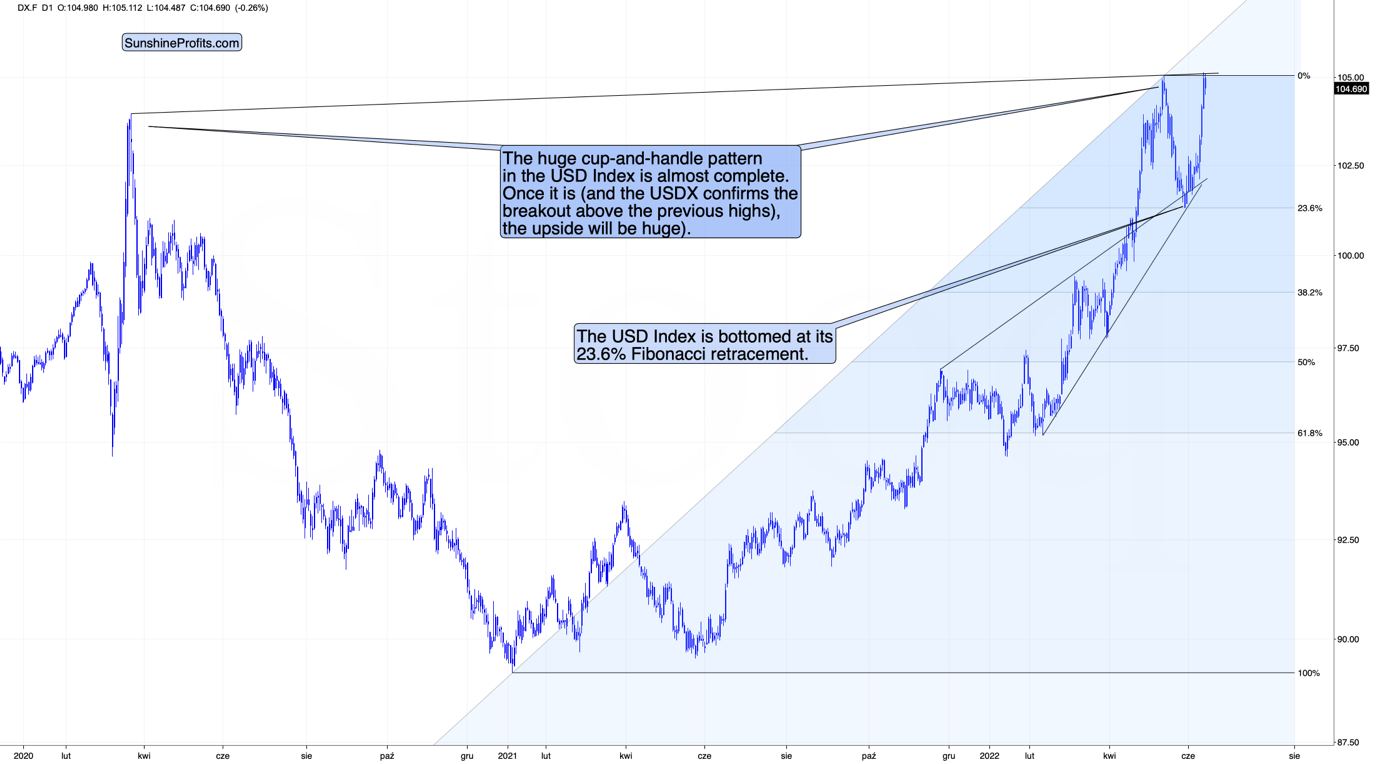
While in case of the USDX it will likely imply a breakout above the big cup-and-handle pattern, in case of the precious metals sector, it would likely open the way to another huge wave down.
In today’s analysis, however, I’d like to step back from my usual day-to-day comments (my previous thoughts on the market remain up-to-date) and feature a specific lesson from the 2008 decline that might be useful during the current slide.
To clarify, there are no guarantees that history will repeat itself, and I don’t guarantee any kind of performance, but history does tend to rhyme, so what we’ve seen so far might be a useful indication of what’s next.
First, let me emphasize that gold stocks are declining similarly to how they did in 2008.
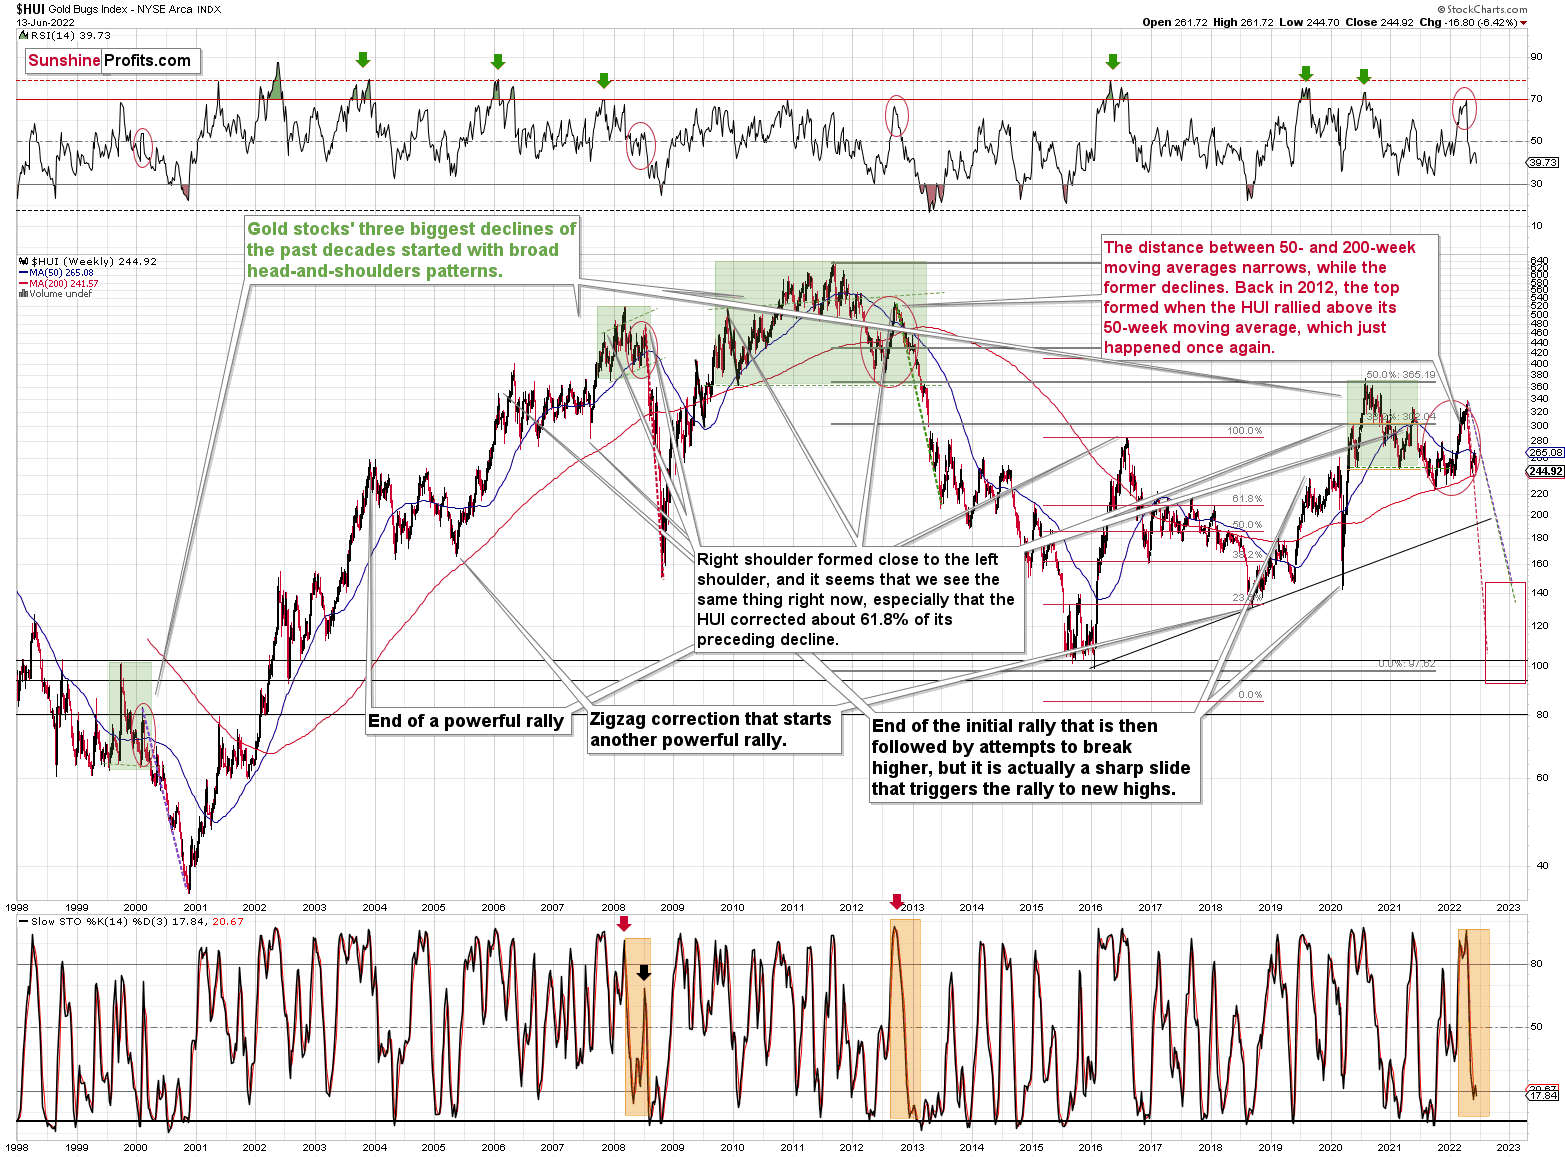
The Russian invasion triggered a rally, which was already erased, and if it wasn’t for it, the self-similarity would be very clear (note the head-and-shoulders patterns marked with green). Since the latter happened, it’s not as clear, but it seems that it’s still present. At least that’s what the pace of the current decline suggests.
I used a red dashed line to represent the 2008 decline, and copied it to the current situation. They are very similar. We even saw a corrective upswing from more or less the 200-week moving average (red line), just like what happened in 2008.
All right, let’s zoom in and see how mining stocks declined in 2008.

Back then, the GDXJ ETF was not yet trading, so I’m using the GDX ETF as a short-term proxy here.
The decline took about 3 months, and it erased about 70% of the miners’ value. The biggest part of the decline happened in the final month, though.
However, the really interesting thing about that decline – that might also be very useful this time – is that there were five very short-term declines that all took the GDX about 30% lower.
I marked those declines with red rectangles. After that, a corrective upswing started. During those corrective upswings, the GDX rallied by 14.8-41.6%. The biggest corrective upswing (where GDX rallied by 41.6%) was triggered by a huge rally in gold, and since I don’t expect to see anything similar this year, it could be the case that this correction size is an outlier. Not paying attention to the outlier, we get corrections of between 14.8% and 25.1%.
The interesting thing was that each corrective upswing was shorter (faster) than the preceding one.
The first one took 12 trading days. The second one took seven trading days. The third one took 2 trading days, and the fourth and final one took just 1 trading day.
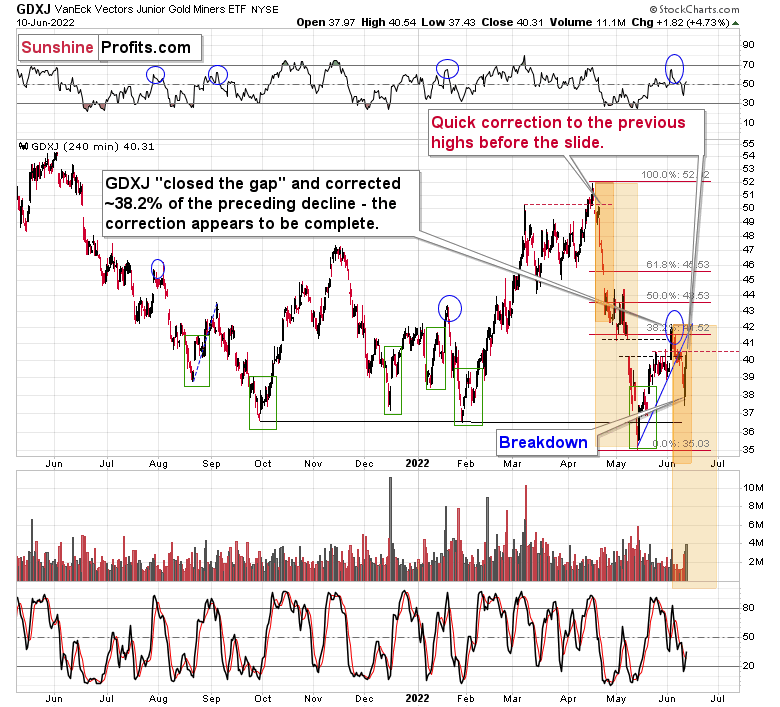
Fast forward to the current situation. Let’s take a look at the GDXJ ETF.
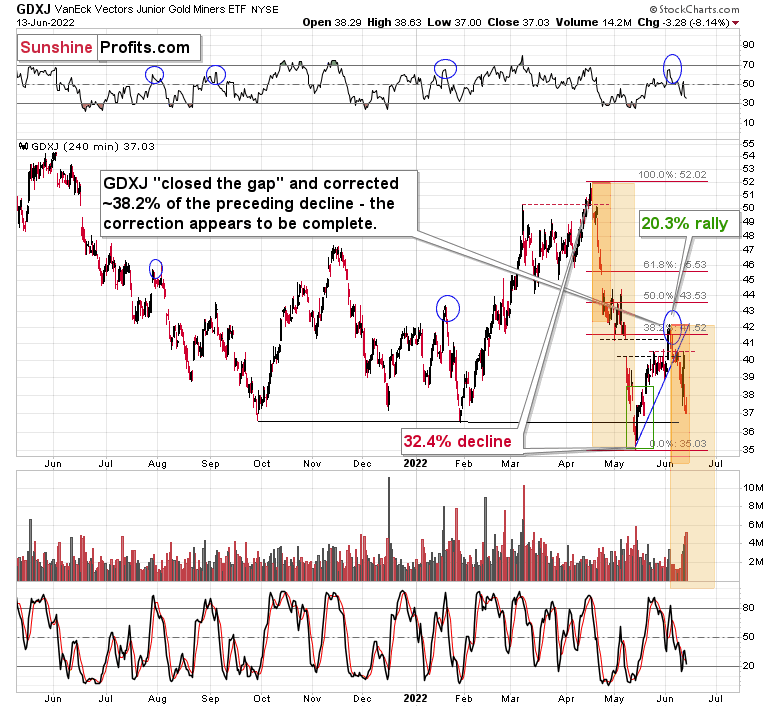
The GDXJ ETF declined by 32.4% and then corrected – it rallied by about 20.3%. The corrective upswing took 14 trading days.
The above is in perfect tune with the previous patterns seen in the GDX during the 2008 slide.
What does it tell us? It indicates that history can be rhymed, and while it will not be identical, we should pay attention to the indicators that worked in 2008. The next corrective upswing (a notable one, that is) might start when the GDXJ ETF declines by about 29-35% from its recent top. To clarify, I don’t claim that the above technique would be able to detect all corrective upswings, or that I aim to trade all of them. For instance, in my view, it was a good idea to enter a long position on May 12 and switch to a short position on May 26, but I wasn’t aiming to catch the intraday moves.
GDXJ could also decline a bit more than 29-35%, as let’s keep in mind that previous statistics are based on the GDX ETF and we are discussing the GDXJ here, and the latter is likely to decline even more than GDX as juniors are more correlated with the general stock market (and the latter is likely to slide).
So, let’s say that the GDXJ might decline between 29% and 40% from the recent high before triggering another notable corrective upswing (one that could take between 5 and 10 trading days based on how long the last one took and how big those corrections were in 2008).
The recent high was formed with the GDXJ ETF at $42.19. Applying the above-mentioned percentages to this price provides us with $24.78-29.32.
Now, is there any meaningful support level in this area that could stop the decline?
Yes!
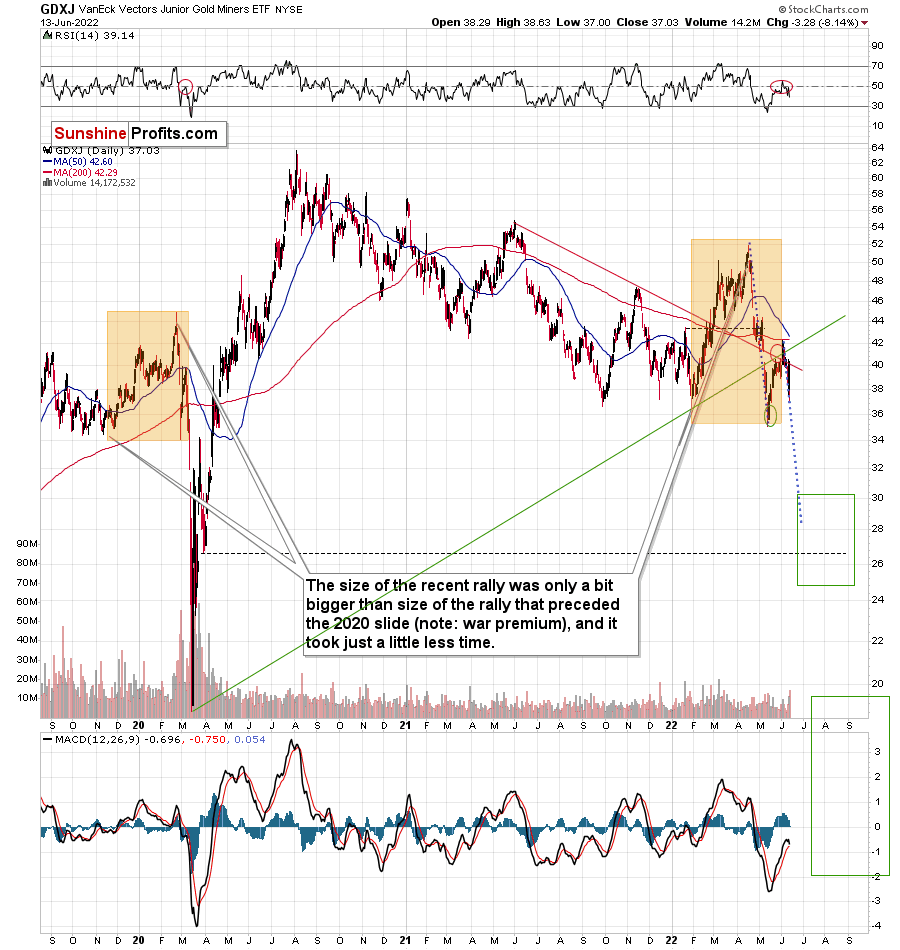
The late-March 2020 low is at $26.62, and it provides significant short-term support within the analogy-based target area.
Additionally, the above corresponds – more or less – to the size of the decline that would match the size of the April-May decline. It would be only somewhat bigger.
Let’s keep in mind that gold stocks don’t necessarily move on their own, but rather move along with gold.
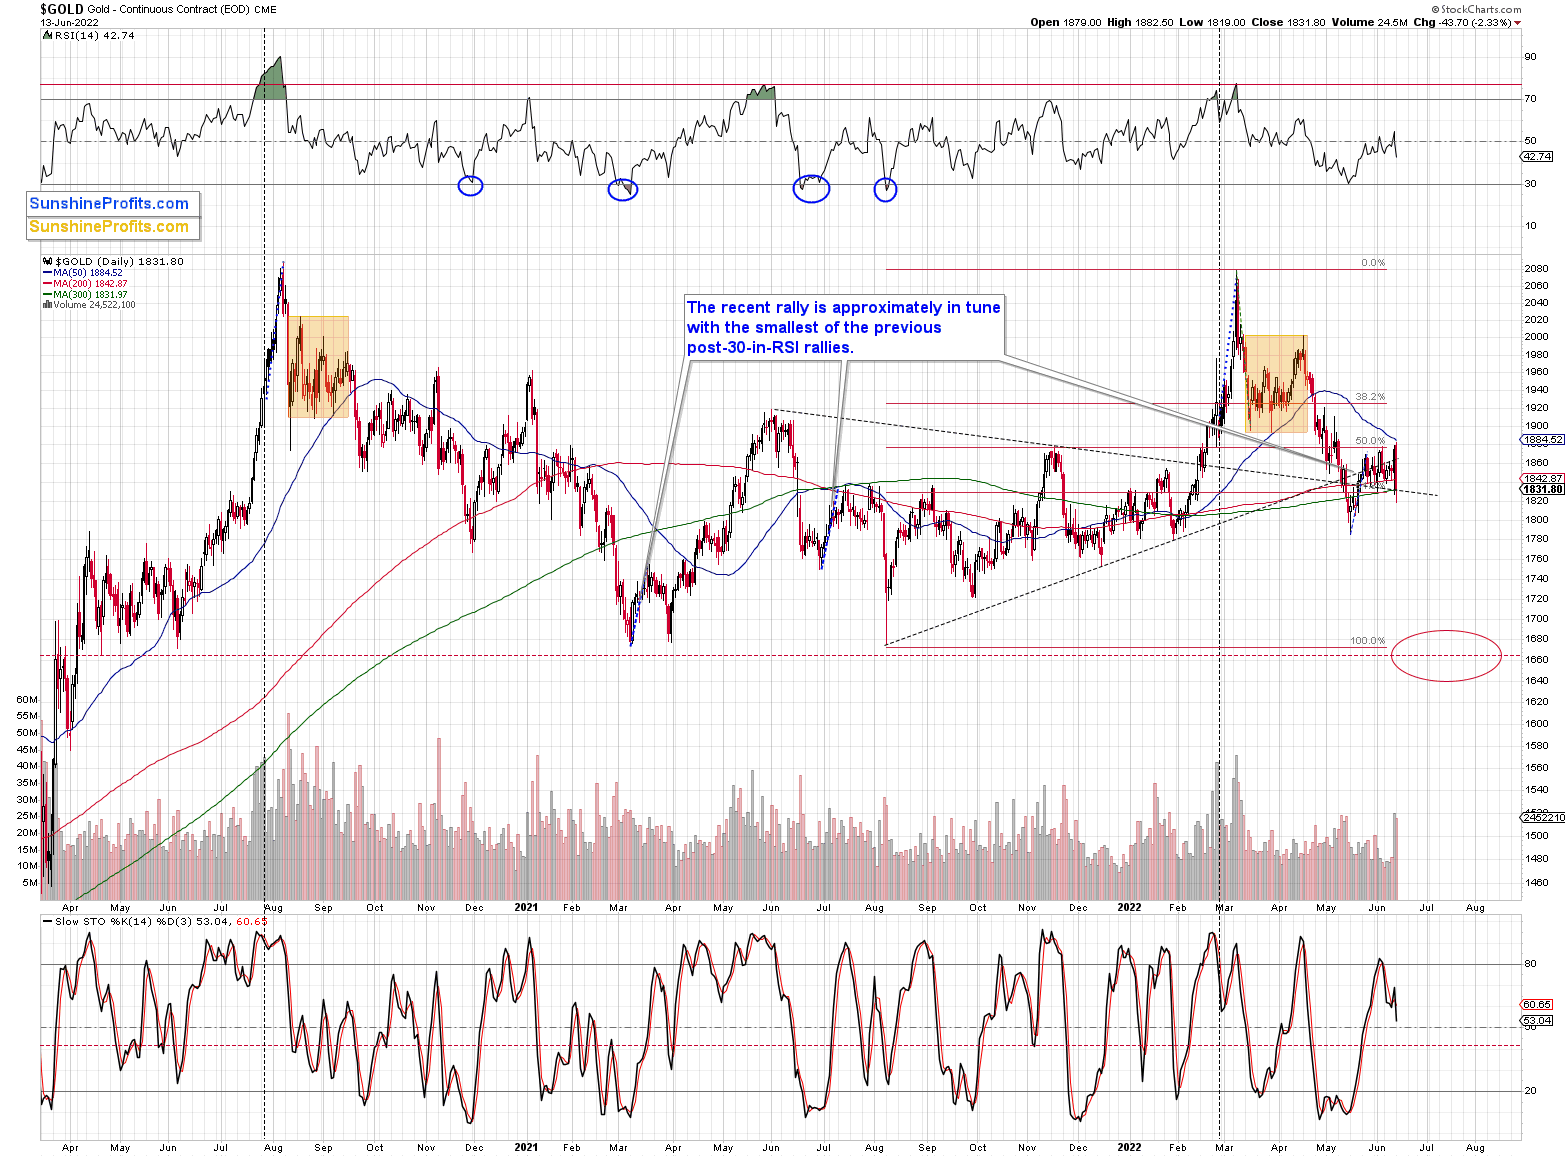
In the case of gold, a repeat of the April-May decline would imply a move to very strong support – the mid-2020 and 2021 lows. Prices below $1,700 stopped gold’s declines several times, and that would make at least a rebound likely once it’s reached that level.
Now, since the general stock market is about to slide, junior miners might be affected even more than gold, so it would make sense for one to expect them to decline somewhat more than gold (compared to what happened in April and May).
Consequently, the near-term (yes) target for the GDXJ at about $27 appears to make sense, and it seems that profits from the current short positions in the junior mining stocks will become even bigger soon.
Thank you for reading our free analysis today. Please note that the above is just a small fraction of the full analyses that our subscribers enjoy on a regular basis. They include multiple premium details such as the interim targets for gold and mining stocks that could be reached in the next few weeks. We invite you to subscribe now and read today’s issue right away.
Sincerely,
Przemyslaw Radomski, CFA
Founder, Editor-in-chief -
Are Gold Investors Ready for a Massive Dollar Rally?
June 13, 2022, 10:32 AMIn the Extra Gold & Silver Trading Alert that I sent over the weekend, I explained why Friday’s upswing was most likely unsustainable. We didn’t have to wait long for the market to agree with me.
In today’s pre-market trading, gold, silver, and stocks are down substantially, while the USD Index is up. Let’s take a closer look.
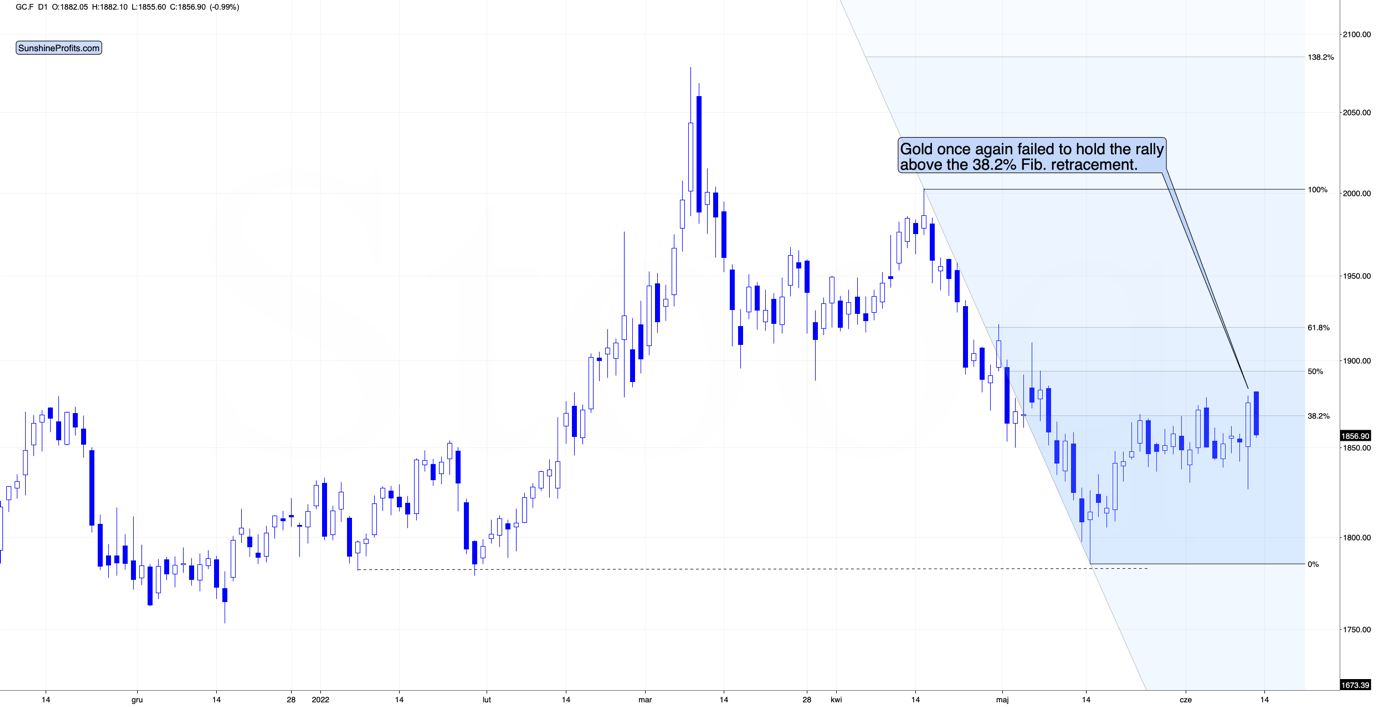
Gold declined 1% so far today and while it didn’t erase the entire Friday’s rally, it declined most of it and – most importantly – it already invalidated Friday’s attempt to break above the 38.2% Fibonacci retracement.
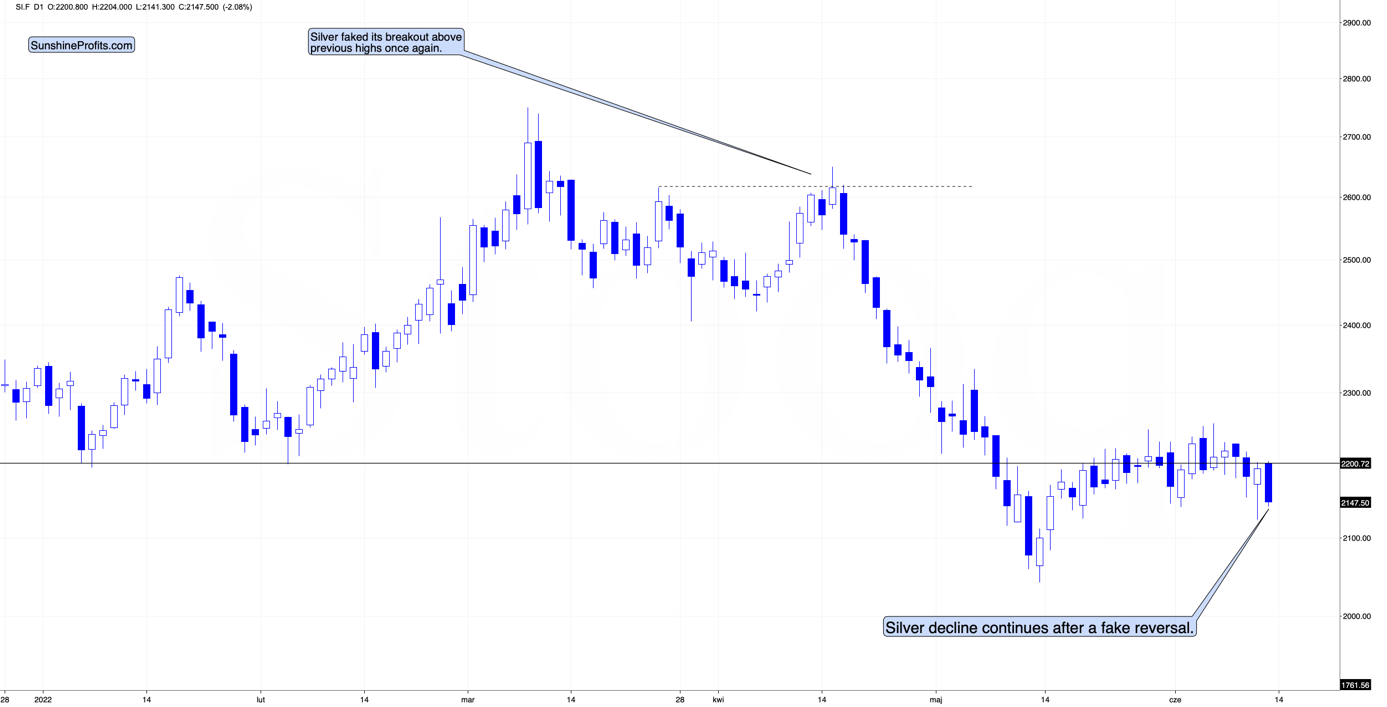
In the case of the silver market, Friday’s rally is barely visible. The reversal appeared notable, but silver is already back down in today’s pre-market trading, so it seems that even the short-term trend remains down.
At the time of writing these words, the stock market (the S&P 500 futures) is already trading at new 2022 lows. Silver and mining stocks (especially junior miners) are closely linked to the performance of stocks in the short term, so it seems that when gold finally declines, silver and miners will be affected and decline even more. That’s very much in tune with my previous expectations.
On May 21, 2022 (based on May 20 close), I wrote the following:
If history rhymes – as it usually tends to – we’re likely to see higher stock market values in the next 1-3 days. That’s likely to support higher junior mining stock prices.
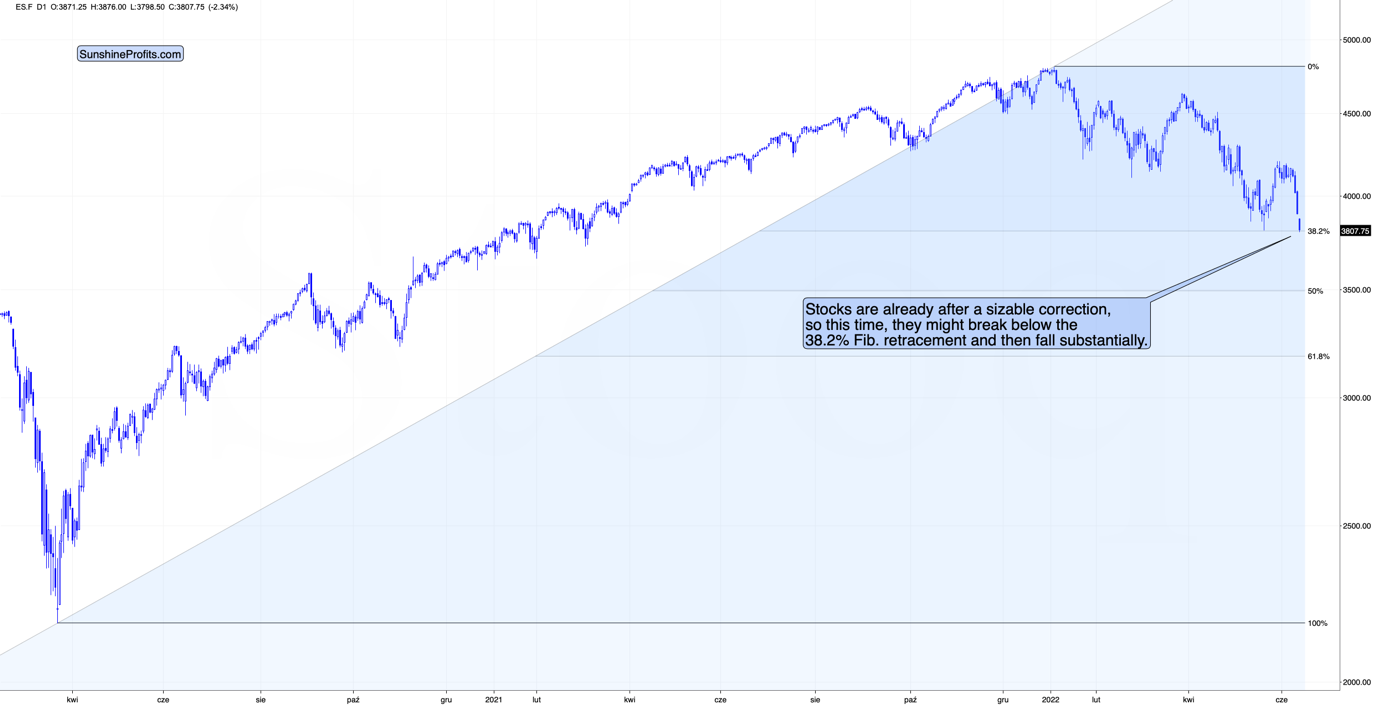
Also, let’s not forget about the forest while looking at the trees. Yesterday’s intraday low in the S&P 500 was 3810.32, which was just about 5 index points below my initial target for this short-term decline at the 38.2% Fibonacci retracement based on the entire 2020 – 2022 rally.
This means that the odds of a short-term rally in stocks have greatly increased.
That was the bottom, and we have indeed seen a short-term corrective upswing since then. However, this correction appears to be over – stocks have just moved to new lows. Given that they already corrected after first approaching the 38.2% Fibonacci retracement based on the 2020 – 2022 rally – they can now break through this level without looking back. This would be particularly bearish for silver and mining stocks (especially junior mining stocks).
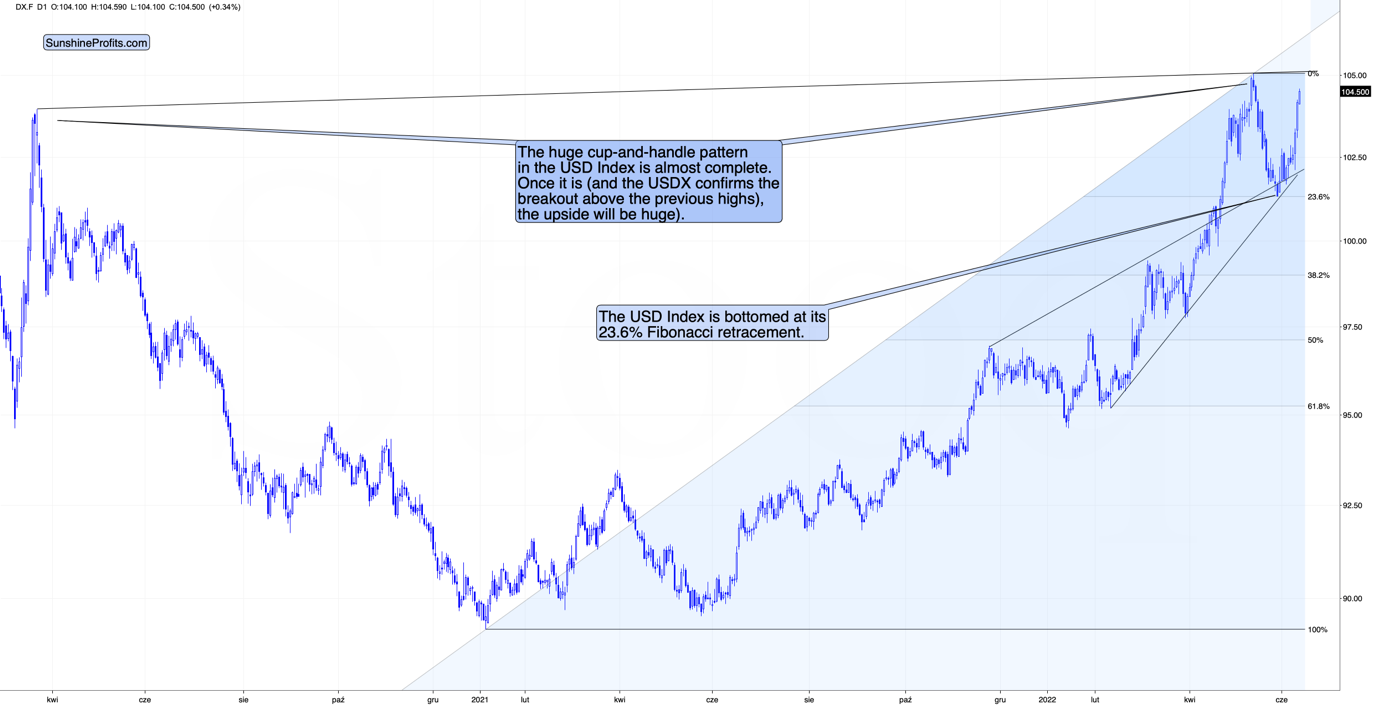
On top of that, we see a soaring USD Index, which is about to move to (and likely above) its previous highs.
The key detail about the following rally is that it will mean the completion of a broad cup-and-handle pattern. This means that after the breakout, the USD Index would be likely to continue rallying in the medium run, and yes, this means that the following rally could be huge. This is in perfect tune with what I’ve been expecting to see for many months – including the beginning of 2021, when almost everyone was bearish on the U.S. currency.
What about junior miners?
On Friday, they rallied in a quite emotional manner, just as gold did. Unlike gold, however, they didn’t move to new short-term highs. They just corrected to their previous highs, and even though Friday’s rally was much bigger than what we saw in early April, these rallies ended at similar levels – close to previous highs. I marked it with red, dashed lines.
Friday’s rally changes nothing with regard to the medium-term trends, and the overnight price changes that I discussed above support the theory in which junior miners head much lower in the following weeks (and probably days).
On a side note, do you know what appears to be a currency but doesn’t pay any interest, and doesn’t have thousands of years of history to back up its use? Cryptos. Do you know what just broke to new lows? Also cryptos, and as the interest rates on fiat currencies continue to increase, the pressure to sell cryptos will also increase. Please keep in mind that I called the top in bitcoin when it moved to $50k – it was not 100% precise, but given that it’s currently worth less than half of that, it seems that it was a quite good exit point.
Thank you for reading our free analysis today. Please note that the above is just a small fraction of the full analyses that our subscribers enjoy on a regular basis. They include multiple premium details such as the interim targets for gold and mining stocks that could be reached in the next few weeks. We invite you to subscribe now and read today’s issue right away.
Sincerely,
Przemyslaw Radomski, CFA
Founder, Editor-in-chief


Gold Investment News
Delivered To Your Inbox
Free Of Charge
Bonus: A week of free access to Gold & Silver StockPickers.
Gold Alerts
More-
Status
New 2024 Lows in Miners, New Highs in The USD Index
January 17, 2024, 12:19 PM -
Status
Soaring USD is SO Unsurprising – And SO Full of Implications
January 16, 2024, 8:40 AM -
Status
Rare Opportunity in Rare Earth Minerals?
January 15, 2024, 2:06 PM

