
tools spotlight

-
GDXJ: While Focusing on Details, Don’t Miss the Great Downturn!
June 10, 2022, 9:36 AMIf history is to repeat itself to some extent, junior miners have a chance to make minor corrections. However, is it worth leaving short positions now?
Let’s take a look at what happened in junior mining stocks.
In last Friday’s (June 3) Gold & Silver Trading Alert, I commented on Thursday’s rally in the following way:
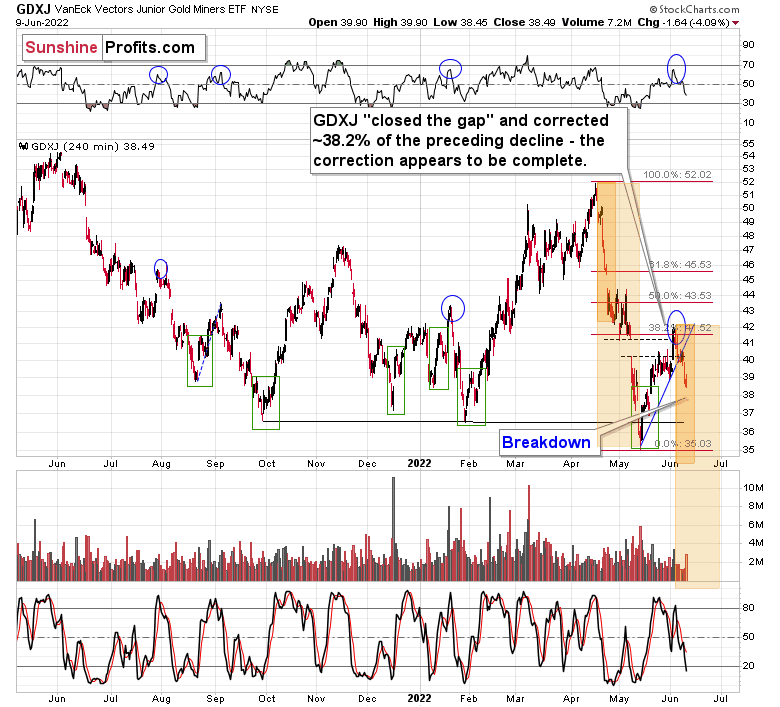
The price of the GDXJ ETF – a proxy for junior miners – moved sharply higher yesterday, and this got many people excited. High volume confirms that. It’s natural for most investors and traders to view rallies as bullish, but let’s keep in mind that most traders tend to lose money… It’s not that simple. After all, the best shorting opportunities are at the tops, which – by definition – can only be formed after a rally.
The particularly interesting thing about high volume readings in the GDXJ ETF is that they quite often mark local tops. Remember the late-April – early-May consolidation? It ended when GDXJ finally rallied on high volume. That was the perfect shorting opportunity, not a moment to panic and exit the short position.
The GDXJ-based RSI indicator is also quite informative right now. It moved well above 50, but it’s not at 70 yet. Why would that be important? Because that’s when many of the previous corrections ended.
When one digs deeper, things get even more interesting. You see, when we consider corrections that started after the RSI was very oversold (after forming a double bottom below 30), it turns out that in all those cases, the tops formed with the RSI between 50 and 70. I marked those situations with blue ellipses on the above chart.
So, while it’s easy to “follow the action,” it’s usually the case that remaining calm and analytical leads to bigger profits in the end.
Also, let’s use yesterday’s move as something useful. If this single-day move higher made you really uncomfortable and almost made you run for the hills, it might be a sign that the size of the position that you have is too big. It’s your capital and you can do with it what you wish, but if the above were the case, it might serve as food for thought.
The big trend (as well as the reasons for it) remains down, which means that the enormous profit potential remains intact.
Last Friday’s and this week’s declines confirm the above. The high-volume rally marked the top – those who got excited at that time likely bought exactly or very close to the top, instead of shorting at that time. Fortunately, you were prepared.
After taking profits off the table and closing short positions on May 12, we immediately entered long positions (it turned out that it happened right at the bottom), and we then took profits from that long position on May 26. Next, we returned to short positions. These positions are already profitable, but it seems that they will be much more profitable soon.
Why?
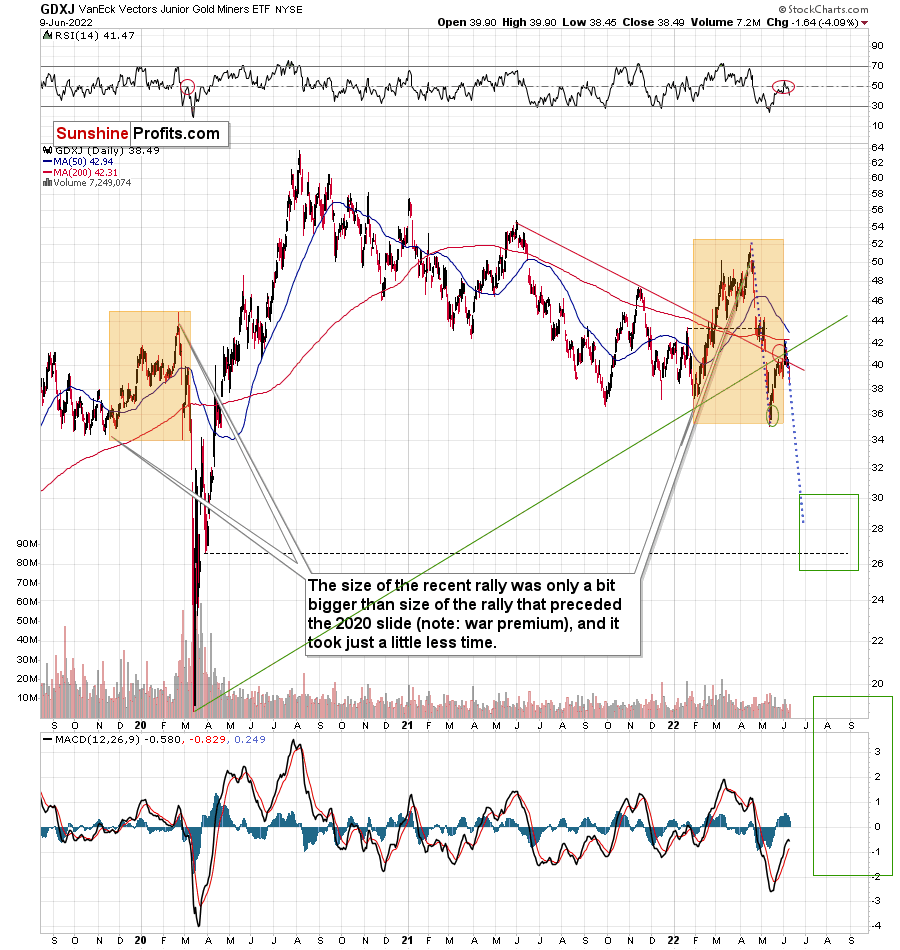
Most importantly, because history rhymes, we’re likely to see a repeat of 2012-2013 or the 2008 decline. So far, the current slide is in tune with the 2008 performance.
However, let’s not dig into the long-term details yet. While we’re close to the short-term chart, let’s focus on what it features. For your convenience, here it is once again.
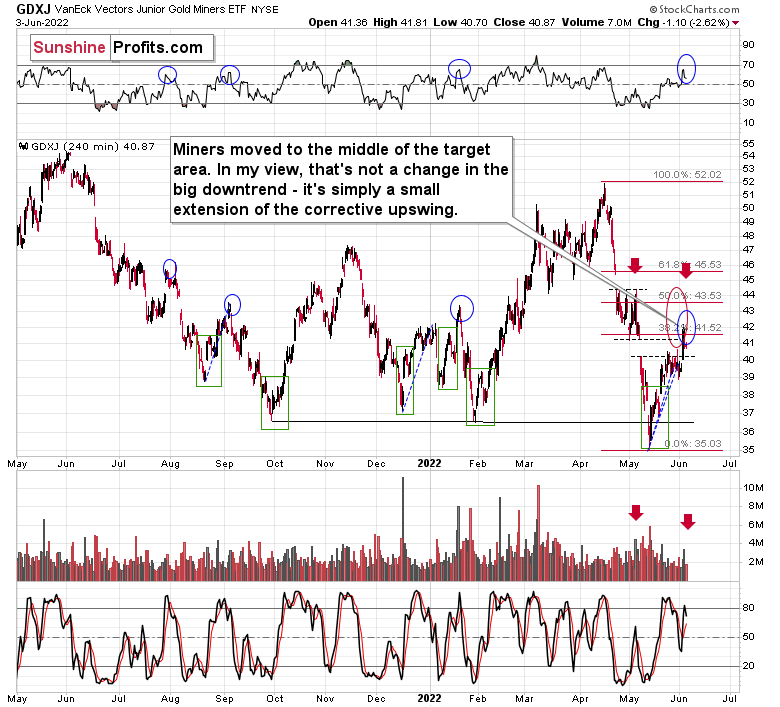
The recent April-May decline doesn’t have to be repeated to the letter, but we could see something similar nonetheless. After all, that decline is the most recent analogy to what we’re about to see in the GDXJ (a massive decline).
Based on the above, I marked two cases from the precious decline (the initial decline and the entire decline) and I copied them to the current situation, assuming that the recent top is indeed the starting point of the next bid decline (which seems likely in my view).
It turns out that junior miners might need to decline to or slightly below the May lows before we see even a moderate corrective upswing.
Will I want to trade this correction? Probably not. If we see a correction from below $35, it might be small – only a bit over $36, so it might be way too risky to trade this quick rebound. The downside (the bigger orange rectangle) is much bigger than the above, and it would be a much bigger waste to miss this move in order to try to catch a relatively small move.
Besides, there’s also a chance that we won’t see any meaningful correction, just like what happened in 2020.
Back in March 2020, after the corrective upswing, mining stocks fell like a stone in water. While the current price moves are less volatile, they are still somewhat similar (note the marked areas on the above chart).
Moreover, please note that the GDXJ failed to break back above the red and green resistance lines, which by itself is also a bearish indication.
The next short-term upswing is quite likely here, and (while I can’t make any promises with regard to performance), in my opinion, the profits on our short positions are likely to increase tremendously before we exit them.
Thank you for reading our free analysis today. Please note that the above is just a small fraction of the full analyses that our subscribers enjoy on a regular basis. They include multiple premium details such as the interim targets for gold and mining stocks that could be reached in the next few weeks. We invite you to subscribe now and read today’s issue right away.
Sincerely,
Przemyslaw Radomski, CFA
Founder, Editor-in-chief -
Will the Fed Come to the Rescue of Carefree Investors?
June 9, 2022, 8:27 AMWith the S&P 500 and the GDXJ ETF declining on Jun. 8, the daily shift from optimism to pessimism highlights the fundamental frailty of the financial markets. Moreover, while some investors assume that overly-bearish positing can elicit more than just short-covering rallies, the reality is that the S&P 500 and the GDXJ ETF are likely nowhere near medium-term bottoms.
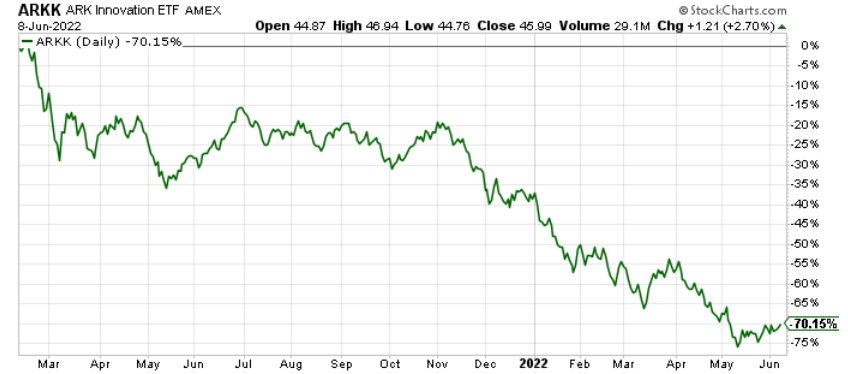
To explain, Cathie Wood – who runs ARK Invest – may go down as the poster child of this bubble. With the oracle confusing speculative growth stocks for generational innovation, the ghosts of QE have some assuming that 2020/2021 was the norm and not an aberration. However, with ARK Innovation’s flagship fund down by more than 70% from its highs, you would think her mystic would have fallen along with it.
Please see below:
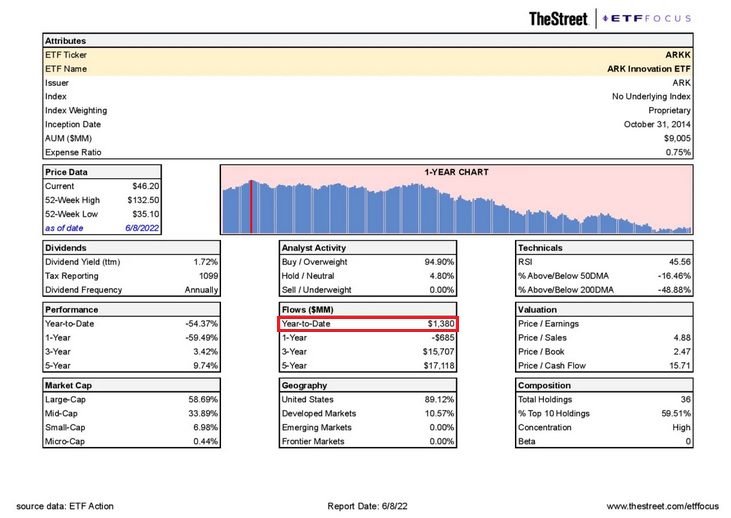
Yet, with the ARK Innovation ETF recording $1.38 billion in net inflows in 2022, retail investors continue to pour money into the embattled fund.
Please see below:
As a result, there is no fear in the financial markets. With the consensus assuming the Fed will turn dovish and solve all of the U.S.’s economic problems, investors have lined up to throw good money at bad investments. To that point, I noted on May 25 that the psychological effect of the Fed’s continuously pacifying the markets has clouded the judgment of a generation of investors. I wrote:
We’ve officially entered the monetary version of The Boy Who Cried Wolf. With Fed officials running to the rescue each time the financial markets show signs of stress, investors are programmed to ignore their hawkish threats. However, while these post-GFC pivots occurred with inflation perched near 2%, investors are so steadfast in their belief that they ignore the climactic consequences of unanchored inflation.
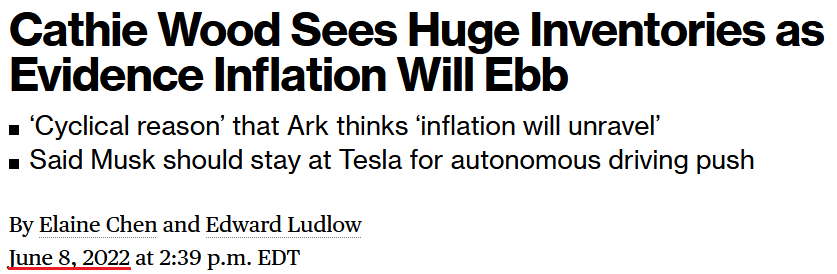
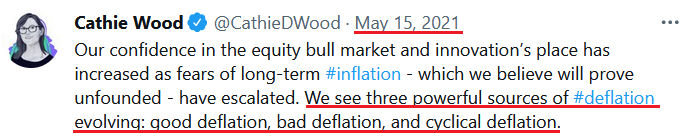
Therefore, while investors either don’t know or don’t care about history, they have complete faith in a shepherd that has already led them to slaughter. For example, Wood told Bloomberg on Jun. 8:
“I’ve never seen [retail] inventory surges like this in my career and I’ve been around for a long time. This inventory issue highlights the cyclical reason we’ve been saying we think inflation will unravel.”
Please see below:
 Source: Bloomberg
However, notice what Wood wrote on Twitter on May 15, 2021?
Throwing Good Money at Bad Investments
Thus, it’s been more than 12 months since her “powerful sources of deflation” haven’t materialized. Yet, despite the ~70% drawdown, investors continue to believe that her losing streak will be reversed. As such, is this the kind of unwavering faith you see at market bottoms? In reality, these managers often suffer the brunt of the criticism when bull markets unravel.
Furthermore, it’s not only the speculative corners of the stock market that have seen inflows. On aggregate, money is still fowling into mutual funds and ETFs as retail investors “buy the dip.”
Please see below:
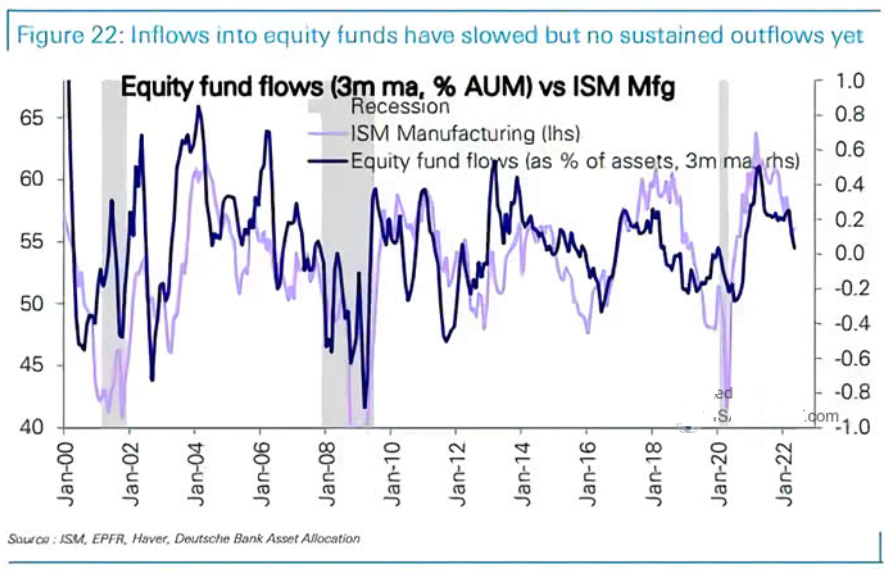
To explain, the purple line above tracks the ISM’s manufacturing PMI, while the blue line above tracks the three-month percentage change in equity fund flows as a percentage of assets under management. If you analyze the right side of the chart, you can see that flows have decelerated but remain positive.
On top of that, Bank of America’s Global Wealth and Investment Management (GWIM) clients – who are generally high net-worth individuals – equity allocations remain well above their historical average of ~56%.
Please see below:
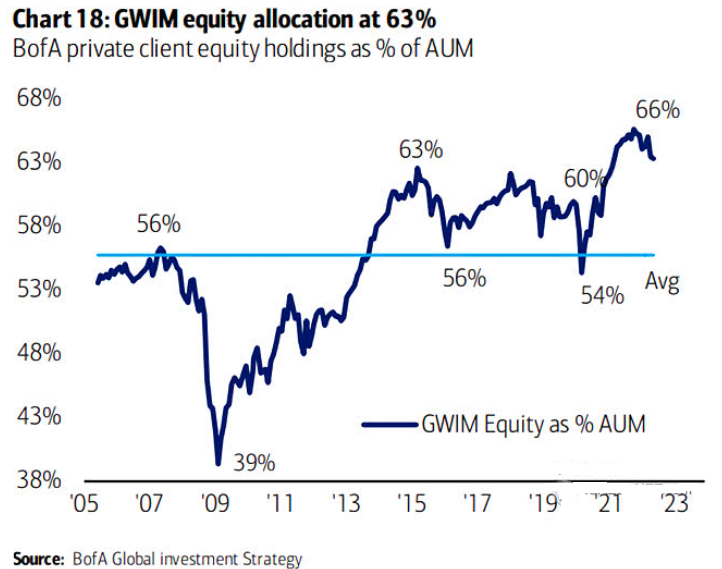
To explain, the blue line above tracks GWIM client holdings as a percentage of assets under management. If you analyze the right side of the chart, you can see that the S&P 500’s struggles have only resulted in an immaterial drop in equity allocation.
Moreover, when the Fed fanned the hawkish flames from 2015 to 2019, GWIM clients recorded sharp declines in equity allocations. However, with investors bracing for a dovish pivot, their Boy Who Cried Wolf belief couldn’t be more apparent.
As a result, while many sentiment measures are profoundly bearish, actions speak louder than words. Furthermore, when speculative stock buying is abundant, retail investors continue to push chips into their mutual funds, and GWIM clients won’t sell, I highlighted on May 19 that hope has overtaken objective analysis. I wrote:
While Fed officials realize that inflation will only subside if commodity and stock prices fall, a near 20% peak-to-trough decline in the S&P 500 still hasn’t spooked market participants. Moreover, while some claim that sentiment is extremely bearish on Wall Street, the reality is that no one fears the Fed.
To that point, Wood’s comment that the “inventory issue highlights the cyclical reason we’ve been saying we think inflation will unravel” lacks fundamental credibility. For example, I noted the inventory builds at Walmart and Target previously, but referenced how Ralf Lauren, Nordstrom, Home Depot, Foot Locker, Canada Goose, TJX Companies, and Macy’s painted much more different portraits.
More importantly, Wood and the consensus don’t realize that input inflation is a catch-22. To explain, if companies pass on higher input costs to consumers, it will increase the Consumer Price Index (CPI) and elicit more hawkish responses from the Fed. In contrast, if companies don’t pass on higher input costs, their profit margins erode. Moreover, why would investors pay near-record multiples for stocks if their profit margins are decelerating?
Thus, input inflation is a lose-lose situation for the S&P 500, as both sides of the equation are fundamentally bearish. In addition, input inflation remains abundant; and with S&P 500 companies confronted with the conundrum above, it will take a recession to calm economically-sensitive commodities’ fervor.
Please see below:
 Source: Investing.com
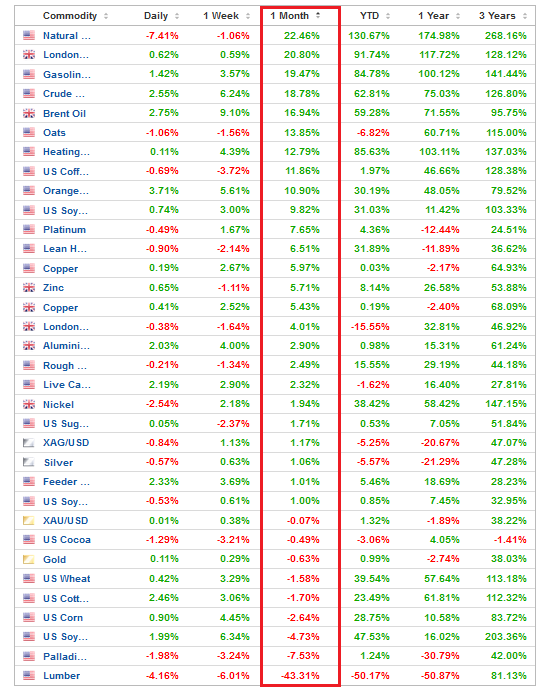
To explain, the table above highlights the performance of commodities over various timeframes. If you analyze the vertical red rectangle, you can see that most commodities have risen materially over the last month. Moreover, lumber is the only commodity that’s fallen off a cliff over the last ~30 days.
As a result, these prices will flow into S&P 500 companies’ cost structures in the months ahead and present them with the catch-22: raise prices and stoke inflation or absorb the costs and erode their profit margins. Thus, the Fed needs to reduce input inflation for the bull market to resume, and three rate hikes have done little to deter the commodity enthusiasts.
To that point, the U.S. Energy Information Administration (EIA) released its Weekly Petroleum Status Report on Jun. 8. An excerpt read:
“At 416.8 million barrels, U.S. crude oil inventories are about 15% below the five year average for this time of year. Total motor gasoline inventories decreased by 0.8 million barrels last week and are about 10% below the five year average for this time of year.”
Please see below:
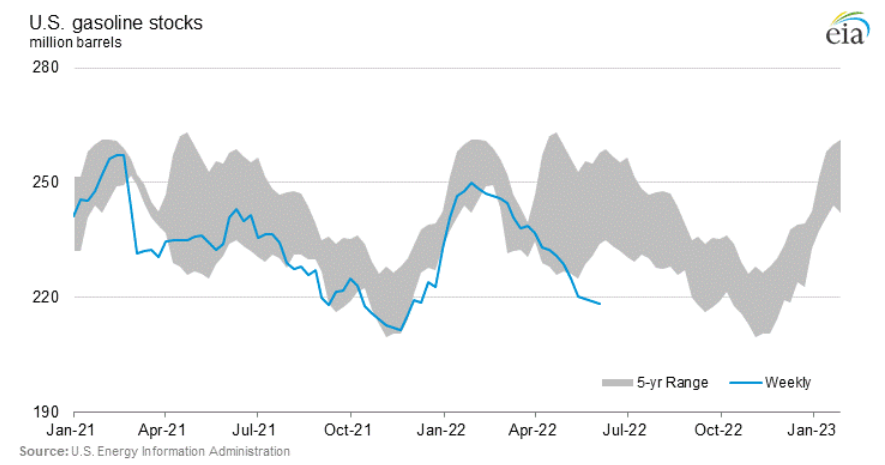
To explain, the blue line above tracks gasoline inventories, while the gray shaded area above reflects the five-year range. If you analyze the right side of the chart, you can see that gasoline stocks have fallen materially below the lower band. Therefore, who is burning all of this gasoline? Many Americans are still working from home, so they're not commuting to and from work. Thus, the sharp drop highlights inflationary demand.
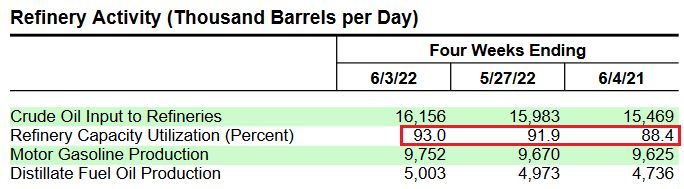
In support of this argument, please have a look at refinery capacity utilization rates. With 93% of U.S. refiners online, why are inventories declining when output is increasing? For context, U.S. refiners produced more gasoline than last week and this time last year. Yet, there still isn't enough supply to meet demand.
 Source: EIA
Thus, it’s another week and another all-time high for retail gasoline prices.
Please see below:
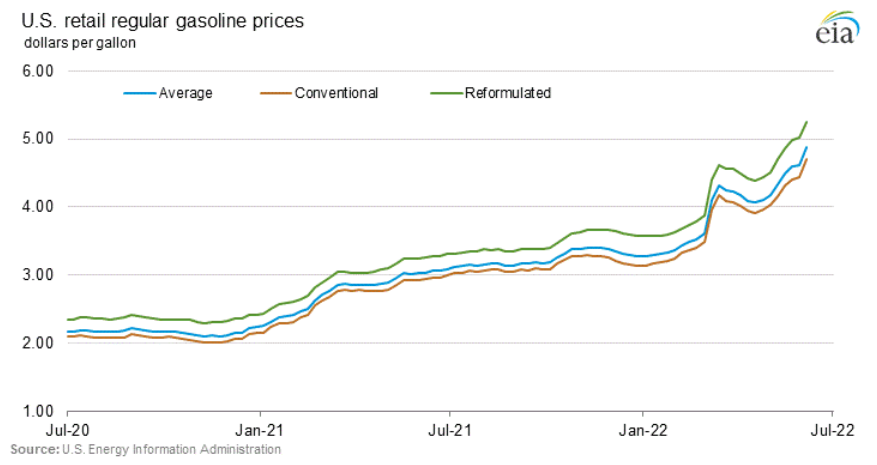
The bottom line? More than a decade of dovish pivots have programmed investors to “buy the dip” and await the Fed’s rescue. However, the consensus miscalculates the task at hand. With inflation raging, unrelenting commodity bulls will only be emboldened by a dovish 180. Moreover, if the Fed backs off, the U.S. dollar would suffer, increasing import-related inflation on an FX-adjusted basis. As a result, the bulls don’t realize that the stock market’s swan song has already begun.
In conclusion, the PMs were mixed on Jun. 8, as gold closed in the green. However, volatility has day traders chasing several rallies and dips, and the latter should rule the day over the medium term. As such, while history shows the bulls will hold on until the very end, the economic outlook continues to worsen with each passing day.
Thank you for reading our free analysis today. Please note that the above is just a small fraction of the full analyses that our subscribers enjoy on a regular basis. They include multiple premium details such as the interim targets for gold and mining stocks that could be reached in the next few weeks. We invite you to subscribe now and read today’s issue right away.
Sincerely,
Przemyslaw Radomski, CFA
Founder, Editor-in-chief -
Will Ignoring Fundamentals Take Revenge on Bullish Traders?
June 8, 2022, 8:15 AMWhile the Fed strives to tame inflation, short-term investors continue to ruin its efforts with bullish actions. Will their love of risk pay off?
With the S&P 500 enjoying a mid-day rally on Jun. 7 and the GDXJ ETF (proxy for junior gold and silver mining stocks) following suit, the bulls warmed up to the idea of a "soft landing." However, with a much higher U.S. federal funds rate needed to cool inflation, the short-term optimism should be short-lived.
To explain, I've noted on numerous occasions that risk-on sentiment often reverberates across multiple markets. Therefore, when stocks bid higher, commodities usually follow, and this increases the Fed's inflation conundrum. As a result, investors' optimism enhances the pricing pressures.
Please see below:
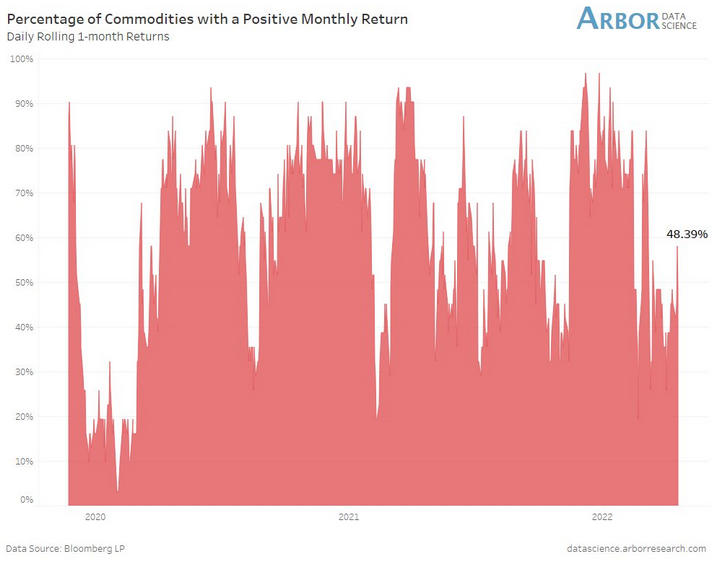
The red bars above track the percentage of commodities experiencing a positive monthly return. If you analyze the right side of the chart, you can see that the negativity in April/May culminated with a smaller percentage of commodities moving higher.
However, the red bar furthest to the right shows that more commodities are rising once again. As a result, if the stock market remains buoyant, the follow-through from commodities will only enhance inflation and elicit more hawkish policy from the Fed.
Furthermore, while investors still hope for a dovish pivot, the U.S. labor market remains on solid footing. Thus, the Fed’s dual mandate of price stability and maximum employment points to more hawkish policy in the coming months.
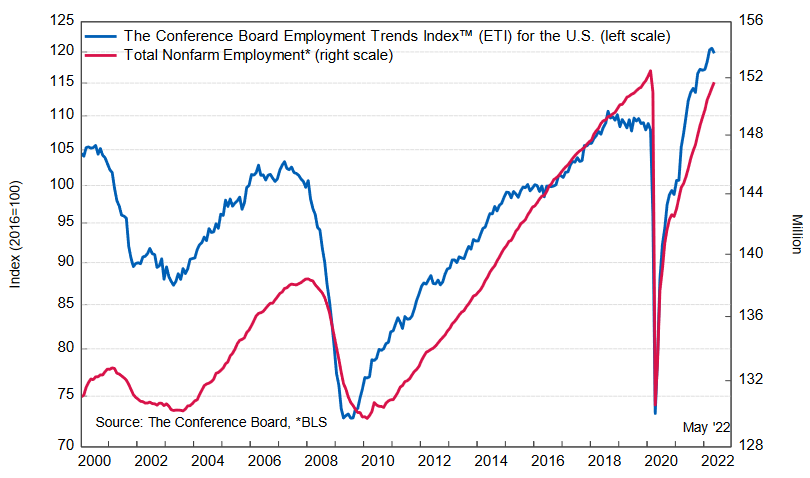
For example, The Conference Board released its Employment Trends Index (ETI) on Jun. 6. The index declined from 120.60 in April (an upward revision) to 119.77 in May. However, all-time highs shouldn’t materialize when the Fed is tightening monetary policy, and the immaterial decline signals there is plenty of work to do to moderate wage inflation.
Agron Nicaj, Associate Economist at The Conference Board, said:
“The Employment Trends Index fell slightly in May, signaling slowing, but positive job growth in the months ahead.... The labor market remains strong amid high inflation and the Federal Reserve is likely to continue its focus on stabilizing prices as a result. A strong response by the Fed risks higher unemployment rates by the end of 2022.”
Please see below:
In addition, while bear market rallies often create doubt among investors, the S&P 500 and the GDXJ ETF are unlikely to maintain their optimism in the months ahead. For example, Morgan Stanley’s Chief U.S. Equity Strategist, Mike Wilson, sees material downside in the summer months.
He told clients that “stocks may rally further in the near term” and “can continue for a few more weeks until the Fed makes it crystal clear they remain hawkish, and earnings revisions fall well into negative territory.” After that, however, he expects the bearish cocktail to “take the S&P toward 3,400 by mid-late August.”
Furthermore, with investors pricing risk like real yields are at all-time lows, I warned on May 19 that we’re likely far from a medium-term bottom. I wrote:
While Fed officials realize that inflation will only subside if commodity and stock prices fall, a near 20% peak-to-trough decline in the S&P 500 still hasn’t spooked market participants. Moreover, while some claim that sentiment is extremely bearish on Wall Street, the reality is that no one fears the Fed.
Please see below:
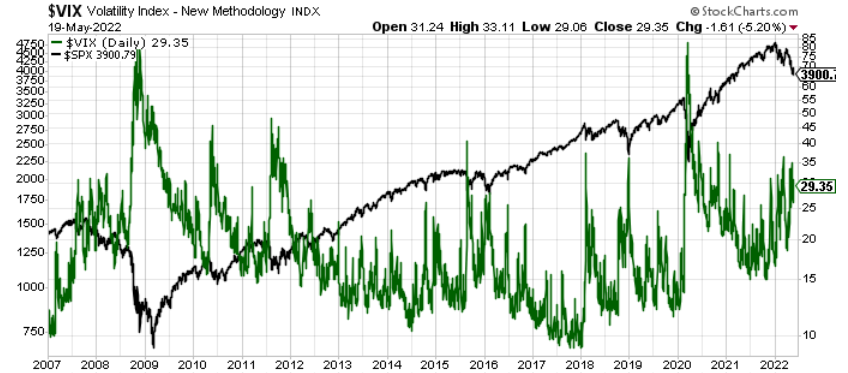
To explain, the black line above tracks the S&P 500, while the green line above tracks the Cboe Volatility Index (VIX). If you analyze the relationship, notice how material spikes in the VIX often mark bottoms for the S&P 500? In a nutshell: when true fear is present, investors rush to buy put options (downside hedges) at any cost, and volatility skyrockets. Therefore, panic is what often creates long-term bottoms.
However, if you analyze the right side of the chart, you can see that the VIX hasn’t even cracked 40 in 2022. Moreover, the VIX has actually declined, even though the S&P 500 remains in free fall. As a result, investors continue to buy call options (upside hedges) as they follow the post-GFC script and await the Fed’s dovish pivot.
Supporting the thesis, Wilson notes that “the price remains wrong with the equity risk premium at 290 [basis points] bps” versus his fair market value of 345 bps. For context, investors discount future earnings/cash flows to determine the appropriate price of a stock, or in this case, the index.
Moreover, when the equity risk premium rises, the discount rate rises, and the asset’s price falls. Thus, with investors still ignoring the risks ahead, a higher discount rate should weigh on the S&P 500 in the coming months.
Likewise, there are many more pieces to the fundamental puzzle. For example, a hawkish Fed is bullish for U.S. real yields and the USD Index. As a result, it’s no surprise that all three moved in tandem in 2022.
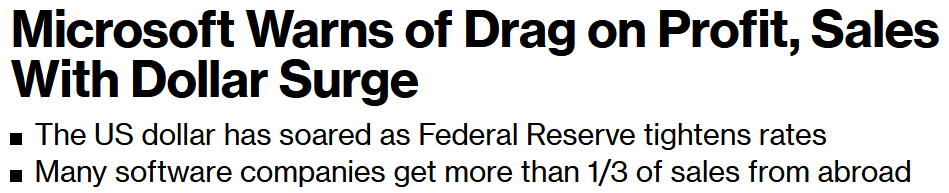
However, earnings revisions – which are upgrades versus downgrades – are negatively correlated to the U.S. dollar. In a nutshell: a rallying greenback reduces foreign demand for S&P 500 companies’ products and dampens their currency-adjusted earnings. For example, Microsoft warned about the dynamic on Jun. 2.
Please see below:
 Source: Bloomberg
Therefore, Wilson expects more S&P 500 companies to fall victim to the dollar’s wrath.
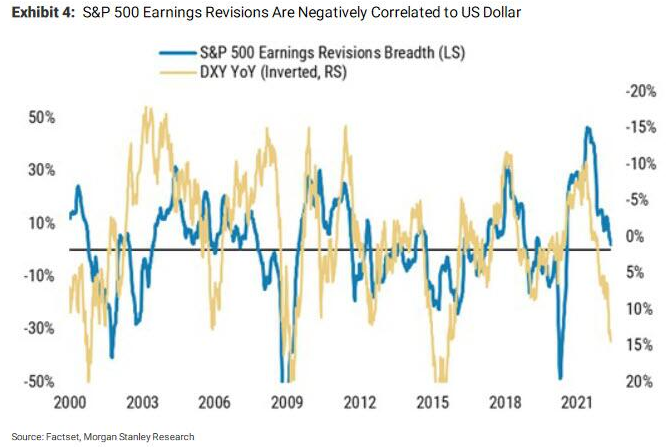
To explain, the blue line above tracks the S&P 500’s earnings revision breadth (the spread of upgrades minus downgrades), while the gold line above tracks the inverted year-over-year (YoY) percentage change in the USD Index. For context, inverted means the latter’s scale is flipped upside down, and a falling gold line represents a rising USD Index.
If you analyze the relationship, you can see that sharp YoY percentage increases in the USD Index often lead to sharp negative revisions in earnings expectations. Moreover, if you focus your attention on the right side of the chart, you can see that the gold line has declined materially, which implies plenty more downward earnings revisions in the months ahead.
Likewise, when you combine the ominous data with two more likely 50 basis point rate hikes in June and July, it’s understandable why Wilson expects the S&P 500 to hit 3,400 before September.
Also noteworthy, seasonal factors point to more earnings woes in the coming months.
Please see below:
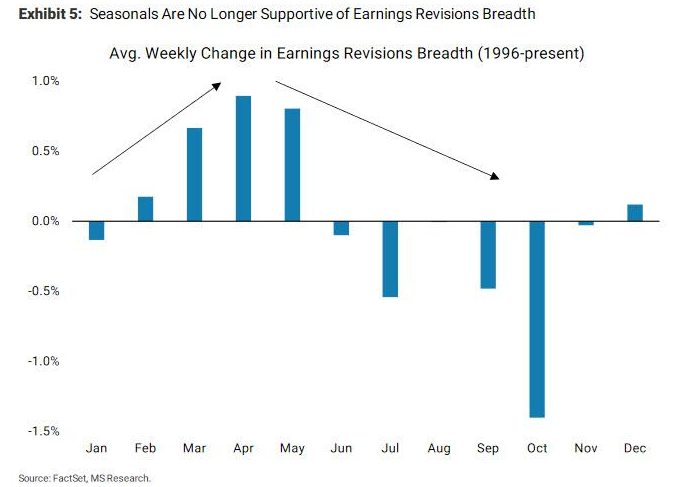
To explain, the blue bars above track the average percentage change in earnings revision breadth since 1996. If you analyze the left side of the chart, you can see that earnings estimates tend to increase leading up to late spring/early summer. However, once the economic boost of warmer weather fades, revisions tend to turn negative as analysts make their fall and winter projections.
For context, analysts and markets are forward-looking. So, the upward revisions in February, March, April, etc. reflect expected performance three and six months later. Likewise, the downward revisions in July, September, October, etc. also reflect expected performance three and six months later. Therefore, with the peak summer months soon to be here and gone, bearish estimates for fall and winter should materialize.
On top of that, I’ve been warning for some time that the U.S. 10-Year real yield would rise in 2022. Moreover, while the metric consolidates in the 0.20% to 0.30% range, the Fed needs higher real yields to curb inflation. As such, further progress should weigh heavily on the S&P 500 and the PMs.
Please see below:
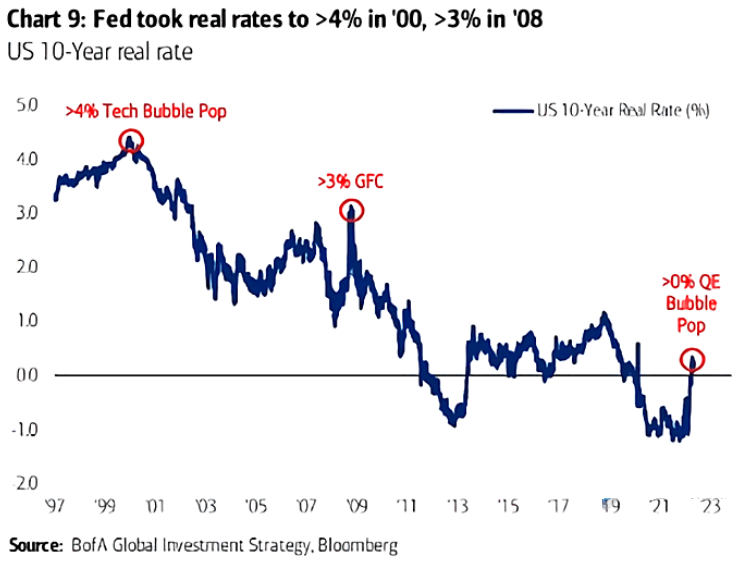
To explain, the blue line above tracks the U.S. 10-Year real yield. If you analyze the annotations, you can see that a higher U.S. 10-Year real yield coincided with the popping of the 2000 dot-com and the 2008 housing bubbles. However, inflation was lower during both of those calamities. As a result, the Fed confronts a more sinister problem today.
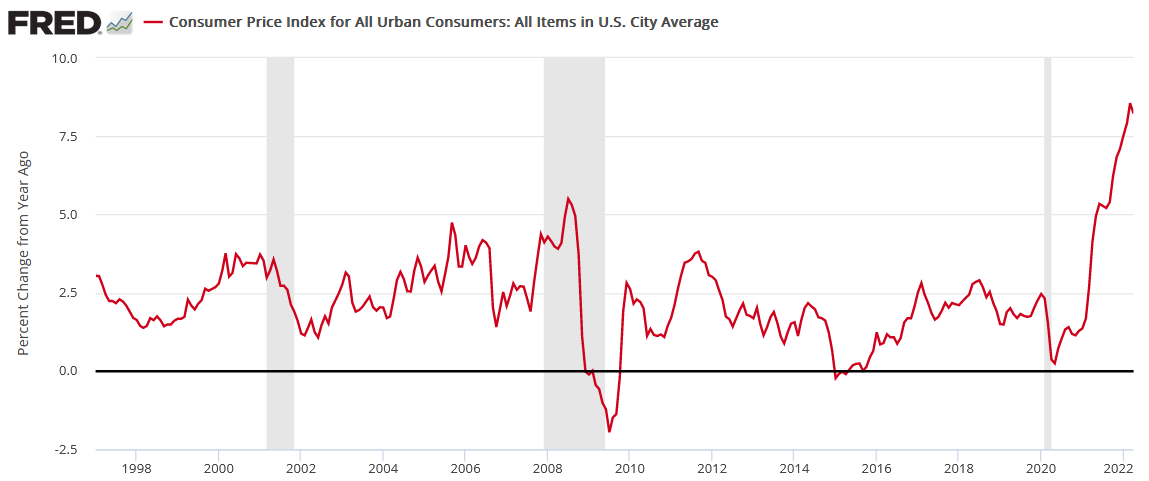
If we line up the dates, the chart below shows that both recessions were preceded by much lower inflation, and therefore, the Fed could pacify investors. In contrast, the U.S. 10-Year real yield is completely out of whack with the current inflation rate. As a result, the Fed needs a miracle to achieve a “soft landing.”
The bottom line? Short-term traders don’t care about fundamentals, and their actions can keep asset prices uplifted for days or weeks. However, fundamental realities always come to bear, and troubling economic developments are not fixed through wishes or words. Therefore, while investors hold on to the idea that things are fine now, history shows that severe shocks should dominate the headlines as the Fed attempts to rein in inflation.
In conclusion, the PMs rallied on Jun. 7, as old habits die hard and the ‘buy the dip’ crowd was out in full force. However, with higher real yields and a stronger USD Index poised to keep the pressure on the S&P 500 and the PMs, lower highs and lower lows should confront the pair over the medium term.
Thank you for reading our free analysis today. Please note that the above is just a small fraction of the full analyses that our subscribers enjoy on a regular basis. They include multiple premium details such as the interim targets for gold and mining stocks that could be reached in the next few weeks. We invite you to subscribe now and read today’s issue right away.
Sincerely,
Przemyslaw Radomski, CFA
Founder, Editor-in-chief -
Gold Stocks: You Can See the Sell Signs With the Naked Eye
June 7, 2022, 7:52 AMThe technical part of today’s analysis is going to be relatively short, as the PMs declined yesterday, and what I wrote in yesterday’s extensive Gold & Silver Trading Alert simply remains up-to-date.
Immediately after junior miners soared on Thursday, I wrote the following:
The GDXJ moved sharply higher after the session started, and at the moment of writing these words, it moved to the upper border of the previous, early-May price gap. Please note that it was my original target for the previous long positions, and it was just reached.
It doesn’t change the outlook here. When we took profits from the long positions and re-entered short ones, I wrote that we were doing so, not because it was clear that the top was in, but because the risk to reward ratio changed dramatically. And that was indeed the case. The fact that juniors rallied today doesn’t change it. In my view, it was a good decision to switch the positions then based on the data that we had at that time.
Anyway, the medium-term trend remains down, and it seems that we’ll see another – very powerful – downswing shortly.
We didn’t have to wait long for the market to agree with me. Let’s see what happened.

The GDXJ moved slightly above the lower and upper borders of the price gap and above the 38.2% Fibonacci retracement level. Then, we saw an invalidation of all the above-mentioned breakouts. Invalidations of breakouts are immediate sell signals, so the implications are, of course, bearish.
It’s even clearer on the 1-hour candlestick chart.
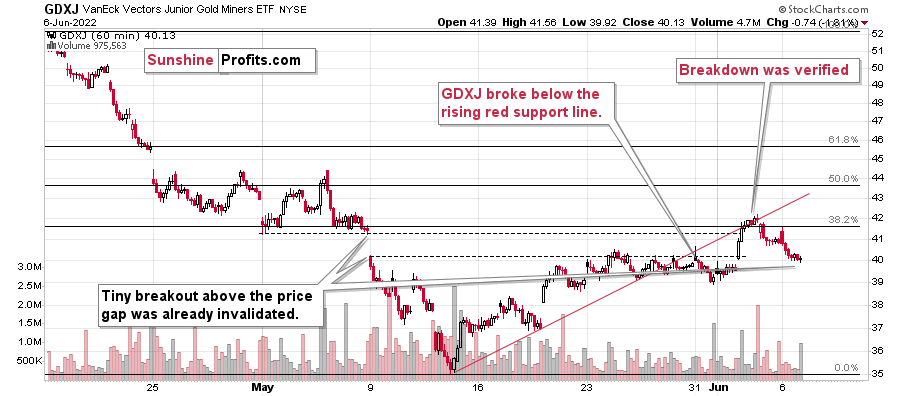
The above chart allows us to see that, in addition to the above, the GDXJ first broke below its rising red support line, and then it verified this breakdown – twice. The first verification was an immediate one at the end of May, and we just saw the second one a few days ago.
Yesterday’s close back below the lower border of the price gap confirms the bearish nature of the recent patterns.
Even though the price is slightly higher than it was at the end of May, based on what happened (the failed breakouts), the short-term outlook is even more bearish now than it was back then.
I’ve written this many times in the previous weeks, but it won’t hurt to clarify it once again. In my opinion (just an opinion, of course, I can’t guarantee any kind of performance), this is an epic shorting opportunity that will seem obvious to everyone several months from now. There are myriads of signs, but let’s state the obvious: gold was unable to rally despite the – literally – war in Europe. If that isn’t a screaming sell indication for the precious metals market, I don’t know what is. Still, at this time, very few people realize this. You do, though :)
Having said that, let’s take a look at the markets from a more fundamental angle.
Stuck in Quicksand
With anxious bulls unable to muster long-lasting rallies, the harsh realities of unanchored inflation and a hawkish Fed have kept sentiment in check. Moreover, with the U.S. 10-Year Treasury yield recapturing 3% on Jun. 6, the bond market isn’t helping the situation.
Please see below:
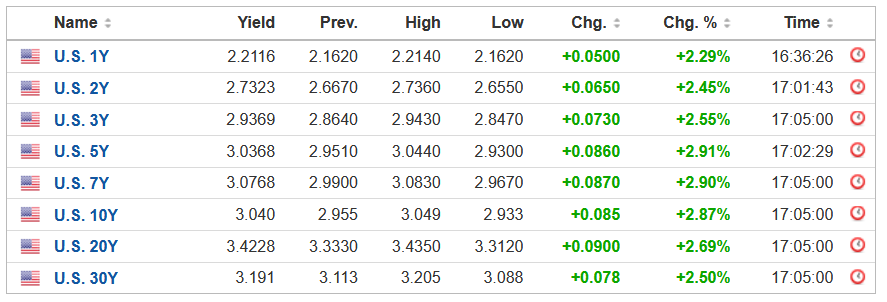 Source: Investing.com
Likewise, with Fed officials warning of further interest rate hikes in the coming months, the economic strain should weigh heavily on the S&P 500 and the PMs. For example, Cleveland Fed President Loretta Mester said on Jun. 3: “It’s too soon to say that that’s going to change our outlook or my outlook on policy. The No. 1 problem in the economy remains very, very high inflation, well above acceptable levels, and that’s got to be our focus going forward (…).”
“I think the Fed has shown that we’re in the process of recalibrating our policy to get inflation back down to our 2% goal. That’s the job before us.”
As a result, while 50 basis point rate increases in June and July are likely done deals, Mester expects the hiking spree to continue in September.
Please see below:
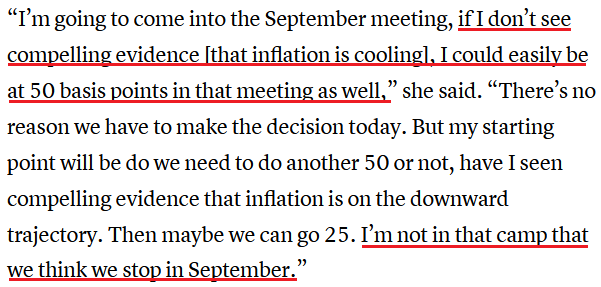 Source: CNBC
In addition, Fed Vice Chair Lael Brainard mirrored that sentiment on Jun. 2. Speaking with CNBC, she said:
“We’re certainly going to do what is necessary to bring inflation back down. That’s our No. 1 challenge right now. We are starting from a position of strength. The economy has a lot of momentum.”
Therefore, as long as inflation remains uplifted, the Fed has no cause for pause:
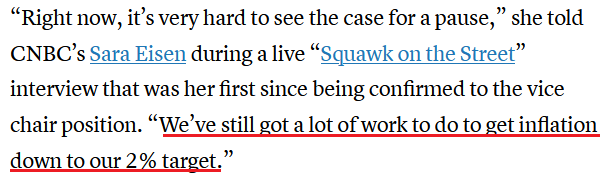 Source: CNBC
Furthermore, I’ve warned on numerous occasions that the Bank of Canada (BoC) is the hawkish canary in the coal mine. In a nutshell: due to the geographical proximity and the fact that 75% or more of Canadian exports are sent to the U.S., the two regions often have similar economic and monetary policy outcomes. Moreover, with the BoC hiking interest rates by another 50 basis points on Jun. 1, the feedback loop should continue.
For example, BoC Deputy Governor Paul Beaudry said on Jun. 2 that the central bank may need to raise its overnight lending rate above 3% to curb inflation.
“Price pressures are broadening and inflation is much higher than we expected and likely to go higher still before easing,” he said. “This raises the likelihood that we may need to raise the policy rate to the top end or above the neutral range to bring demand and supply into balance and keep inflation expectations well anchored.”
As a result, investors are unprepared for the policy measures needed to calm unanchored inflation.
Please see below:
 Source: The Globe and Mail
Also noteworthy, Beaudry added:
“The longer inflation remains well above our target, the more likely it is to feed into inflation expectations, and the greater the risk that inflation becomes self-fulfilling. History shows that once high inflation is entrenched, bringing it back down without severely hampering the economy is hard. Preventing high inflation from becoming entrenched is much more desirable than trying to quash it once it has.”
For context, I’ve long warned that ignoring inflation would have dire long-term consequences for the U.S. economy and any region. Therefore, while the consensus wants central banks to turn dovish, Beaudry realizes that doing so is worse than pushing interest rates “above the neutral range.” I wrote on May 25:
We’ve officially entered the monetary version of The Boy Who Cried Wolf. With Fed officials running to the rescue each time the financial markets show signs of stress, investors are programmed to ignore their hawkish threats. However, while these post-GFC pivots occurred with inflation perched near 2%, investors are so steadfast in their belief that they ignore the climactic consequences of unanchored inflation.
In a nutshell: consumers will eventually run out of money; and if the Fed lets inflation rage, a re-enactment of the 1970s is the worst-possible long-term outcome for Americans. Again, while the post-GFC crowd doesn’t care or doesn’t know history, unanchored inflation in the 1970s/1980s pushed the U.S. into recession four times over ~12 years (the vertical gray bars below). As a result, be careful what you wish for.
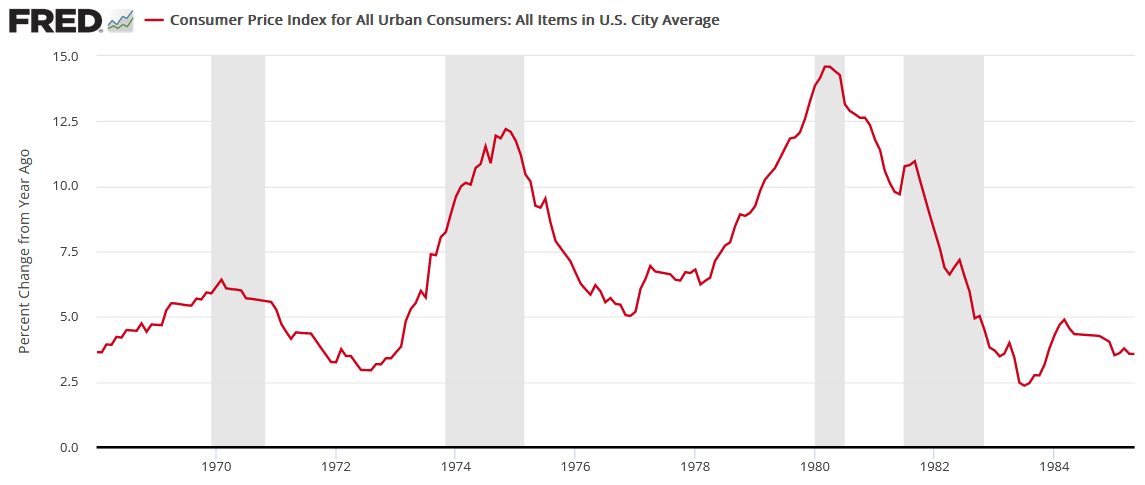
Thus, the Fed finds itself in a catch-22. Curbing inflation should lead to a recession, as nearly all bouts of unanchored inflation have ended in an economic downturn over the last ~70 years. Likewise, waiting for inflation to subside on its own would result in even more suffering.
To explain, I noted above that unanchored inflation in the 1970s/1980s pushed the U.S. into recession four times over ~12 years. As such, that’s roughly one recession every three years. Conversely, stable inflation often coincides with a recession roughly every eight to 10 years.
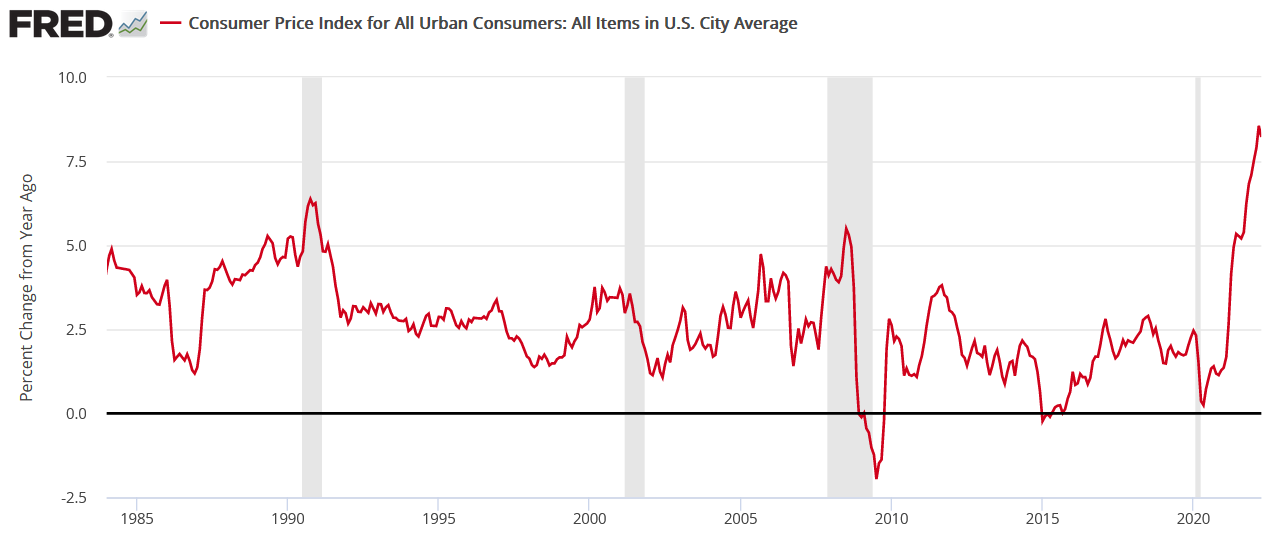
Moreover, the chart below highlights how all of the post-1970/1980 recessions coincided with rising inflation (except for COVID-19). Thus, with the current inflation rate much higher than any of those periods and more similar to the 1970/1980s, the Fed and the BoC should know that the smaller and less frequent recessions below are preferable to the larger and more frequent recessions above. As a result, the post-GFC crowd suffers from recency bias and fails to understand these economic challenges.
To that point, I’ve been bullish on the U.S. economy for some time, and the region remains in a relatively healthy position, all things considered. However, I noted on May 5 that the present situation holds no bearing on the future and that the recession roadmap is always drawn from economic optimism. I wrote:
It’s important to distinguish between where we are now and where we are likely headed. Regarding the latter, the “soft landing” crowd will likely be the 2023 version of the “transitory” crowd from 2021/2022. Regarding the former, the U.S. economy remains on solid footing RIGHT NOW. However, the dynamic only adds further fuel to the hawkish fire.
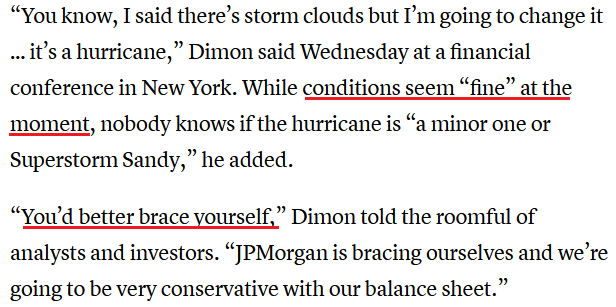
Furthermore, JPMorgan CEO Jamie Dimon summed it up perfectly on Jun. 1. He said:
“Right now, it’s kind of sunny, things are doing fine, everyone thinks the Fed can handle this. [But] that hurricane is right out there, down the road, coming our way (…).”
“We’ve never had QT like this, so you’re looking at something you could be writing history books on for 50 years.”
As a result, the CEO of the largest U.S. bank understands the economic damage that higher interest rates produce.
Please see below:
 Source: CNBC
In addition, the “soft landing” crowd doesn’t realize that their bullishness is sealing the Fed’s fate. For example, the S&P 500 has rallied in recent weeks. However, the optimism only exacerbates the central bank’s inflation problem. To explain, I wrote on May 31:
The only bullish outcome is if economically-sensitive commodities collapse on their own. Then, input inflation would subside and eventually cool output inflation, and the Fed could turn dovish.
However, the central bank has been awaiting this outcome for two years. Thus, my comments from Apr. 6 remain critical. If investors continue to bid up stock prices, the follow-through from commodities will only intensify the pricing pressures in the coming months. Therefore, investors are flying blind once again.
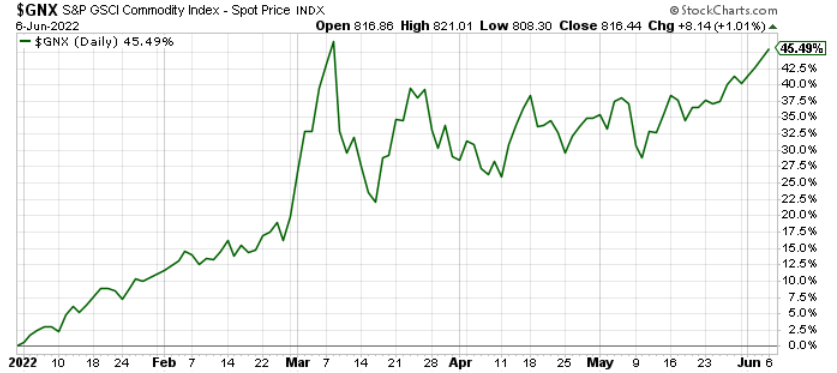
To that point, the S&P Goldman Sachs Commodity Index (S&P GSCI) also participated in the recent run-up. For context, the S&P GSCI contains 24 commodities from all sectors: six energy products, five industrial metals, eight agricultural products, three livestock products and two precious metals. However, energy accounts for roughly 54% of the index’s movement.
Moreover, with the index gunning for its 2022 Russia-Ukraine war highs, the merry-go-round of input/output inflation is easy to see by those paying attention.
Finally, the Dallas Fed released its Texas Service Sector Outlook Survey on Jun. 1. The report stated:
“Price pressures remained near record highs in May, while wage growth accelerated slightly. The selling prices index softened one point to 32.6, with 36 percent of respondents noting monthly price increases, while the input prices index was unchanged at 53.5. The wages and benefits index added two points to rise to 35.0, only slightly off a record 37.4 reading in January 2022.”
The bottom line? The bulls are stuck in quicksand, and the more they struggle, the deeper they sink. However, they still don’t realize it. When economic optimism buoys stocks, it supports higher prices for cyclical commodities. Then, month-over-month (MoM) inflation rises, and the Fed needs to up the hawkish ante. As a result, the gambit should end in a hard landing; it’s simply a matter of when.
In conclusion, the PMs were mixed on Jun. 6, as silver ended the day in the green. However, the medium-term outlook is extremely treacherous, as investors underestimate the ferocity of inflation. As such, more downside should confront the S&P 500 and the PMs as the Fed’s liquidity drain unfolds.
Thank you for reading our free analysis today. Please note that the above is just a small fraction of the full analyses that our subscribers enjoy on a regular basis. They include multiple premium details such as the interim targets for gold and mining stocks that could be reached in the next few weeks. We invite you to subscribe now and read today’s issue right away.
Sincerely,
Przemyslaw Radomski, CFA
Founder, Editor-in-chief -
Keep Calm and Stay on the Short Side of Junior Miners
June 6, 2022, 8:21 AMA price jump on a given day doesn’t mean you should give up your short position. Let’s look at the context by examining what happened in the junior mining stocks.
In Friday’s Gold & Silver Trading Alert, I commented on Thursday’s (June 2) rally in the following way:
The price of the GDXJ ETF – a proxy for junior miners – moved sharply higher yesterday, and this got many people excited. High volume confirms that. It’s natural for most investors and traders to view rallies as bullish, but let’s keep in mind that most traders tend to lose money… It’s not that simple. After all, the best shorting opportunities are at the tops, which – by definition – can only be formed after a rally.
The particularly interesting thing about high volume readings in the GDXJ ETF is that they quite often mark local tops. Remember the late-April/early-May consolidation? It ended when GDXJ finally rallied on high volume. That was the perfect shorting opportunity, not a moment to panic and exit the short position.
The GDXJ-based RSI indicator is also quite informative right now. It moved well above 50, but it’s not at 70 yet. Why would that be important? Because that’s when many of the previous corrections ended.
When one digs deeper, things get even more interesting. You see, when we consider corrections that started after the RSI was very oversold (after forming a double bottom below 30), it turns out that in all those cases, the tops formed with the RSI between 50 and 70. I marked those situations with blue ellipses on the above chart.
So, while it’s easy to “follow the action,” it’s usually the case that remaining calm and analytical leads to bigger profits in the end.
Also, let’s use yesterday’s move as something useful. If this single-day move higher made you really uncomfortable and almost made you run for the hills, it might be a sign that the size of the position that you have is too big. It’s your capital and you can do with it what you wish, but if the above were the case, it might serve as food for thought.
The big trend (as well as the reasons for it) remains down, which means that the enormous profit potential remains intact.
Friday’s decline confirms the above. While the GDXJ closed above the upper border of the previous price gap on Thursday, it closed back below it on Friday, thus invalidating the small breakout. This is a bearish sign, especially in light of what I wrote above. The top might be already in.
Remember, the strong medium-term downtrend remains intact.
Thank you for reading our free analysis today. Please note that the above is just a small fraction of the full analyses that our subscribers enjoy on a regular basis. They include multiple premium details such as the interim targets for gold and mining stocks that could be reached in the next few weeks. We invite you to subscribe now and read today’s issue right away.
Sincerely,
Przemyslaw Radomski, CFA
Founder, Editor-in-chief


Gold Investment News
Delivered To Your Inbox
Free Of Charge
Bonus: A week of free access to Gold & Silver StockPickers.
Gold Alerts
More-
Status
New 2024 Lows in Miners, New Highs in The USD Index
January 17, 2024, 12:19 PM -
Status
Soaring USD is SO Unsurprising – And SO Full of Implications
January 16, 2024, 8:40 AM -
Status
Rare Opportunity in Rare Earth Minerals?
January 15, 2024, 2:06 PM

