
tools spotlight

-
Junior Miners Fell Hard – And Gold Didn’t Even Lift a Finger
June 23, 2022, 6:30 AMThere are numerous indications that junior miners are poised to set new lows on their downward path. Will they pull gold to the bottom as well?
Without Gold’s Help
The GDXJ, a proxy for junior miners, just closed at the second-lowest level since April 2020 – and that is huge. What does it mean?
Well, it means that profits on our short positions in juniors increased once again. However, there’s more to yesterday’s session than just that.
Namely, due to yesterday’s 2%+ decline in the GDXJ ETF, it’s now clear that junior miners practically can’t wait to move to lower levels, as they are declining even without much help from gold.
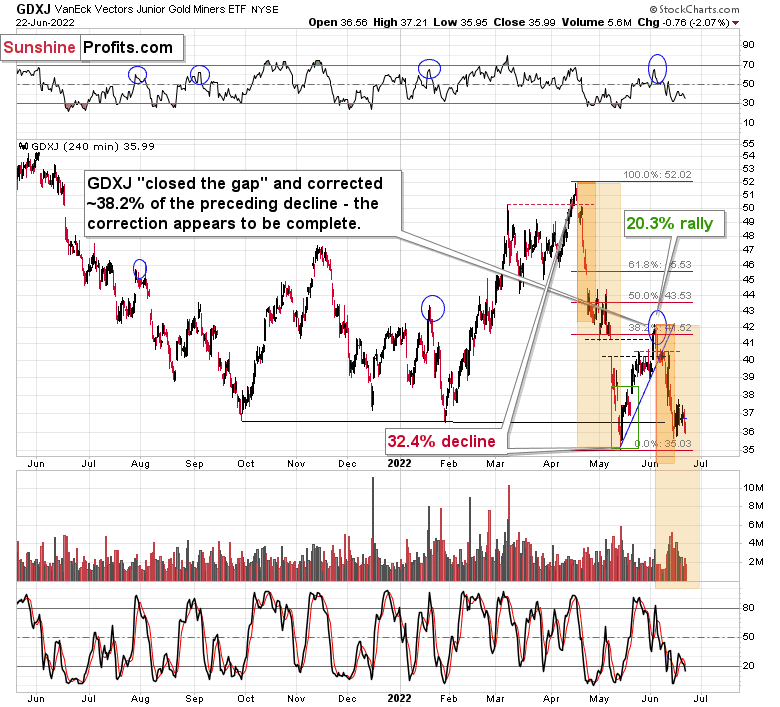
Without even getting into specific calculations, it’s clear that junior miners are now trading very close to their May lows.
What is even more interesting, the GDXJ closed below the September 2021 low, and it didn’t immediately rally back up. The fact that junior miners declined below this low yesterday without a significant bearish push from gold and from the general stock market tells us that this time, the breakdown below the September 2021 low is likely to be confirmed.
This, in turn, means that juniors appear to be finally ready to head to much lower levels.
Here We Go Again
When the GDXJ moved below those lows (on May 12), I wrote that they declined too far too fast, and I switched our short positions into long ones. However, this time, it’s not the case that they declined too far too fast. Conversely, junior miners are now at/after a brief pause. This means that they are ready to fall lower.
Additionally, please note how perfectly the current situation resembles what we saw at the end of April and in the first days of May. The decline that preceded that previous consolidation was bigger than the recent one, so it’s quite normal that the consolidation that followed this time was also smaller and not as volatile. Other than that, the two moves are alike. Since a big move lower followed the previous consolidation, another move lower appears likely this time as well.
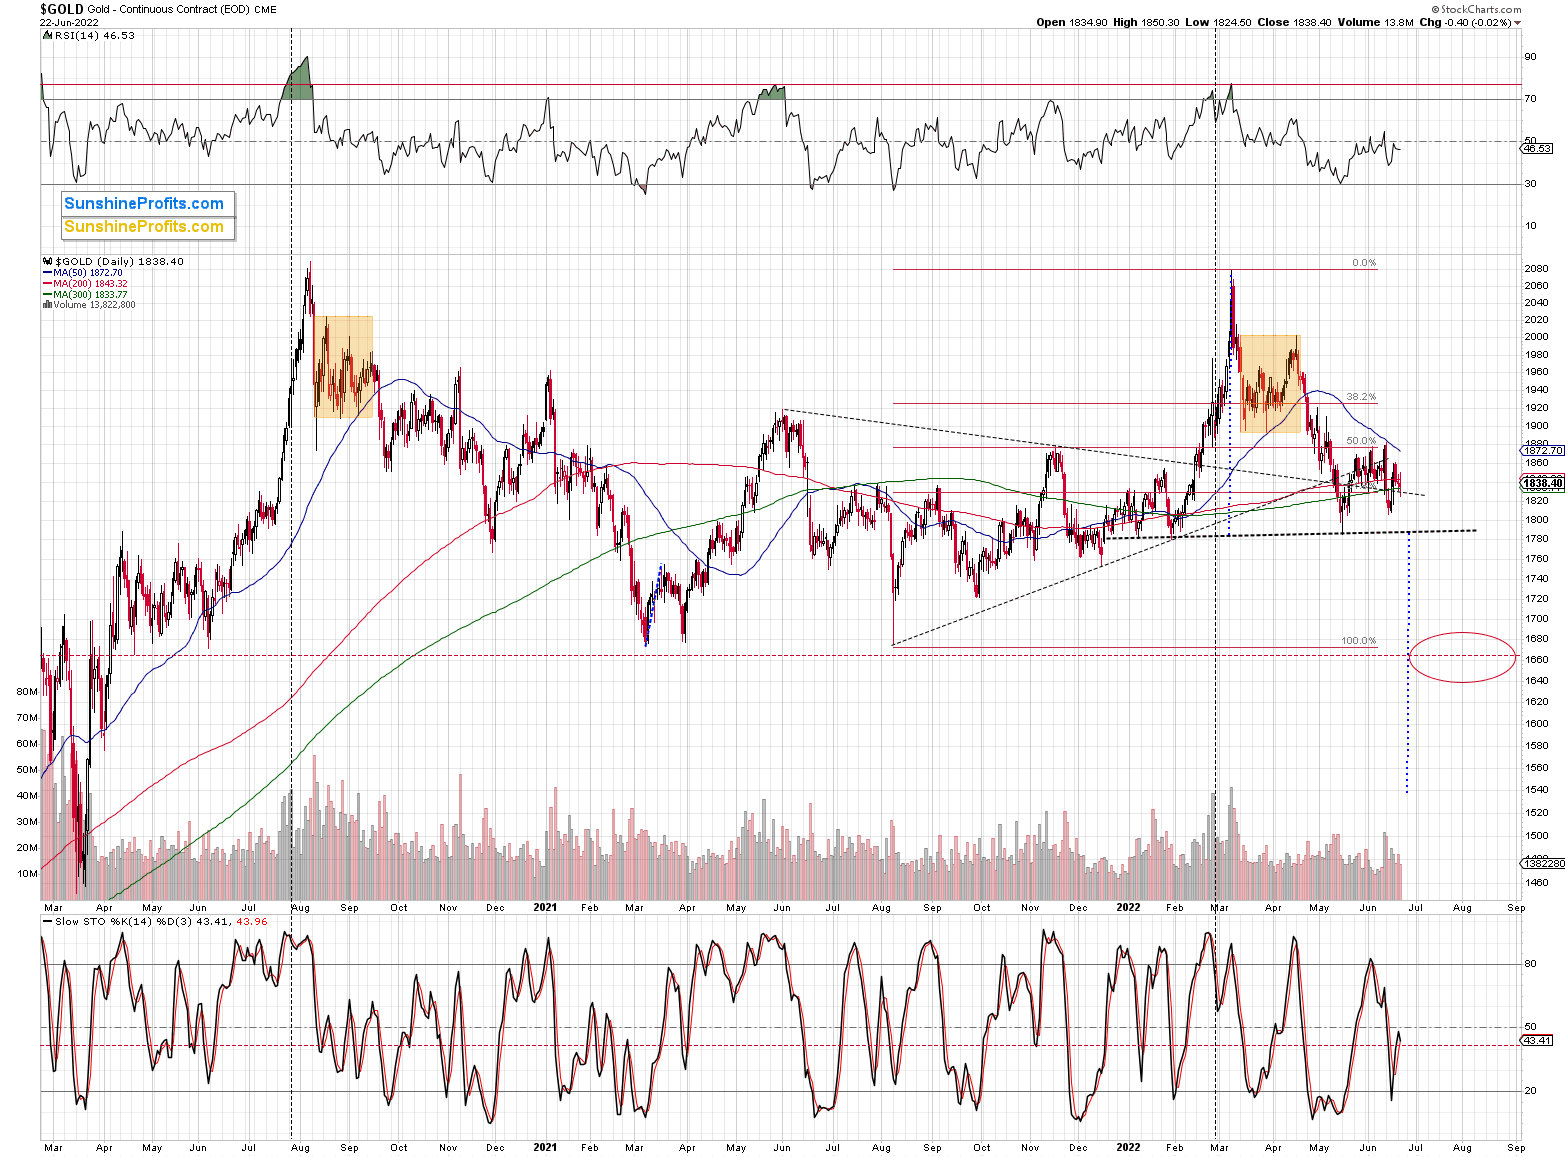
Also, as I wrote earlier, please keep in mind that juniors just declined without almost any help from gold. Unlike junior miners, gold is not at its September 2021 lows, and it’s not at its mid-May 2022 lows, either.
Miners tend to lead gold, and this time it’s quite clear that they are leading it lower.
Once the current consolidation in gold ends, it appears likely that gold will replicate (to a considerable extent) the decline that preceded the consolidation. This would imply a move back to gold’s previous 2021 lows.
This, in turn, would be likely to have a devastating impact on junior mining stock prices.
You have been warned.
Thank you for reading our free analysis today. Please note that the above is just a small fraction of the full analyses that our subscribers enjoy on a regular basis. They include multiple premium details such as the interim targets for gold and mining stocks that could be reached in the next few weeks. We invite you to subscribe now and read today’s issue right away.
Sincerely,
Przemyslaw Radomski, CFA
Founder, Editor-in-chief -
Is the Road to Recession in the American Economy Already Paved?
June 22, 2022, 7:26 AMWhile investors orchestrated a relatively immaterial short squeeze on Jun. 21, the daily optimism did little to resolve the fundamental headwinds that helped foster the S&P 500's 2022 collapse. Moreover, with the GDXJ ETF not participating in the festivities, the junior miners have fallen off investors' wish lists. Therefore, while the former's price action may have been bullish, the medium-term realities are far from it.
For example, Richmond Fed President Thomas Barkin said on Jun. 21: "We are in a situation where inflation is high, it's broad-based, it's persistent, and rates are still well below normal. The spirit is, you want to get back to where you want to go as fast as you can without breaking anything."
As a result, Barkin is on board with Chairman Jerome Powell's call for a 50 or 75 basis point rate hike in July.
Please see below:
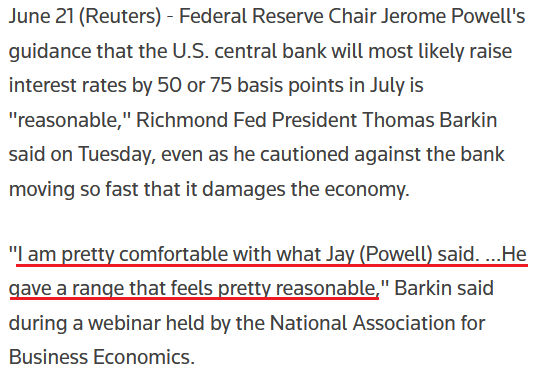 Source: Reuters
The Hangover
Likewise, Cleveland Fed President Loretta Mester said on Jun. 19 that “We at the Fed are very committed to using the tools at our disposal to bring this inflation under control and getting back to 2% is the No. 1 challenge in the economy now.”
Moreover, she also admitted:
“The recession risks are going up partly because monetary policy could have pivoted a little bit earlier than it did. We do have growth slowing to a little bit below trend growth and that’s okay.”
Thus, Fed officials are starting to acknowledge reality:
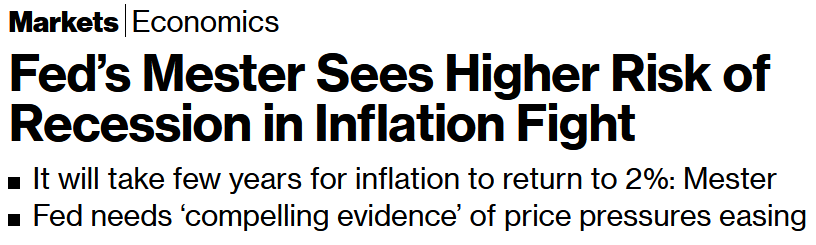 Source: Bloomberg
To that point, while “below trend growth” may be “okay” for now, further rate hikes will continue to pressure the U.S. economy. Moreover, all periods of unanchored inflation end in recession. For context, I wrote on May 26:
While 50 basis point rate hikes are likely to be done deals in June and July, a realization will only put the U.S. federal funds rate at 1.83%. With annualized inflation at 8%+, calming the price pressures with such little action is completely unrealistic. In fact, it’s never happened.
If you analyze the chart below, you can see that the U.S. federal funds rate (the green line) nearly always rises above the year-over-year (YoY) percentage change in the headline Consumer Price Index (the red line) to curb inflation. Therefore, investors are kidding themselves if they think the Fed is about to re-write history.
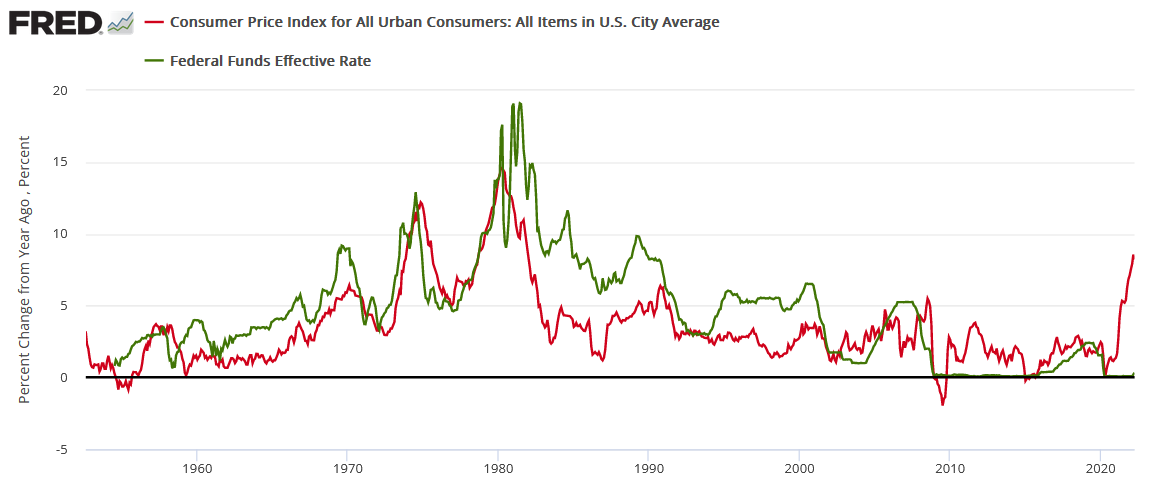
(…) The bottom line? Investors are running towards a cliff, and they don’t even know it. With nearly 70 years of history showing that unanchored inflation ends in a recession, the idea of doing so little and achieving a “soft landing” materially lacks credibility.
Supporting the thesis, Liberty Street Economics updated its dynamic stochastic general equilibrium (DSGE) model on Jun. 17. For context, the report includes “analysis from New York Fed economists working at the intersection of research and policy.”
Therefore, while the report was compiled by New York Fed researchers, “the views expressed are those of the authors, and do not necessarily reflect the position of the New York Fed or the Federal Reserve System.”
In any event, an excerpt read:
“According to the model, the probability of a soft landing – defined as four-quarter GDP growth staying positive over the next ten quarters – is only about 10 percent. Conversely, the chances of a hard landing – defined to include at least one quarter in the next ten in which four-quarter GDP growth dips below -1 percent, as occurred during the 1990 recession – are about 80 percent.”
Likewise, the team expects negative GDP growth in 2022 and 2023; and not only do they model an “80 percent” chance of a hard landing, but the downtrend is expected to continue for several months.
Please see below:
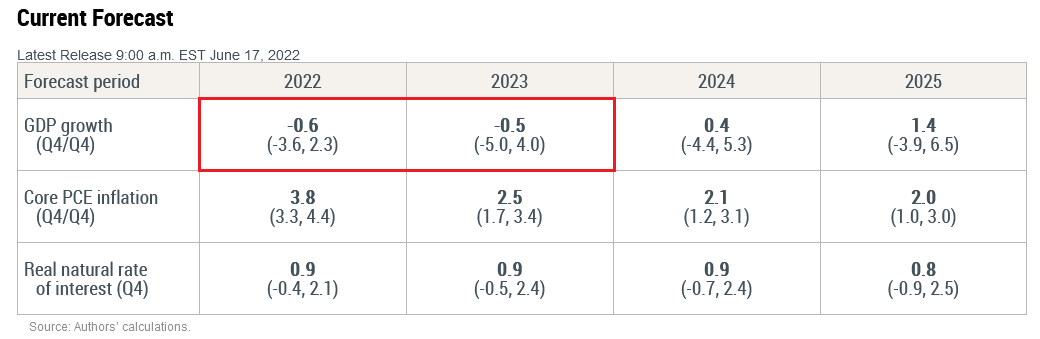 Source: New York Fed
 Therefore, while short-covering and the algorithms helped spur a relief rally, the Fed’s rate hike cycle should upend investors’ optimism in the months ahead. As a result, the S&P 500 and the PMs are likely to be far from medium-term bottoms.
Fuel for the Hawkish Fire
While I warned for months that investors and the Fed underestimated the demand side of the inflation equation, consumers' resiliency highlighted why the pricing pressures would not subside. As a result, the Fed would have to hike interest rates, and the forecast proved prescient.
Furthermore, nothing has changed. With the Cleveland Fed updating its inflation "Nowcast" on Jun. 21, researchers expect the headline Consumer Price Index (CPI) to increase by 0.98% month-over-month (MoM) and 8.67% year-over-year (YoY) in June. Thus, the Fed is far from winning its war on inflation.
Please see below:
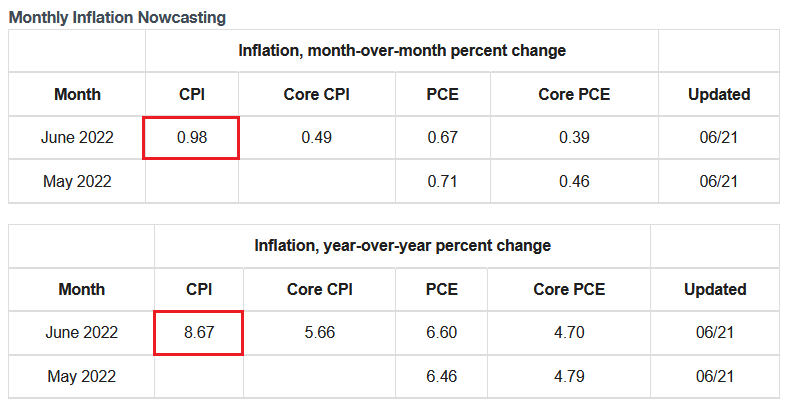 Source: Cleveland Fed
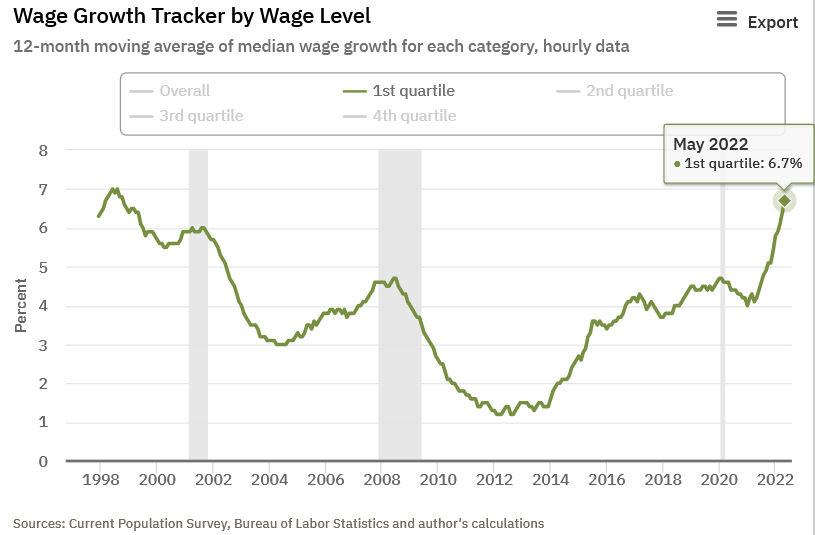
Second, the Atlanta Fed updated its wage tracker on Jun. 9. The data shows that consolidated wage inflation hit an all-time high in May.
Please see below:
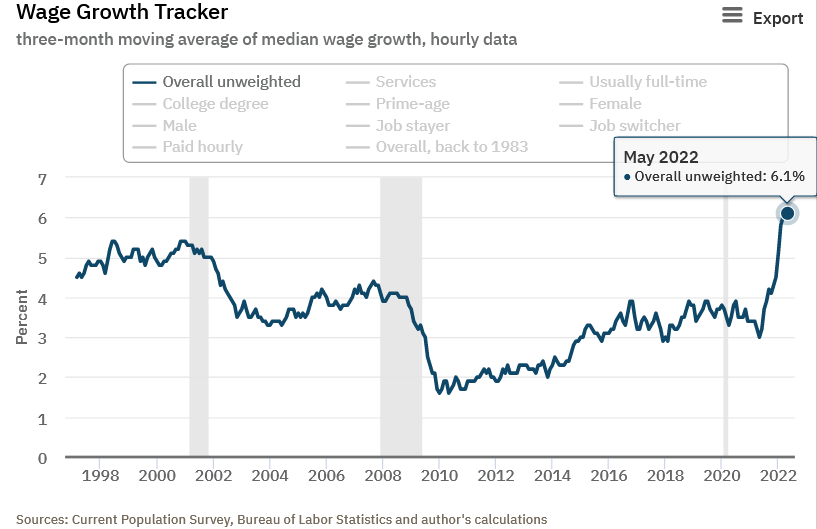
Moreover, the lowest-paid Americans outperformed, and the data highlights why consumer spending continues to fuel more price increases.
Please see below:
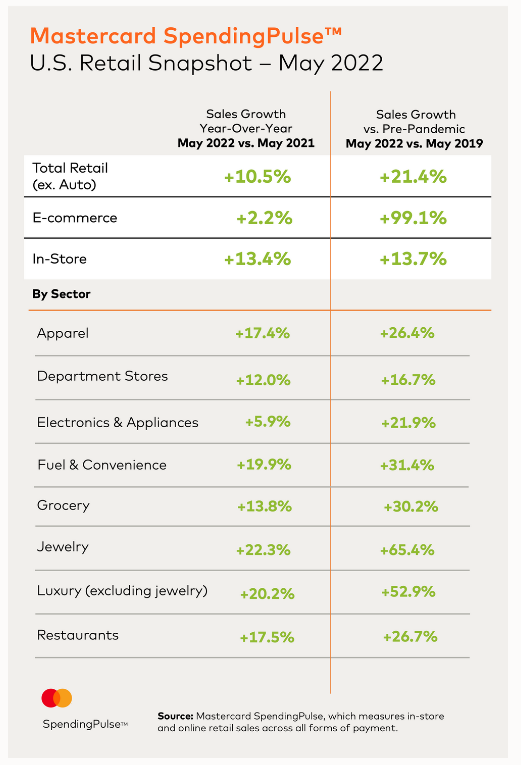
Speaking of which, Mastercard released its SpendingPulse retail sales report on Jun. 14. An excerpt read:
“Total U.S. retail sales excluding automotives increased 10.5% year-over-year in May, and 21.4% compared to pre-pandemic May 2019. This is outpacing the YoY monthly growth experienced thus far in 2022. In-store sales were a key driver, up 13.7% compared to pre-pandemic levels.”
U.S. Chief Economist Michelle Meyer said:
“The continued retail sales momentum in May aligns with the sustained growth rates we’ve seen so far this year. The consumer has been resilient, spending on goods and increasingly services as the economy continues to rebalance. That said, headwinds have become stronger – including gains in prices for necessities like gas and food, as well as higher interest rates."
Thus, while investors cry wolf about demand destruction, Mastercard’s data suggests otherwise. Moreover, the report highlights why more rate hikes are needed to cool inflation, and the prospect is bullish for the USD Index and U.S. real yields, and bearish for the PMs.
Please see below:
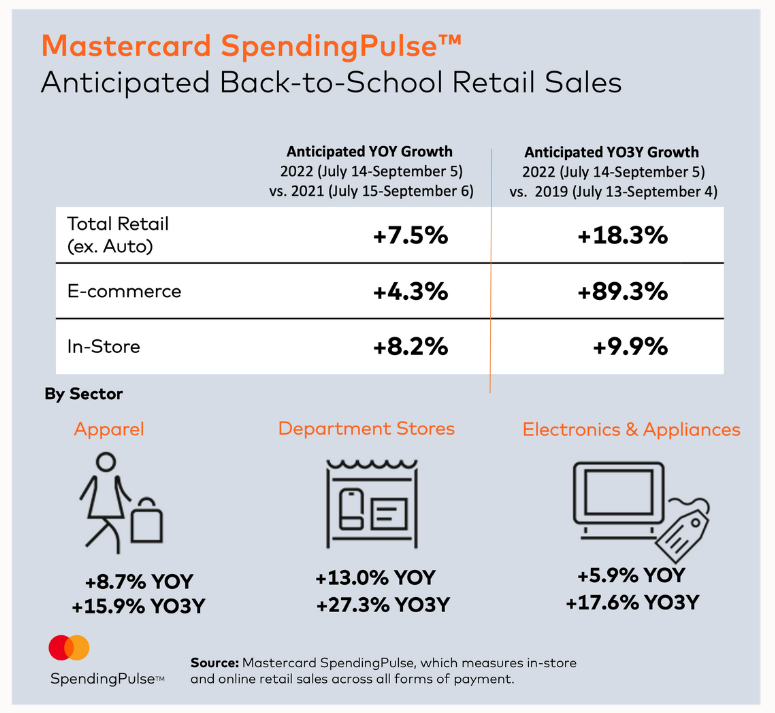
Likewise, Mastercard expects back-to-school sales to remain resilient in the months ahead. Therefore, such a realization will only add more fuel to the hawkish fire. The report stated:
“As we look ahead to the critical mid-July through Labor Day back-to-school period, U.S. retail sales are expected to grow 7.5% excluding automotive compared to 2021. Sales are anticipated to be up 18.3% compared to pre-pandemic 2019, with Department Stores expected to be a noteworthy winner as the sector continues its recent rebound.”
Please see below:
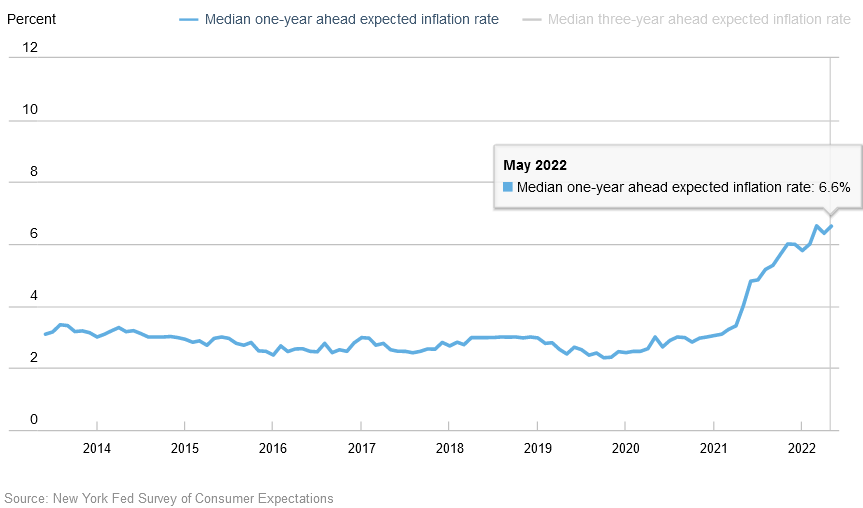
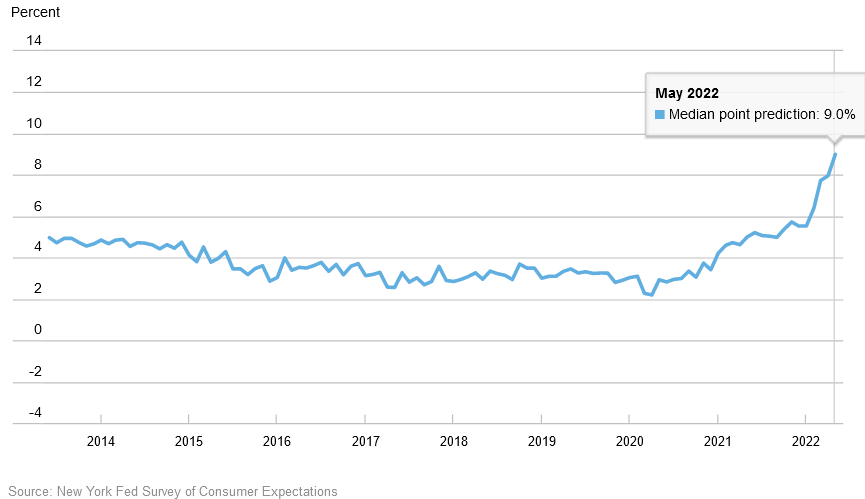
As further evidence, the New York Fed released its Survey of Consumer Expectations on Jun. 13. The report revealed:
“The one-year ahead median inflation expectations increased from 6.3% to 6.6% in May, tying the highest reading of the series since the inception of the survey in June 2013. In contrast, the median three-year-ahead inflation expectations remained unchanged at 3.9%.”
Please see below:
More importantly:
“Median household nominal spending growth expectations increased sharply to 9.0% from 8.0% in April. This is the fifth consecutive increase and a new series high. The increase was most pronounced for respondents between the age of 40 and 60 and respondents without a college education.”
Please see below:
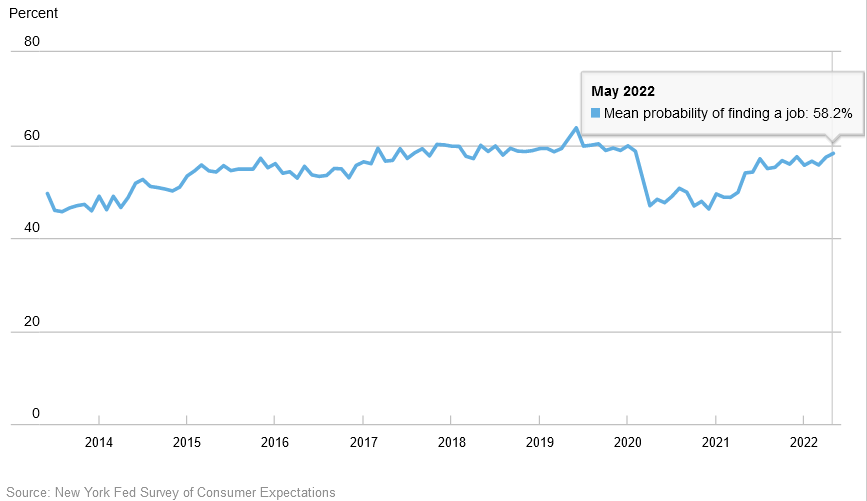
Also noteworthy:
“The mean perceived probability of finding a job (if one’s current job was lost) increased from 57.4% in April to 58.2%, its highest value since February 2020. The increase was driven by respondents over 40, those without a college education and those with lower household incomes (under $50,000).”
As a result, when Americans are confident about their employment prospects and wages are rising rapidly, the cocktail is profoundly inflationary. Moreover, when you add on Americans' bloated bank accounts, it's no wonder inflation proved much longer-lasting than many expected. To explain, I wrote on Dec. 23:
While the fiscal spending spree may end, U.S. households are flush with cash. U.S. households have nearly $3.54 trillion in their checking accounts. For context, this is 253% more than Q4 2019 (pre-COVID-19) (…).
While some investors expect a dovish 180 from the Fed, they shouldn’t hold their breath. With U.S. economic growth still resilient and the U.S. consumer in much better shape than some portray, the Fed can raise interest rates without crashing the U.S. economy. As a result, Powell will likely stick to his hawkish script and forge ahead with rate hikes in 2022.
I updated on Jun. 10:
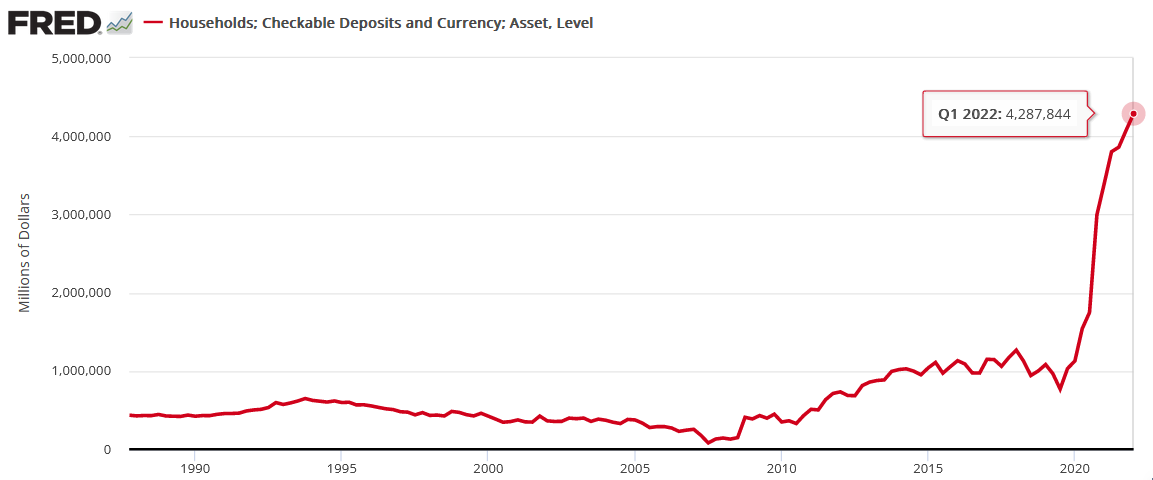
While the prediction proved prescient, U.S. households, on aggregate, are still flush with cash. For example, the Fed released its Financial Accounts of the United States report on Jun. 9. It revealed that U.S. households have nearly $4.288 trillion in their checking accounts as of the end of Q1. Moreover, the figure is 5.1% higher than Q4:2021.
For the sake of objectivity, the data lags by roughly two months. However, with the metric at an unprecedented all-time high, U.S. consumers still have plenty of spending power. As a result, more hawkish policy is needed to create the demand destruction necessary to tame inflation.
Please see below:
The Bottom Line
Despite the S&P 500’s daily optimism, the Fed’s catch-22 is worsening by the day. With GDP growth slowing and the U.S. housing market suffering mightily from higher interest rates, signs of stress are present. In contrast, with U.S. consumers continuing their spending spree, inflationary demand keeps shifting from one category to the next. Thus, the Fed is stuck trying to balance these competing forces. However, the road to recession has likely already been paved, and material re-pricings are necessary for assets to reflect their fundamental values.
In conclusion, the PMs were mixed on Jun. 21, as silver and the GDX ETF ended the day in the green. However, with the Fed hawked up and rate hikes on autopilot for the foreseeable future, the PMs’ medium-term outlooks are profoundly bearish. As a result, summer swoons should be on the horizon.
Thank you for reading our free analysis today. Please note that the above is just a small fraction of the full analyses that our subscribers enjoy on a regular basis. They include multiple premium details such as the interim targets for gold and mining stocks that could be reached in the next few weeks. We invite you to subscribe now and read today’s issue right away.
Sincerely,
Przemyslaw Radomski, CFA
Founder, Editor-in-chief -
The Fed’s Hawkish Bite Left Its Mark on the S&P 500 Stocks
June 21, 2022, 8:40 AMBy raising interest rates, the Fed poured cold water on the red-hot markets and finally chilled investors' enthusiasm. What's next for asset prices?
Work in Progress
With the Fed’s hawkish hammer pounding the financial markets, the selling pressure coincided with events unseen since 2008. Moreover, with the work in progress to reduce inflation poised to push asset prices even lower, I’ve long warned that we’re likely far from a medium-term bottom. For example, I wrote on May 31:
With recession fears decelerating and optimism returning to Wall Street, the bulls are brimming with confidence.
Please see below:
 Source: Investing.com
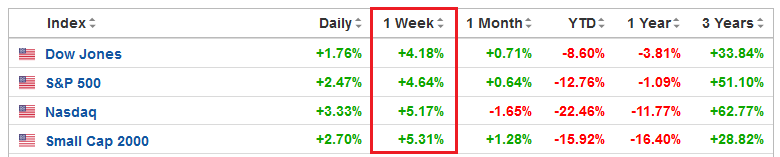
(…) [However], while U.S. stock indices rallied sharply last week, guess what else participated in the festivities?
 Source: Investing.com
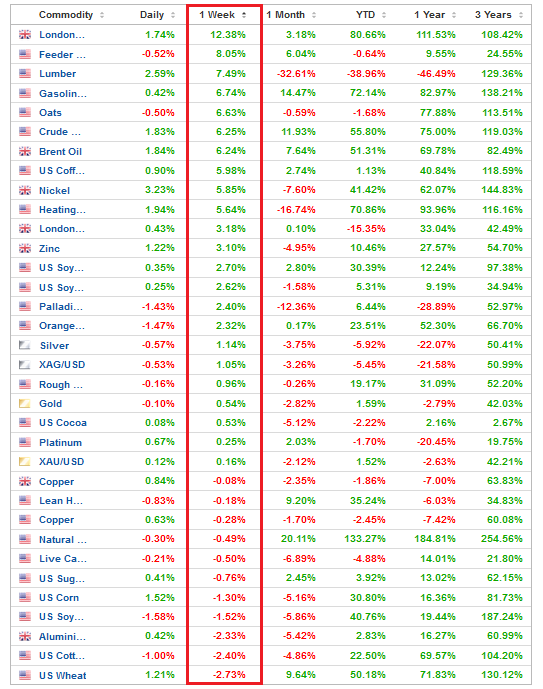
To explain, the table above tallies the performance of commodities over various time periods. If you analyze the vertical red rectangle, notice how most commodities rallied alongside equities. As a result, the thesis was on full display.
When economic optimism elicits rallies on Wall Street, that same optimism uplifts commodities. Therefore, if the Fed tries to appease investors and passively attack inflation, it will only spur more inflation.
As such, the idea of a “positive feedback loop” where ‘stocks rally, inflation cools [and] Fed tightening expectations abate” is extremely unrealistic. In fact, it’s the exact opposite. The only bullish outcome is if economically-sensitive commodities collapse on their own. Then, input inflation would subside and eventually cool output inflation, and the Fed could turn dovish.
However, the central bank has been awaiting this outcome for two years. Thus, my comments from Apr. 6 remain critical. If investors continue to bid up stock prices, the follow-through from commodities will only intensify the pricing pressures in the coming months. Therefore, investors are flying blind once again.
To that point, the S&P 500 reversed sharply over the last several days, and the S&P Goldman Sachs Commodity Index (S&P GSCI) followed suit.
For context, the S&P GSCI contains 24 commodities from all sectors: six energy products, five industrial metals, eight agricultural products, three livestock products, and two precious metals. However, energy accounts for roughly 54% of the index’s movement.
Please see below:
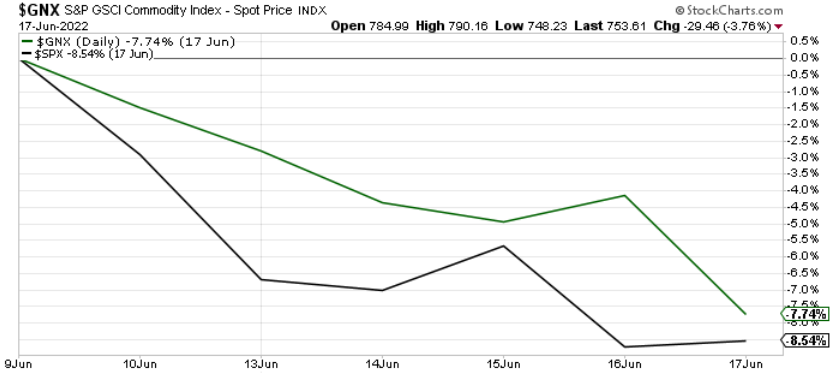
To explain, the green line above tracks the S&P GSCI, while the black line above tracks the S&P 500. As you can see, hawkish rhetoric and a 75 basis point rate hike had their desired effect.
Furthermore, I warned on Apr. 6 that higher asset prices are antithetical to the Fed’s 2% inflation goal. In a nutshell: the more the bull gores, the more inflation bites. I wrote:
Please remember that the Fed needs to slow the U.S. economy to calm inflation, and rising asset prices are mutually exclusive to this goal. Therefore, officials should keep hammering the financial markets until investors finally get the message.
Moreover, with the Fed in inflation-fighting mode and reformed doves warning that the U.S. economy “could teeter” as the drama unfolds, the reality is that there is no easy solution to the Fed’s problem. To calm inflation, it has to kill demand. As that occurs, investors should suffer a severe crisis of confidence.
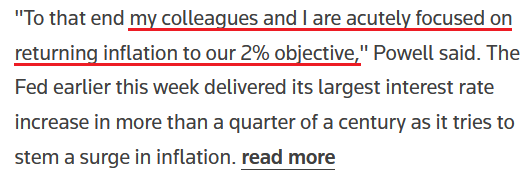
Speaking of which, the fundamental thesis continues to unfold as expected. For example, Fed Chairman Jerome Powell said on Jun. 17: “The Federal Reserve’s strong commitment to our price stability mandate contributes to the widespread confidence in the dollar as a store of value.” Moreover, “The Fed’s commitment to both our dual mandate and financial stability encourages the international community to hold and use dollars.”
As a result, while I’ve long warned that unanchored inflation would elicit a hawkish response from the Fed and uplift the USD Index, the man at the top remains focused on the task at hand.
Please see below:
 Source: Reuters
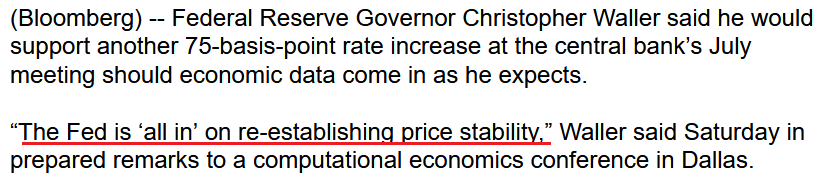
Likewise, Fed Governor Christopher Waller said on Jun. 18:
“This week, the FOMC took another significant step toward achieving our inflation objective by raising the Federal Funds rate target by 75 basis points. In my view, and I speak only for myself, if the data comes in as I expect I will support a similar-sized move at our July meeting.”
Please see below:
 Source: Bloomberg
Thus, while I’ve been warning for months that the Fed isn’t bluffing, investors are suffering the consequences of their short-sighted expectations. For context, I wrote on Dec. 23, 2021:
Please note that when the Fed called inflation “transitory,” I wrote for months that officials were misreading the data. As a result, I don’t have a horse in this race. However, now, they likely have it right. Thus, if investors assume that the Fed won’t tighten, their bets will likely go bust in 2022.
Continuing the theme, Atlanta Fed President Raphael Bostic said on Jun. 17: "We're attacking inflation and we're going to do all that we can to get it back down to a more normal level, which for us has got to be 2%. We'll do whatever it takes to make that happen."
As a result, the more investors bid up stock and commodity prices, the more "muscular" the Fed's policies become.
Please see below:
 Source: Reuters
Thus, while Fed officials continue to press down on the hawkish accelerator, the plight of many financial assets highlights the ferocity of central bankers’ war against inflation. Moreover, with all bouts of unanchored inflation ending in recessions over the last ~70 years, more fireworks should erupt in the months ahead.
Short Squeeze 2.0
It’s important to remember that financial assets don’t move in a straight line. Therefore, while the fundamental outlook continues to deteriorate, the algorithms may spot bullish short-term trends that let the scalpers profit in the interim. For example, I noted on Jun. 15 that one-sided positioning could (and eventually did) spark a relief rally. I wrote:
The liquidation frenzy (margin calls) that erupted recently coincided with hedge funds going on the largest two-day selling spree on record. If you analyze the chart below, you can see that Goldman Sachs’ prime brokerage data shows the z-score of combined net dollars sold on Jun. 10 and Jun. 13 exceeded the sell-off following the collapse of Lehman Brothers in 2008.
Thus, while it’s far from a sure thing, it’s prudent to note how these variables may impact the short-term price action.
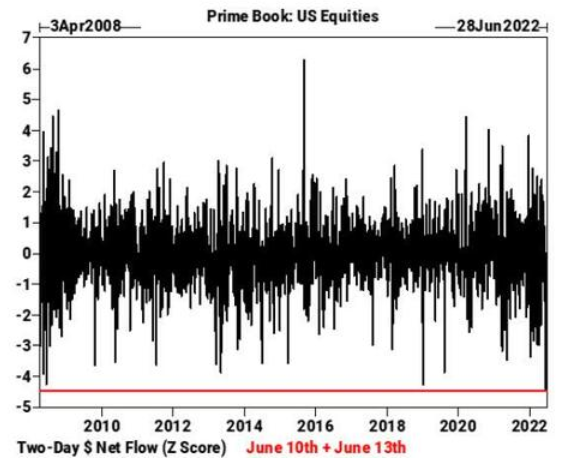 Source: Goldman Sachs
To that point, last week's sell-off has too many market participants on one side of the boat. As a result, don't confuse a short squeeze with bullish price action.
Please see below:
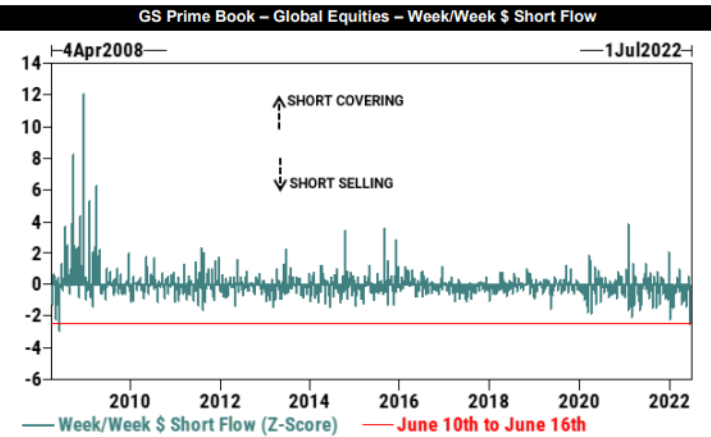 Source: Goldman Sachs
To explain, the blue bars above track the short-selling and short-covering activity of Goldman Sachs' hedge fund clients. If you analyze the red line at the bottom, you can see that the z-score of hedge funds' weekly short sales was the highest since April 2008.
In a nutshell: hedge funds shorted more stocks as the S&P 500 declined, leaving them highly exposed to a short squeeze. As a result, if the markets rally, consider the price action within the context of the above data.
Likewise, oversold conditions are also present.
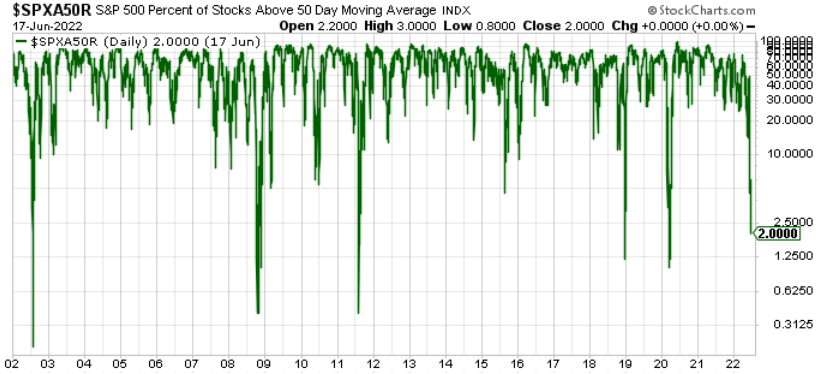
To explain, the green line above tracks the percentage of S&P 500 stocks above their 50-day moving average. If you analyze the right side of the chart, you can see that only 2% of S&P 500 constituents hold the key level, and the reading is abnormally low.
For context, it’s a contrarian indicator, meaning that too much pessimism often elicits a short-term reversion. Moreover, with the dot-com bubble, the global financial crisis (GFC), the 2011 growth scare, the COVID-19 crash, and the 2018 sell-off the only periods with lower readings, it may take a shock-and-awe event to move the metric lower in the short term.
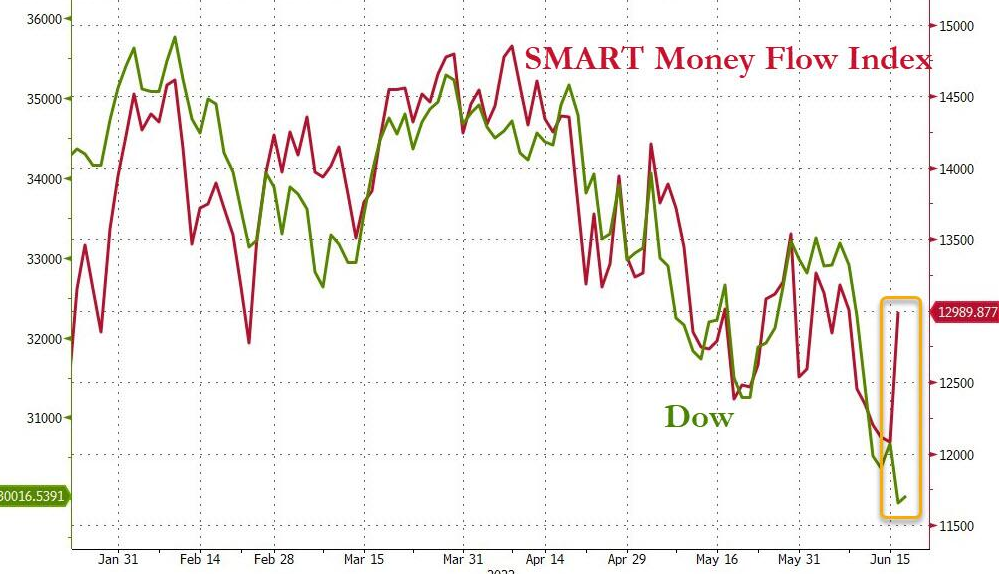
Also noteworthy, Bloomberg’s SMART Money Flow Index diverged from the Dow Jones Industrial Average (DJIA) late last week. For context, the indicator gauges the behavior of ‘smart’ investors that trade during the final hour of the day.
Please see below:
 Source: Bloomberg/Zero Hedge
To explain, the green line above tracks the DJIA, while the red line above tracks Bloomberg’s SMART Money Flow Index. If you analyze the right side of the chart, you can see that the smart money expects some selling reprieve.
Finally, Bank of America’s Bull & Bear Indicator is at its lowest possible level. Again, this uses contrarian methodology, emphasizing how bearish over-positioning can spark sentiment shifts.
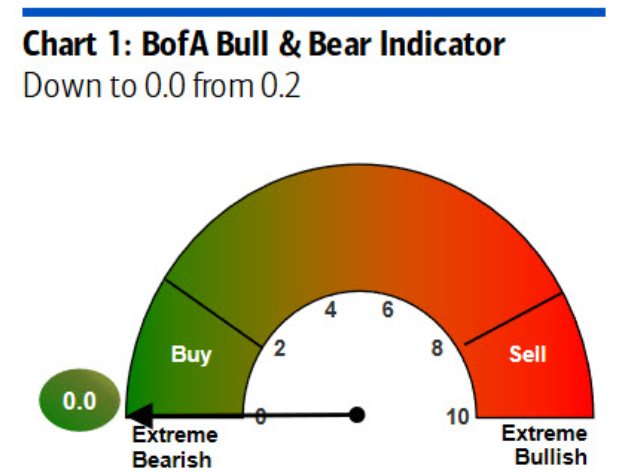 Source: Bank of America
The Bottom Line
There have been several fits and starts along the GDXJ ETF’s path to lower prices, and the medium-term fundamentals remain profoundly bearish. However, rallies can increase investors’ anxiety if they’re unsure of why the optimism has manifested. As a result, while the contrarian bullish stock data may uplift the PMs in the short term, a potential sentiment reversion doesn’t impact their medium-term outlooks.
Moreover, with the Fed hawked up and the developments bullish for the USD Index and U.S. real yields, the S&P 500 and the PMs should confront lower lows in the months ahead.
In conclusion, the PMs declined on Jun. 17, as volatility has asset prices gyrating sharply by the day. However, the frantic buying/selling activity is bearish and highlights the fragility of the financial markets. Therefore, more bouts of panic should erupt in the coming months, even if the selling pressure subsides in the near term.
Thank you for reading our free analysis today. Please note that the above is just a small fraction of the full analyses that our subscribers enjoy on a regular basis. They include multiple premium details such as the interim targets for gold and mining stocks that could be reached in the next few weeks. We invite you to subscribe now and read today’s issue right away.
Sincerely,
Przemyslaw Radomski, CFA
Founder, Editor-in-chief -
GDXJ: The Second Part of the Big Drop Knocks on the Door
June 20, 2022, 7:52 AMAvailable to premium subscribers only.
Thank you for reading our free analysis today. Please note that the above is just a small fraction of the full analyses that our subscribers enjoy on a regular basis. They include multiple premium details such as the interim targets for gold and mining stocks that could be reached in the next few weeks. We invite you to subscribe now and read today’s issue right away.
Sincerely,
Przemyslaw Radomski, CFA
Founder, Editor-in-chief -
No Rosy Future Lies Ahead Gold Miners in the Stock World
June 17, 2022, 9:40 AMIf history is any guide, either a big or an enormous decline awaits gold stock prices. That’s very bearish for the precious metals market.
Here Comes the Replay
Let’s not forget about the forest while looking at individual trees. By that, I mean looking at how gold stocks perform relative to gold. That’s one of the major indications that the current situation is just like what we saw at the 2012 top.
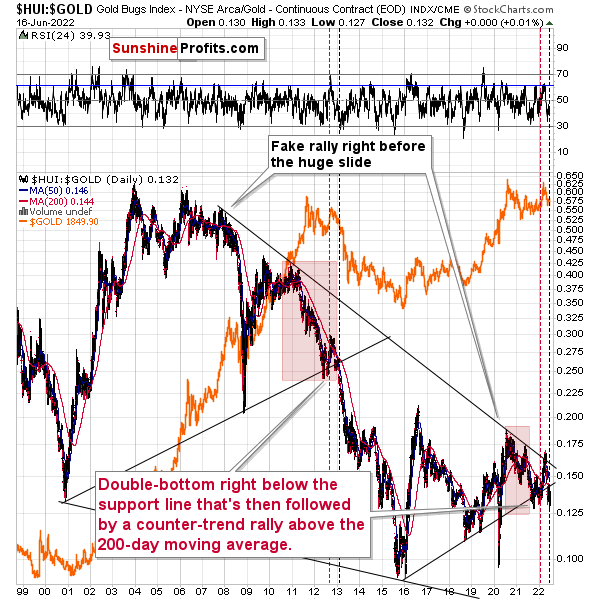
The situation in the gold stock to gold ratio is similar to what we saw in late 2012 and early 2013. The HUI to gold ratio invalidated its first attempt to break lower (marked with red, dashed lines), but after a corrective upswing, it then broke lower more decisively. That’s what I marked using black, dashed lines.
If the history is to rhyme, we’re about to see a profound decline.
Also, please note that the pattern that we currently see, which started in early 2016, is somewhat similar to what happened between 2003 and 2008.
Back in 2008, the breakdown from the consolidation resulted in sharply lower ratio values and much lower prices of gold stocks.
So, if the situation is analogous to 2012-2013, we’re likely to see a big decline in the following weeks/months, and if it’s analogous to 2008, we’re likely to see an enormous decline in the following weeks/months.
Declining stock prices would only add fuel to the bearish fire (after all, gold stocks are… stocks) and that’s exactly what’s likely to happen.
The Bearish Outlook for Precious Metals
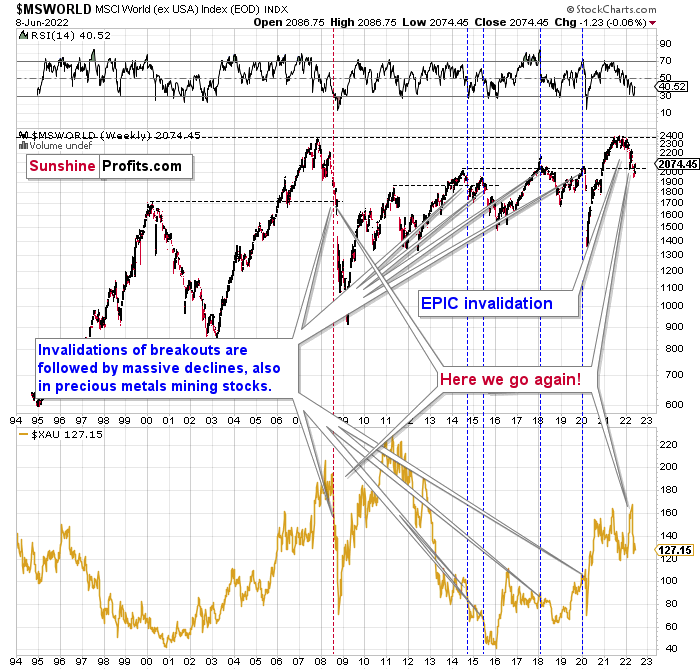
The technical picture in the case of world stocks remains extremely bearish, and my previous comments on it were just confirmed. Here’s what I’ve been writing about the above chart for quite a few weeks now:
World stocks have already begun their decline, and based on the analogy to the previous invalidations, the decline is not likely to be small. In fact, it’s likely to be huge.
For context, I explained the ominous implications on Nov. 30. I wrote:
Something truly epic is happening in this chart. Namely, world stocks tried to soar above their 2007 high they managed to do so, and… failed to hold the ground. Despite a few attempts, the breakout was invalidated. Given that there were a few attempts and that the previous high was the all-time high (so it doesn’t get more important than that), the invalidation is a truly critical development.
It's a strong sell signal for the medium - and quite possibly for the long term.
From our – precious metals investors’ and traders’ – point of view, this is also of critical importance. All previous important invalidations of breakouts in world stocks were followed by massive declines in mining stocks (represented by the XAU Index).
Two of the four similar cases are the 2008 and 2020 declines. In all cases, the declines were huge, and the only reason why they appear “moderate” in the lower part of the above chart is that it has a “linear” and not a “logarithmic” scale. You probably still remember how significant and painful (if you were long, that is) the decline at the beginning of 2020 was.
Now, all those invalidations triggered big declines in the mining stocks, and we have “the mother of all stock market invalidations” at the moment, so the implications are not only bearish, but extremely bearish.
World stocks have declined below their recent highs, and when something similar happened in 2008, it meant that both stocks and gold and silver mining stocks (lower part of the chart) were about to slide much further.
The medium-term implications for mining stocks are extremely bearish.
Let’s take a look at the U.S. stock market.
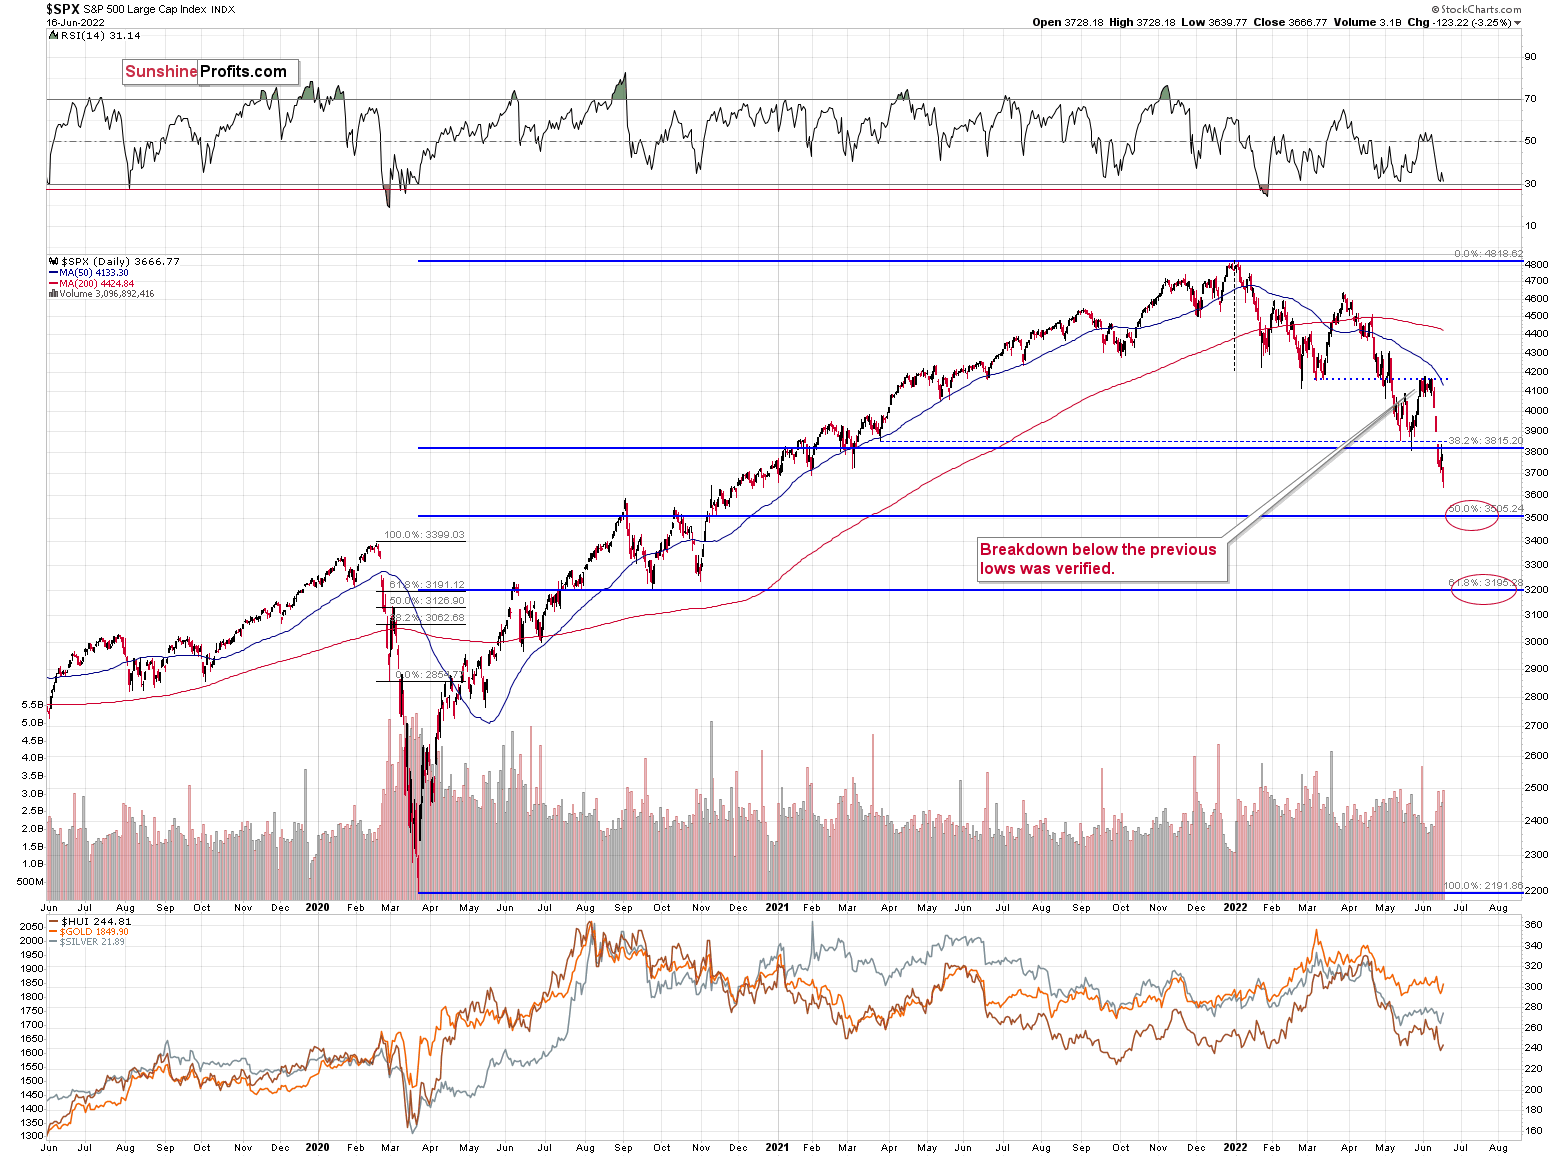
Stocks verified their breakdown below the Q1 2022 low and then they declined. They broke below the May low, and they corrected a bit after the rate hike announcement, but they didn’t invalidate the breakdown. This means that the breakdown is almost fully confirmed.
The S&P 500 is unlikely to fall below 3,700 this week due to specific positioning in the options market, but it may do so next week.. At the time of writing these words, the S&P 500 futures are trading at around 3,704.
A weekly close below the May lows would be a very bearish indication for the following days and weeks, and as investors have more time to digest this critical information, their willingness to sell in the following week would likely grow.
The implications for the precious metals market, especially for silver and mining stocks, are very bearish.
Thank you for reading our free analysis today. Please note that the above is just a small fraction of the full analyses that our subscribers enjoy on a regular basis. They include multiple premium details such as the interim targets for gold and mining stocks that could be reached in the next few weeks. We invite you to subscribe now and read today’s issue right away.
Sincerely,
Przemyslaw Radomski, CFA
Founder, Editor-in-chief


Gold Investment News
Delivered To Your Inbox
Free Of Charge
Bonus: A week of free access to Gold & Silver StockPickers.
Gold Alerts
More-
Status
New 2024 Lows in Miners, New Highs in The USD Index
January 17, 2024, 12:19 PM -
Status
Soaring USD is SO Unsurprising – And SO Full of Implications
January 16, 2024, 8:40 AM -
Status
Rare Opportunity in Rare Earth Minerals?
January 15, 2024, 2:06 PM

