
tools spotlight

-
Ignorance Always Backfires. Pay Attention to Gold Miners!
August 18, 2021, 7:15 AMThe junior mining stocks’ extreme underperformance is the “new normal” that barely anyone talks about. Ignorance is pleasant, but it comes at a cost.
To be clear: it’s something very important right now. Juniors, as well as senior mining stocks, are very weak compared to gold, which means that they are not reacting to gold’s gains but multiplying gold’s declines instead. This doesn’t just mean that the profits on our short positions in juniors are increasing almost constantly – it also means that the entire precious metals sector is about to fall much further. This kind of underperformance preceded the 2013 slide, and we haven’t seen it – to this extent – in years. This is huge.
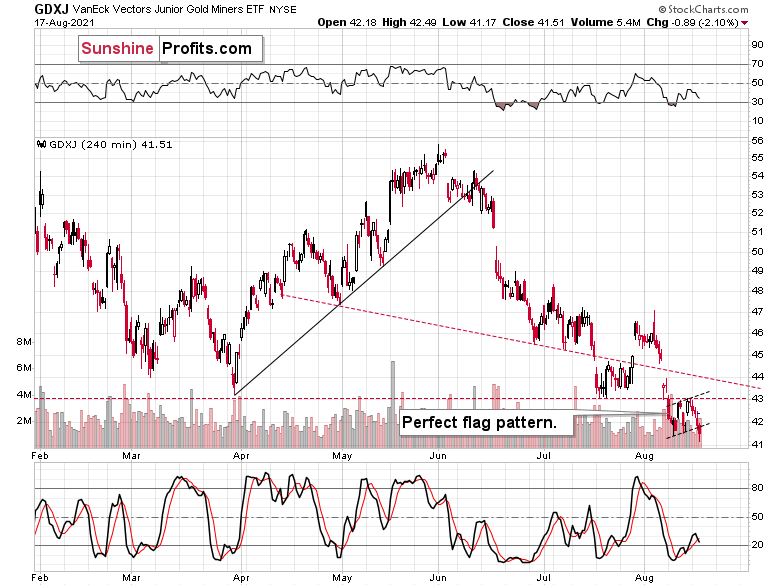
Junior gold miners – the GDXJ ETF – just moved to new 2021 lows after completing a flag pattern. This is bearish not only on its own but especially when compared to what gold did.
And gold….
Gold moved just $2 lower yesterday. This near-nothing was enough to trigger a breakdown to new lows in the related sector – junior mining stocks. Gold junior miners’ current performance is truly one of the weakest that I’ve ever seen.
And just imagine what horrors await the prices of the mining stocks if a mere $2 decline in gold was enough to trigger a breakdown to new lows. And gold seems to be about to slide once again!
Now, based on the triangle-vertex-based reversal that’s due on Monday, it could be the case that gold waits a bit before sliding. However, given the similarity to how it declined in the first quarter of the year, it seems that the top in gold is either in or at hand.
I explained the similarity to Q1 before, but here’s a quick recap.
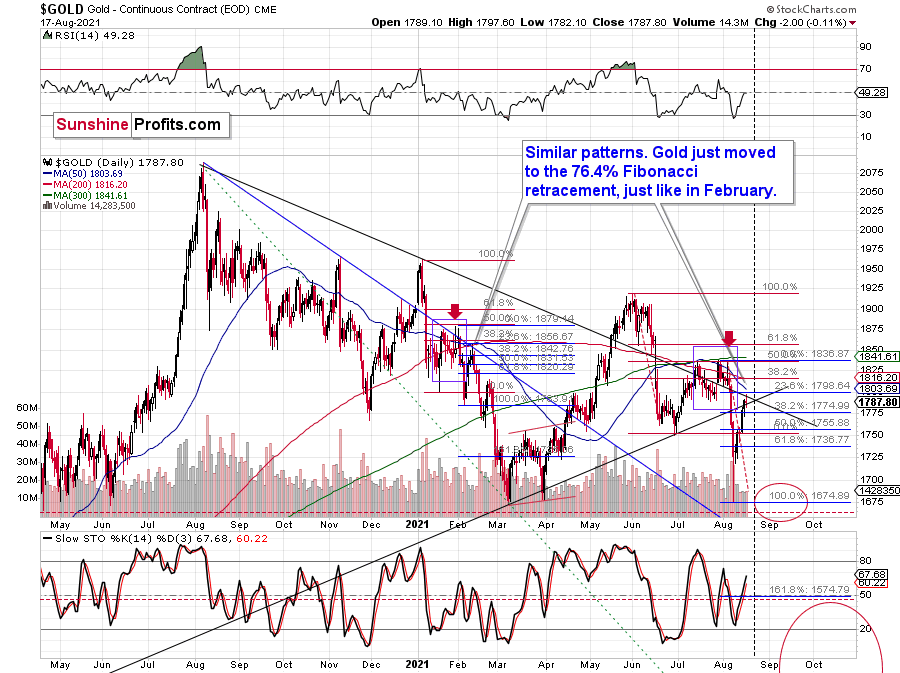
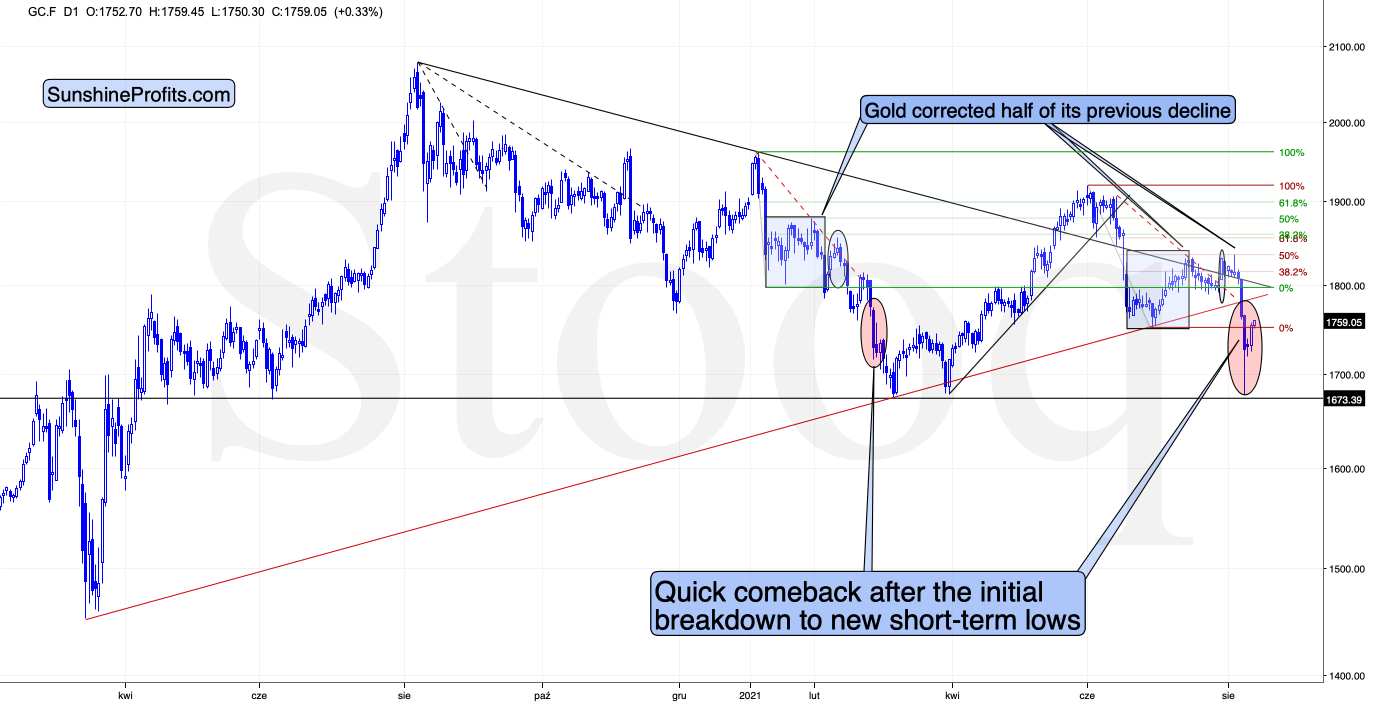
After declining sharply (January and June) and forming a double bottom with the second bottom slightly lower, it then corrected half of the decline forming more than one top close to the 50% retracement and then declined sharply once again.
Back in February 2021, gold corrected about 76.4% of the decline (which is a less popular but still a Fibonacci retracement level – marked with blue). Right now, this retracement is just below the $1,800 mark. So, if history rhymes once again, gold will be likely to move close to $1,800 and then decline once again.
I’ve recently been asked to compare the performance of the 10-year yields and gold on one chart and to comment on them.
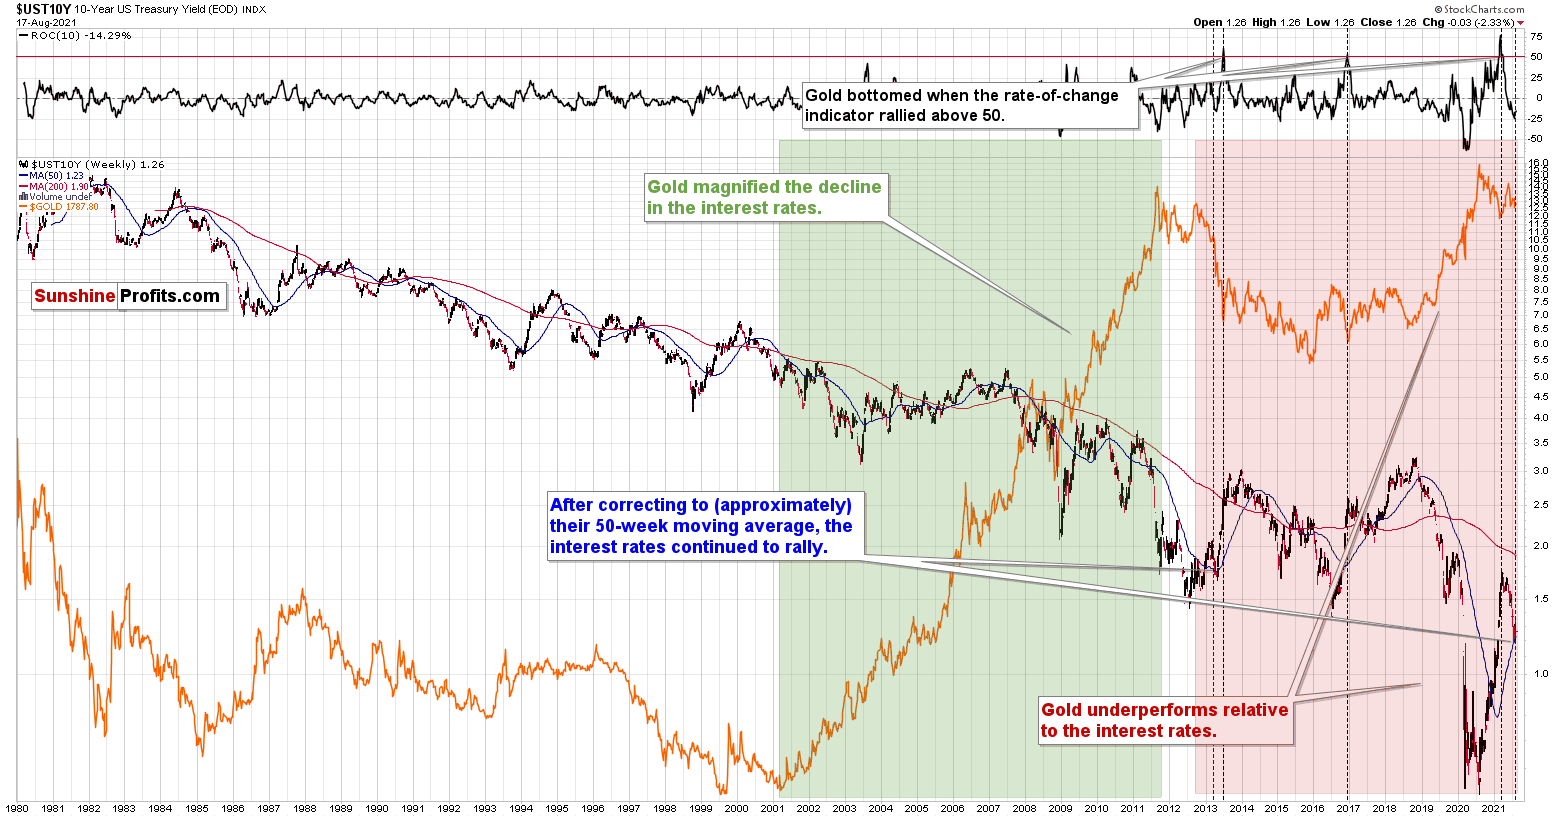
There are a couple of interesting things that the 10-year-yield chart and gold can tell us.
One of them is that when the ROC (rate of change) indicator based on the yields rallies above 50, it tends to correspond to medium-term bottoms in gold. This happened 3 times in the past 40+ years, and it worked in each case. This is likely to be important in a couple of months, but it's not that relevant today.
Another interesting feature is that, overall, gold has not been performing well relative to the long-term yields. Between 2001 and 2011, gold was performing very well relative to yields – soaring when the yields were declining. However, that has not been the case since late 2012. Sure, gold managed to briefly move above its 2011 highs before invalidating the breakout and declining, but please compare how huge a decline in yields it took to trigger this move.
The decline in rates that made gold more than double its price from the 2008 bottom was relatively small (from ~2% to about ~1.5%). And the decline in yields from 1.5% in mid-2019 to about 0.5% in mid-2020 made gold increase its value by “only” 1/3. Again – a decade ago it took half a percentage point to make gold double, and now it took a full percentage point to make gold increase its value by only 1/3. Sure, 1/3 of gold’s price is a lot on a nominal level, but when compared to doubling its value, it’s much smaller. And when compared with the size of the moves in rates, it turns out that gold was now about 6 times less inclined to rally when the rates declined.
This seems bearish for gold at first glance, and it is such in reality.
The final observation is the most concrete and the most actionable. As I described in my previous gold trading analyses, what we are seeing now in gold is very similar to what we saw in 2012-2013, and the above-mentioned super-weak performance of gold stocks confirms it.
What’s very interesting is that after gold’s final top and yield’s final bottom (mid-2012), the yields rallied, and then they corrected to more or less their 50-week moving average. And when that was taking place, gold moved close to their previous lows (that was before the biggest part of the plunge).
Why would the above be very interesting? Because gold is also after a corrective upswing and the yields are after a corrective downswing that took them to more or less their 50-week moving average. If history rhymes, it seems that we’re about to see another big move higher in the rates and another big move lower in the price of gold.
The Economic Symposium in Jackson Hole and the news coming from it could trigger the above-mentioned moves. The September FOMC is another candidate. Then again, since markets are forward-looking, any piece of news that could hint at the upcoming tapering could trigger the moves. That’s what the weak performance of gold juniors vs. gold tells us – the market is ready to slide, and when the trigger comes is not that important. In fact, the precious metals market is likely to decline even without a specific news-based trigger.
Thank you for reading our free analysis today. Please note that the above is just a small fraction of the full analyses that our subscribers enjoy on a regular basis. They include multiple premium details such as the interim targets for gold and mining stocks that could be reached in the next few weeks. We invite you to subscribe now and read today’s issue right away.
Sincerely,
Przemyslaw Radomski, CFA
Founder, Editor-in-chief -
Something Is Very Wrong With Gold Miners. Good For Us!
August 17, 2021, 9:10 AMHey, you want to hear a joke that’s just not funny?
Gold miners’ performance.
I told you it wasn’t funny. It’s very informative though.
With gold stocks completely ignoring gold’s gains, the myriads of factors that I’ve been discussing for weeks might not have been in place, and the outlook for the precious metals sector would be bearish anyway. Gold stocks’ weakness is so ubiquitous and so extreme that it’s a critical sell signal on its own.
It was just yesterday when I emphasized that it was yet another week when the HUI Index – the flagship proxy for the gold – declined by about 5 points while gold moved higher by about $15, and yesterday we saw exactly the same kind of performance.
Gold ended yesterday’s session $11.60 higher, and what did gold stocks do? The HUI Index was down by 1.21 (0.48%), the GDX ETF was down by $0.18 (0.55%), and the GDXJ ETF was down by 0.45 (1.05% – so, profits on our short position have increased further).
Sometimes gold stocks take the lead of the general stock market, which… makes yesterday’s decline even more bearish because the general stock market ended yesterday’s session higher.
Gold miners sell gold and/or discover it to develop a given property and sell gold later. If the price of gold increases, it’s obvious that the prices of gold stocks’ shares should increase, as their current or future profits depend on gold’s price. Sure, miners will sell gold at a future price, not today’s price, but a higher price today means higher price expectations in the future, so it doesn’t really matter that there’s this delay. Gold price up should equal gold stocks’ prices up. If it doesn’t, it means that something is very wrong.
The thing that’s very wrong is that the precious metals market hasn’t yet completed its final decline and therefore it’s reluctant to respond to bullish indications. What we’re seeing in gold stocks is a screaming and extreme sign that the sector is going to decline in the following weeks and months. And it’s not the first time we’ve seen something like that! We saw exactly the same thing in 2013 before a massive slide.
Yes, the fundamental situation for gold, in the long run, is very positive. Yes, it’s even more positive for silver. And yes – right after the bottom, gold stocks are likely to outperform gold and soar profoundly.
BUT.
It’s not likely to happen until we see a huge price decline first. And it’s this huge price decline that we’re very likely to profit from even before we get to this mother-of-all-buying-opportunities. And what’s best is that thanks to the profits on the short position, we’ll most likely be able to buy even more extremely discounted gold, silver, and mining stocks.
Give the Charts a Look
Let’s jump into the short-term charts for details of what happened yesterday, starting with senior mining stocks.

The small decline seems irrelevant, but it is very bearish when one compares it with what happened in gold.
The same goes for the junior gold miners, which declined even more than seniors.
Please note how perfect the verification of the breakdown to new yearly lows was. The GDXJ moved back and forth in a classic ABC format and thus created a flag pattern right below the previously broken support level which –this way – was verified as resistance. The volume was low, which means that the market is simply waiting for another downleg.
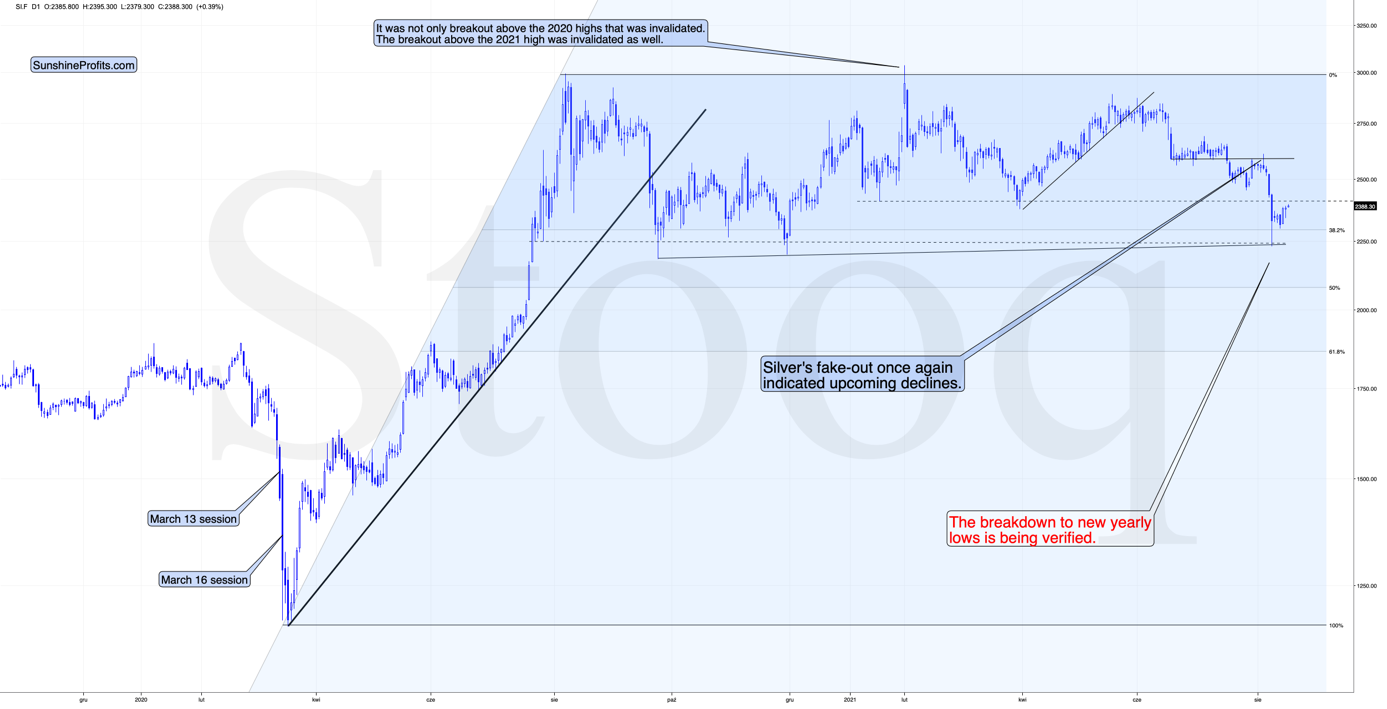
Silver has also confirmed the breakdown to new 2021 lows. Even though it came back up after declining profoundly, it didn’t move back above the previous 2021 lows in terms of the closing prices, nor did it move back above January intraday lows.
That’s a very bearish price action.
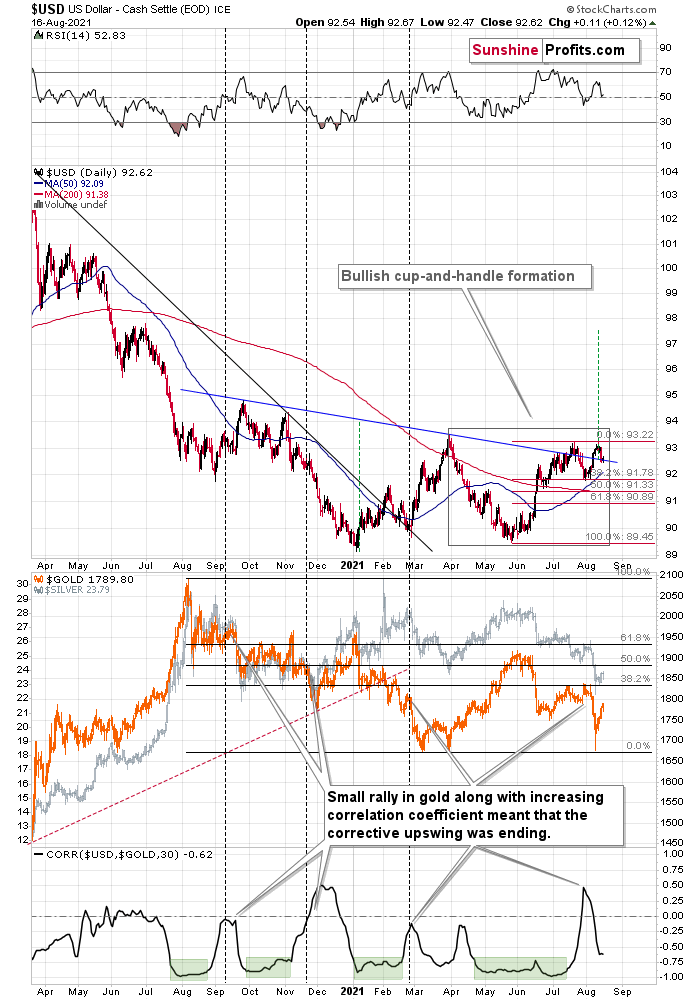
After surging above the neckline of its inverse (bullish) head & shoulders pattern, the USD Index backtested the breakout last week. In other words, the breakout was confirmed, and, so far this week, the USD Index has been moving slightly higher, further validating the above
Hold My Cup!
Please note that in addition to the inverse head-and-shoulders pattern in the USD Index, we can also see a bullish cup-and-handle pattern that I marked with a grey rectangle. This pattern confirms the bullish outlook for the US currency. Once the index gets above the previous 2021 highs, it’s likely to soar visibly once again – quite likely to the 97-98 range.
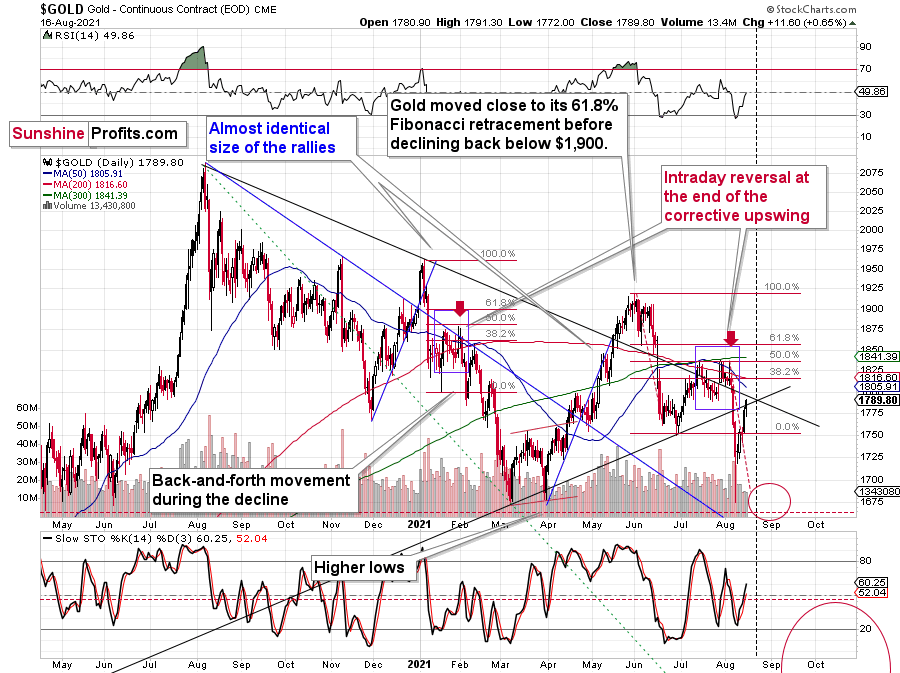
As I wrote earlier today, gold ended yesterday’s session $11.60 higher, and it has moved up by $6 so far today. Does it change much? While I honestly admit that this correction is a bit bigger than I expected it to be, it doesn’t change anything with regard to the outlook. It’s still just a corrective upswing within a bigger downtrend, in my view. And since the next triangle-vertex-based reversal is just around the corner (early next week), it wouldn’t be surprising to see a back and forth movement this week or even slightly higher gold prices. I don’t think it would change much though.
The short-term resistance is provided by the declining black line, as well as the mid-July lows and the $1,800 level, which is natural resistance, as it’s a round number.
Also, please note that gold has been mostly repeating its early-2021 performance. After declining sharply (January and June) and forming a double bottom with the second bottom slightly lower, it then corrected half of the decline forming more than one top close to the 50% retracement, and then declined sharply once again.
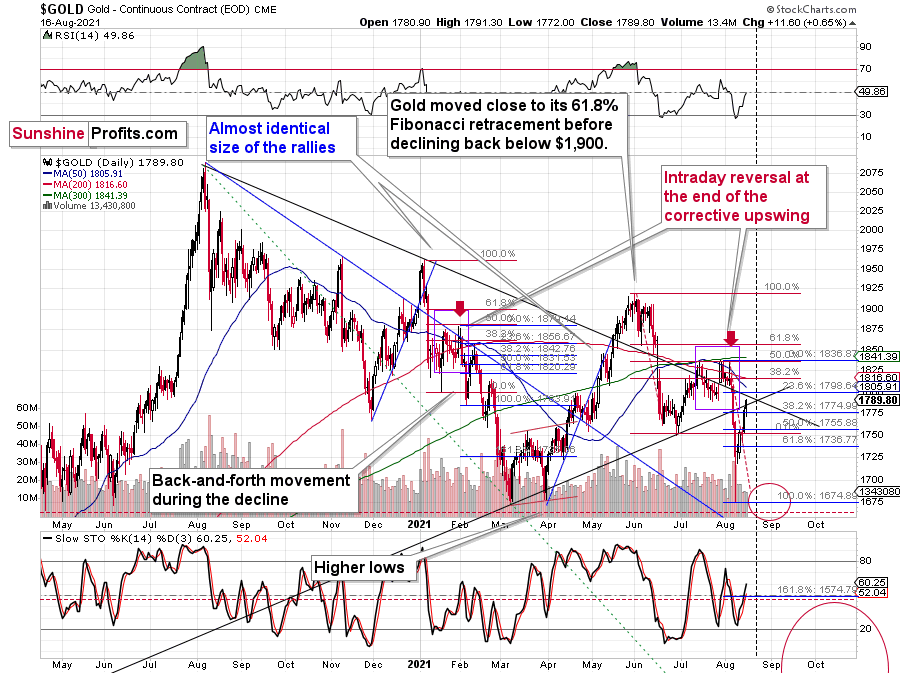
Back in February 2021, gold corrected about 76.4% of the decline (which is a less popular but still a Fibonacci retracement level – marked with blue). Right now, this retracement is just below the $1,800 mark. So, if history rhymes once again, gold will be likely to move close to $1,800 and then decline once again. At the moment of writing these words, gold is trading at $1,795 after having moved to $1797.15. So, the top could be in, and even if it’s not, it seems that it’s at hand.
Thank you for reading our free analysis today. Please note that the above is just a small fraction of the full analyses that our subscribers enjoy on a regular basis. They include multiple premium details such as the interim targets for gold and mining stocks that could be reached in the next few weeks. We invite you to subscribe now and read today’s issue right away.
Sincerely,
Przemyslaw Radomski, CFA
Founder, Editor-in-chief -
Gold: The General Left Alone
August 16, 2021, 8:40 AMGold commanded its unit to make another raid only to find itself stranded. The gold miners had already fled as fugitives, retreating without orders.
The Gold Miners
While gold shrugged off the Aug. 8 ‘flash crash’ and bounced back above its June lows, the yellow metal’s renewed sense of swagger hasn’t been mimicked by its precious metals peers. For example, while gold ended the week up by 0.86%, the GDXJ ETF (our short position) ended the week down by 1.72%.
Please see below:
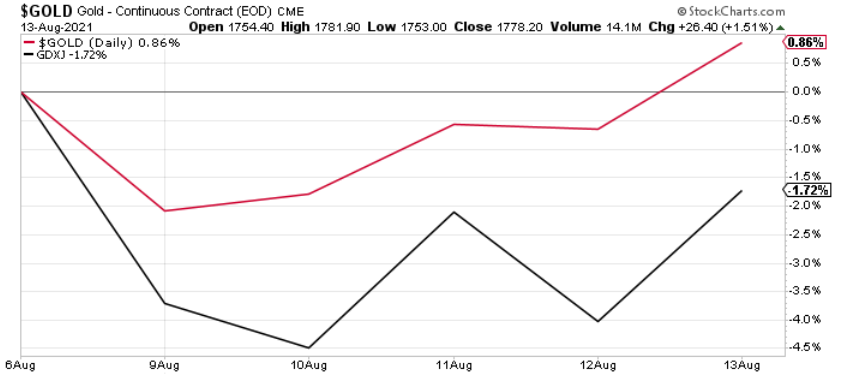
Furthermore, while gold jumped by roughly $15 last week, the HUI Index declined by five index points. And with the bearish underperformance often a precursor to profound medium-term drawdowns, the precious metals are behaving like its 2012-2013. Last week is yet another confirmation of the analogy.
Case in point: after the HUI Index recorded a short-term buy signal in late 2012 – when the index’s stochastic indicator was already below the 20 level (around 10) and the index was in the process of forming the right shoulder of a huge, medium-term head-and-shoulders pattern – the index moved slightly higher, consolidated, and then fell off a cliff.
Please see below:
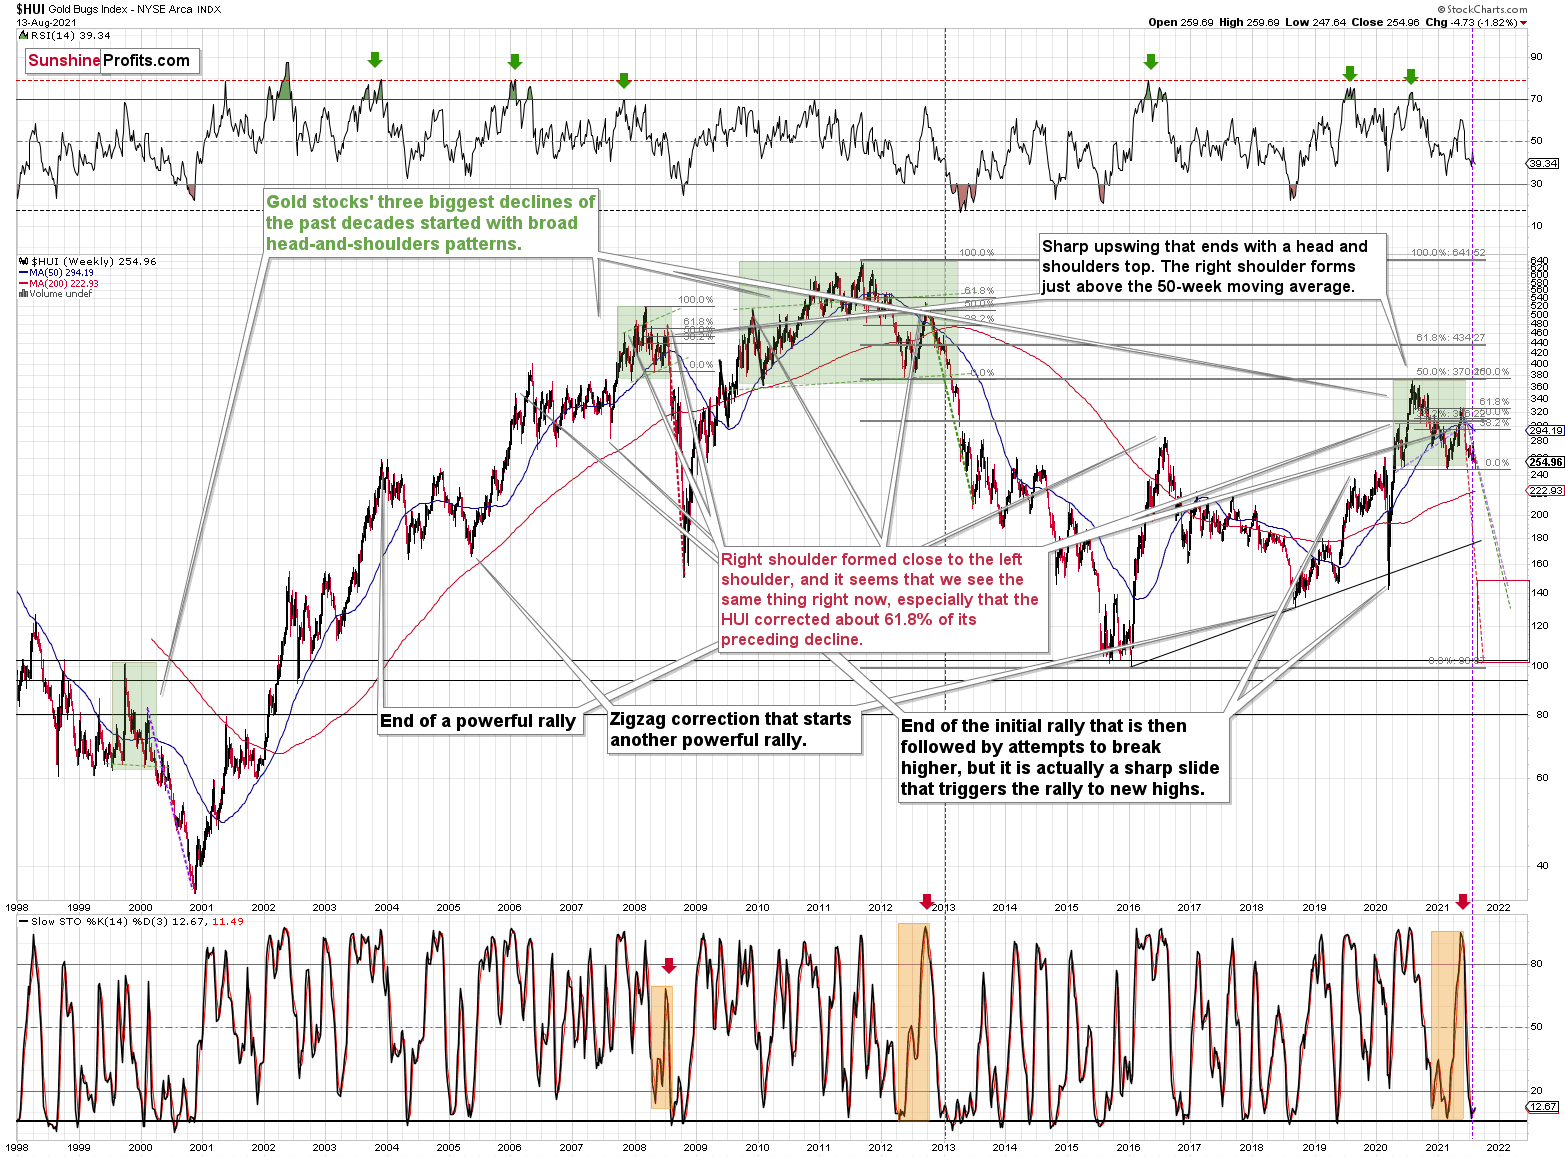
To explain, can you see the HUI’s rally at the end of 2012 that followed a small buy signal from the stochastic indicator? I marked it with a purple, dashed line. No? That’s because it’s been practically nonexistent. The HUI Index moved higher by so little that it’s impossible to see it from the long-term point of view. On top of that, with the shape of gold’s recent price action, its RSI, and its MACD indicators all mirroring the bearish signals that we witnessed back in December 2012, the current setup signals that we’re likely headed for a similar swoon.
For context, I warned previously that the miners’ drastic underperformance of gold was an extremely bearish sign. I wrote the following about the week beginning on May 24:
(…) gold rallied by almost $30 ($28.60) and at the same time, the HUI – a flagship proxy for the gold stocks… Declined by 1.37. In other words, gold stocks completely ignored gold’s gains. That shows exceptional weakness on the weekly basis and is a very bearish sign for the following weeks.
And why is this quote so important? Well, because the bearish phenomenon still remains intact. As mentioned, with gold rising by roughly $15 and the HUI Index declining by about five index points, the bearish underperformance is accelerating. Precisely, something similar happened during the week beginning on July 6. The gold price rallied by $27.40, and the HUI Index declined by 1.39. As a result, with the HUI Index’s ominous signals still present, if history rhymes (as it tends to), medium-term support will likely materialize in the 100-to-150 range. For context, high-end 2020 support implies a move back to 150, while low-end 2015 support implies a move back to 100. And yes, it could really happen, even though such predictions seem unthinkable.
In addition, the drastic underperformance of the HUI Index also preceded the bloodbath in 2008. To explain, right before the huge slide in late September and early October, gold was still moving to new intraday highs; the HUI Index was ignoring that, and then it declined despite gold’s rally. However, it was also the case that the general stock market suffered materially. If stocks didn’t decline back then so profoundly, gold stocks’ underperformance relative to gold would have likely been present but more moderate.
Nonetheless, bearish head & shoulders patterns have often been precursors to monumental collapses. For example, when the HUI Index retraced a bit more than 61.8% of its downswing in 2008 and in between 50% and 61.8% of its downswing in 2012 before eventually rolling over, in both (2008 and 2012) cases, the final top – the right shoulder – formed close to the price where the left shoulder topped. And in early 2020, the left shoulder topped at 303.02. Thus, three of the biggest declines in the gold mining stocks (I’m using the HUI Index as a proxy here) all started with broad, multi-month head-and-shoulders patterns. And in all three cases, the size of the declines exceeded the size of the head of the pattern.
Furthermore, when the HUI Index peaked on Sep. 21, 2012, that was just the initial high in gold. At that time, the S&P 500 was moving back and forth with lower highs. And what was the eventual climax? Well, gold made a new high before peaking on Oct. 5. In conjunction, the S&P 500 almost (!) moved to new highs, and despite bullish tailwinds from both parties, the HUI Index didn’t reach new heights. The bottom line? The similarity to how the final counter-trend rally ended in 2012 (and to a smaller extent in 2008) remains uncanny.
As a result, we’re confronted with two bearish scenarios:
- If things develop as they did in 2000 and 2012-2013, gold stocks are likely to bottom close to their early-2020 low.
- If things develop like in 2008 (which might be the case, given the extremely high participation of the investment public in the stock market and other markets), gold stocks could re-test (or break slightly below) their 2016 low.
In both cases, the forecast for silver, gold, and mining stocks is extremely bearish for the next several months.
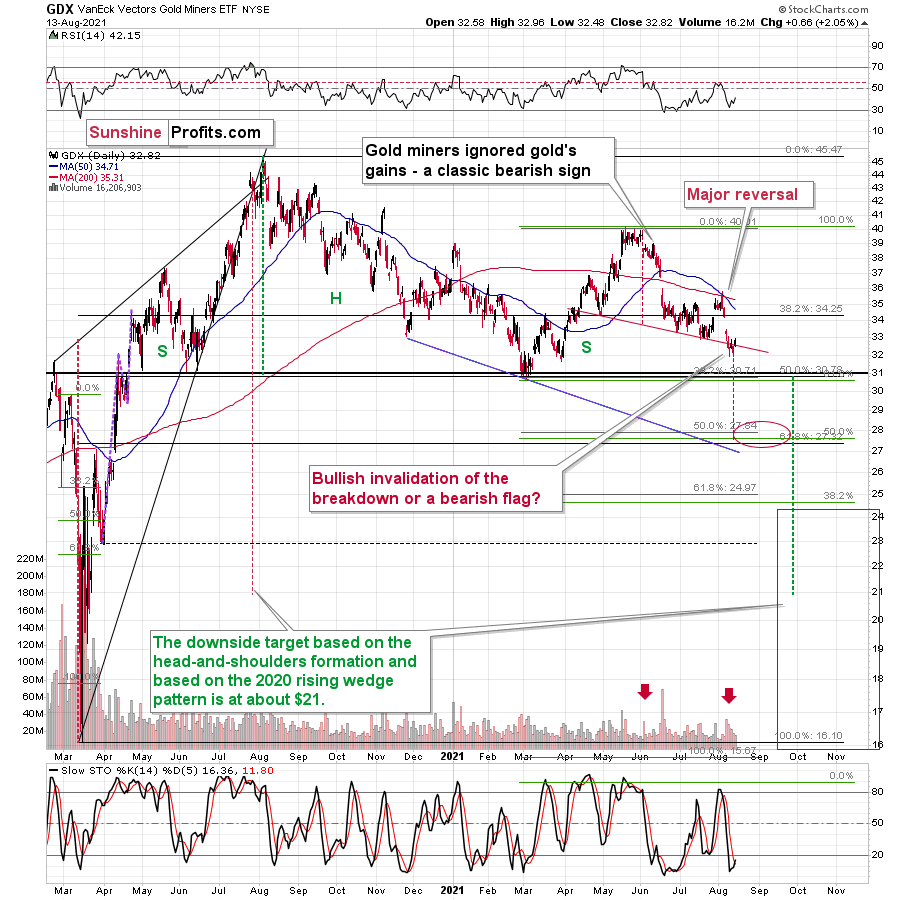
As further evidence, let’s compare the behavior of the GDX ETF and the GDXJ ETF. Regarding the former, the senior miners (GDX) are in the midst of forming an ominous bear flag and the volume that accompanied Friday’s (Aug. 13) corrective upswing was relatively weak and it declined while the flag pattern was formed – just as it should if the formation was valid.
Conversely, the GDX ETF did invalidate the breakdown below the neckline of its bearish H&S pattern (which is a bullish sign). However, the GDXJ ETF did not. And with the junior miners’ initial plunge (the pole) implying a continuation of the downtrend (following a consolidation that forms the flag), there are more indicators weighing down the gold miners than lifting them up.
Please see below:
Wave the Flag! The Bear Flag!
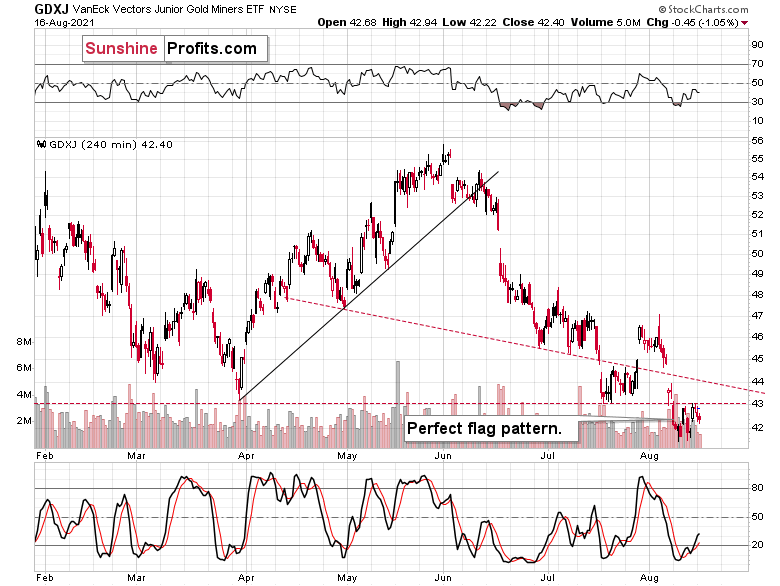
Speaking of the GDXJ ETF, not only are the junior miners lagging behind their senior counterparts, but the four-hour chart provides a clear visual of the initial breakdown and the formation of the current bear flag.
Please see below:
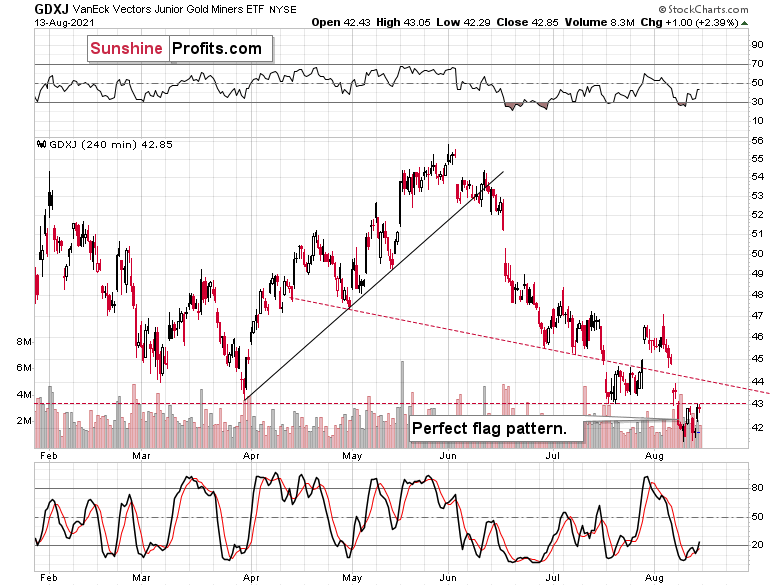
The flag is perfect, and it took place on relatively declining volume, suggesting that another move will also be to the downside. After all, the moves that follow flags tend to be similar to the ones that preceded them.
The price levels at which the flag was formed are also very important, and it’s clearer on the daily chart.
Junior miners broke below the previous 2021 lows, and they held this breakdown, even though gold rallied quite visibly last week. This serves as a great confirmation that the move lower is about to take place.
And how should we expect the climax to unfold? Last week, I wrote the following:
Well, the GDXJ ETF may consolidate in the short term, but lower lows are still likely, and initial support should materialize at roughly $37 (the 61.8% Fibonacci retracement level). Thereafter, a short-term corrective upswing should follow before the GDXJ ETF reverses course once again and records its final bottom near the end of the year – at much, much lower price levels. All in all, it seems that our profits on the GDXJ (short position in it) are going to become MUCH bigger before this decline is over.
The above remains up-to-date. In fact, we already saw the short-term consolidation last week, so the decline could resume any day now.
In conclusion, the gold miners’ continued underperformance of the yellow metal is akin to a fire alarm signaling an impending blaze. And while many investors have forged through the smoke in 2021 and suffered a loss of breath in the process, our medium-term forecast does not change our outlook for gold, silver and mining stocks over the long term. With the trio underpinned by robust long-term fundamentals and their medium-term drawdowns likely to elicit secular buying opportunities, we’re confident that the precious metals will remain atop investors’ wish lists for years to come.
Thank you for reading our free analysis today. Please note that the above is just a small fraction of the full analyses that our subscribers enjoy on a regular basis. They include multiple premium details such as the interim targets for gold and mining stocks that could be reached in the next few weeks. We invite you to subscribe now and read today’s issue right away.
Sincerely,
Przemyslaw Radomski, CFA
Founder, Editor-in-chief -
Connection: When Gold Rises, Will Bitcoin Fall?
August 13, 2021, 8:12 AMWhat do the portents say? Well, we’ve been looking for connections between gold and bitcoin, and we see a chance to fatten the coffers. Read on.
But first, let’s talk about gold and the miners. Yesterday’s session provided us with a perfect confirmation of the bearish case in the precious metals sector for the short term.
The reason is that what happened was bearish in two ways:
- Nothing happened in gold
- Daily declines in mining stocks
Short Term: Miners Still Looking Weak
First, the decline in mining stocks. A price action following a confirmed breakdown was exactly what I expected to happen to both junior miners and senior miners.
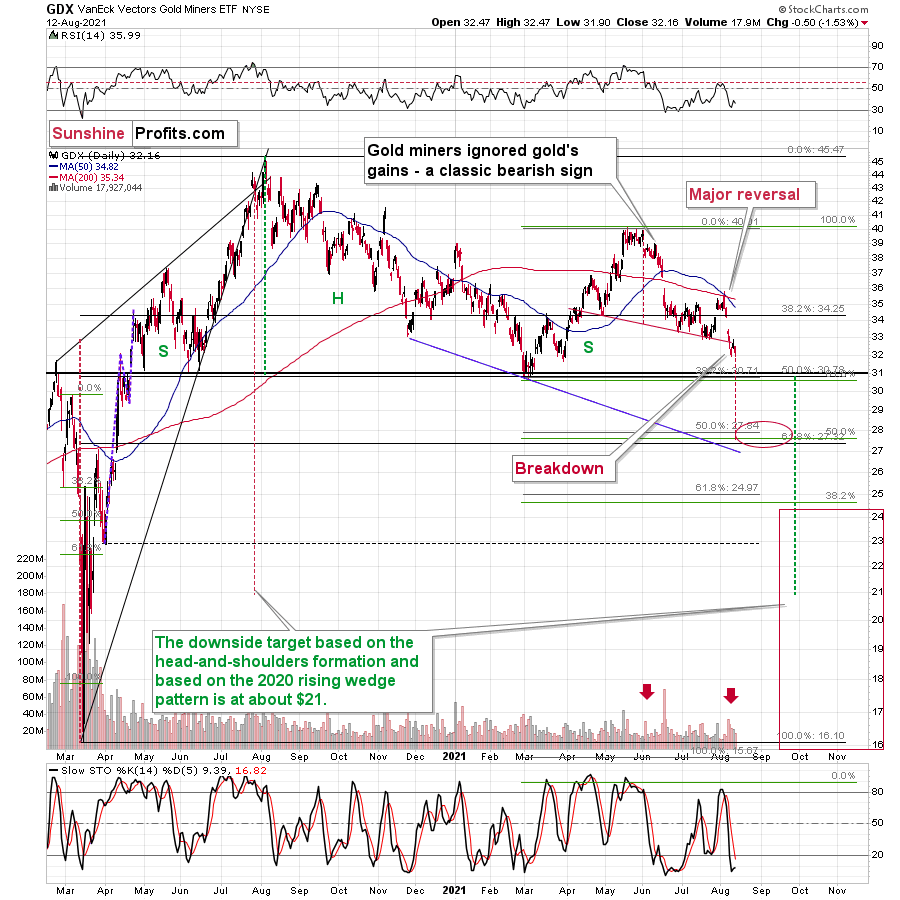
Senior miners – the GDX ETF – declined after verifying the breakdown below the neck level of the head and shoulders pattern.
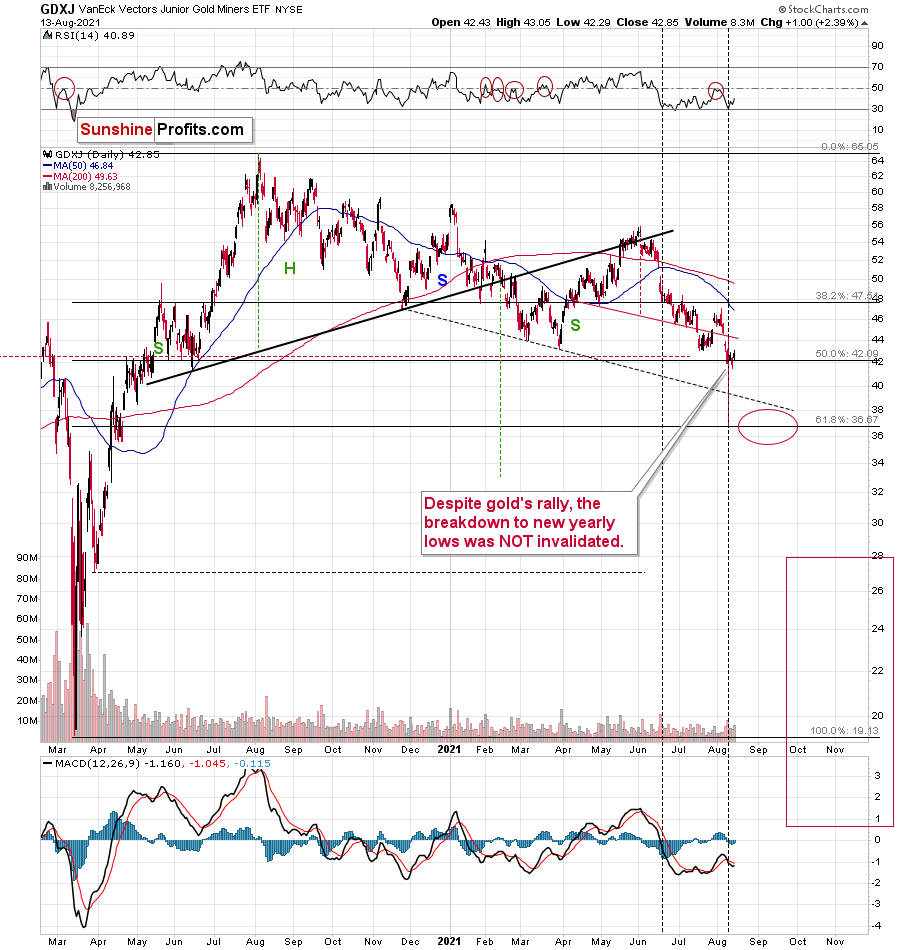
Junior miners – the GDXJ ETF – declined after verifying the breakdown to new yearly lows.
Both are very bearish on their own as the confirmed breakdowns imply that another – bigger – short-term slide is about to start.
But they are even more bearish when compared to what happened in gold.

Nothing happened in the case of the gold price, which means that miners had no good reason to decline yesterday. Well, except for the reason that they have been in a medium-term downtrend and due to myriads of technical reasons that I discussed previously. However, on a day-to-day basis, since gold didn’t move, miners shouldn’t have moved either, if their outlook was at least neutral.
Their outlook, however, is not neutral. It’s clearly bearish as they showed weakness relative to gold. What just happened is the exact opposite of what one should see at or after an important bottom – at that time gold stocks should outperform gold.
Consequently, the precious metals sector is likely to slide shortly, and profits from our short positions in the junior miners are likely to increase sooner rather than later.
That’s as far as the short-term implications are concerned.
Gold and Bitcoin: What’s in It for Me?
There is something else that I’d like to share with you today, though. I previously wrote that there’s a tendency for gold and bitcoin to move in the opposite directions in the short run, despite that they both moved higher in the long term – since 2014. I wrote that I’ll get back to this topic at some later date – and that day is today.
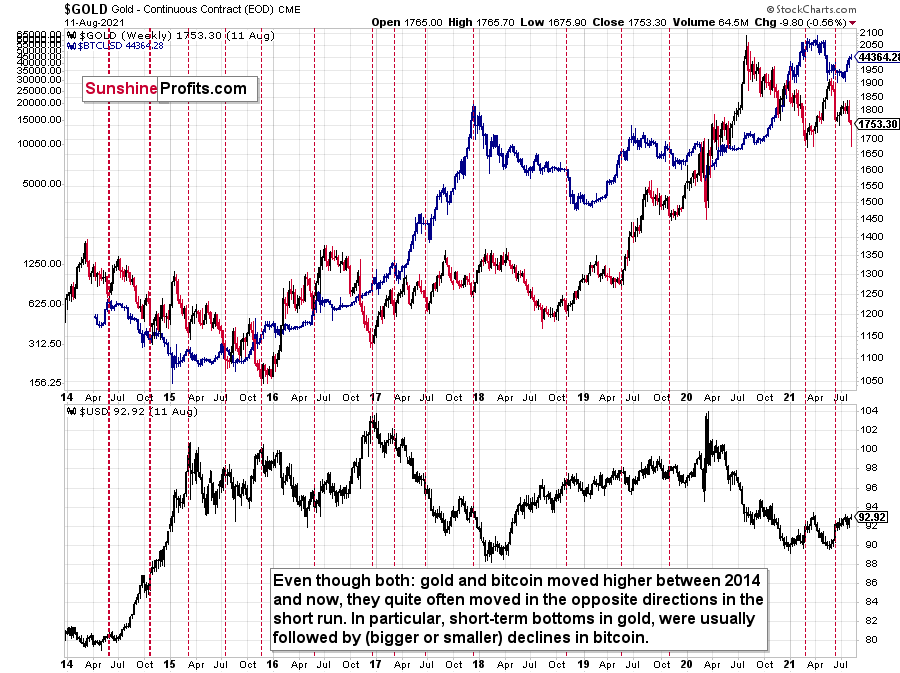
The upper part of the above chart features gold (regular colors) and bitcoin (blue), and the lower part of the chart features the USD Index.
At first glance, the performance of gold and bitcoin doesn’t seem to be that connected, besides the fact that they both moved higher in recent years. However, taking a closer look reveals that the link between them is not only present, but it’s actually quite strong.
I used the vertical, dashed lines to mark the moments when gold formed short-term bottoms and when bitcoin responded with declines. There were multiple cases like that! What’s remarkable is that even if bitcoin was soaring, it managed to correct a bit when gold was regaining strength. There were also some cases when bitcoin did nothing after gold’s bottom, but the moments when bitcoin ignored gold’s bottom and just continued to rally were rare.
I marked the first two (2014) cases with bold lines as that’s when the USD Index had been rallying particularly strongly. Since it seems that the USDX is starting a sizable upswing, these analogies might be most important.
Bitcoin declined in 2014 and the decline took the form of two smaller declines. One of them started close to the middle of the year (practically right at the vertical line) and the second started in the final few months of the year. What is most interesting, is that both bitcoin declines started when gold was forming short-term bottoms.
Bitcoin has been on the rise in the last several days, and given what we saw in gold – and in light of the above-discussed link – it’s perfectly normal, since gold has been declining (the recent pause seems too small to trigger any price moves). But most importantly, it tells us that when gold rebounds, it could be bitcoin’s chance to slide.
The 2014 decline might not seem like a big deal on the above chart, but that is only due to the perspective. When you look at the prices (the axis on the left side of the chart), you’ll see that bitcoin actually declined from about $600 to about $150. In other words, its price was reduced fourfold. That’s a huge decline. And a huge opportunity for those who are able to see it in advance.
This might or might not provide us with a great shorting opportunity in case of bitcoin, when gold rebounds (likely close to the previous 2021 lows), increasing this year’s profits, but it’s too early to say so with certainty at this time. I’ll keep looking for confirmations and I’ll report accordingly.
Thank you for reading our free analysis today. Please note that the above is just a small fraction of the full analyses that our subscribers enjoy on a regular basis. They include multiple premium details such as the interim targets for gold and mining stocks that could be reached in the next few weeks. We invite you to subscribe now and read today’s issue right away.
Sincerely,
Przemyslaw Radomski, CFA
Founder, Editor-in-chief -
Gold: Recovering From a Food Coma
August 12, 2021, 8:43 AMNo market moves in a straight line and neither does gold. We ate a delicious meal during the latest fall, now it’s time to rest a little.
After profound declines, corrective upswings are not uncanny – they are the norm. Consequently, seeing one in gold is not bullish.
The lack of bullish implications here is confirmed by the lack of true strength in the rest of the precious metals sector: silver, senior miners, and junior miners.
Let’s jump into the charts for details:
In yesterday’s analysis I wrote that if gold moved back to the previously broken lows at about $1,750, it wouldn’t invalidate the bearish narrative.
At the moment of writing these words, gold is trading at $1,759, which – from the broader point of view – is still “about $1,750”. The June low in terms of closing prices is $1,763.60, so there was no invalidation of the breakdown in terms of closing prices. In other words, nothing really changed.
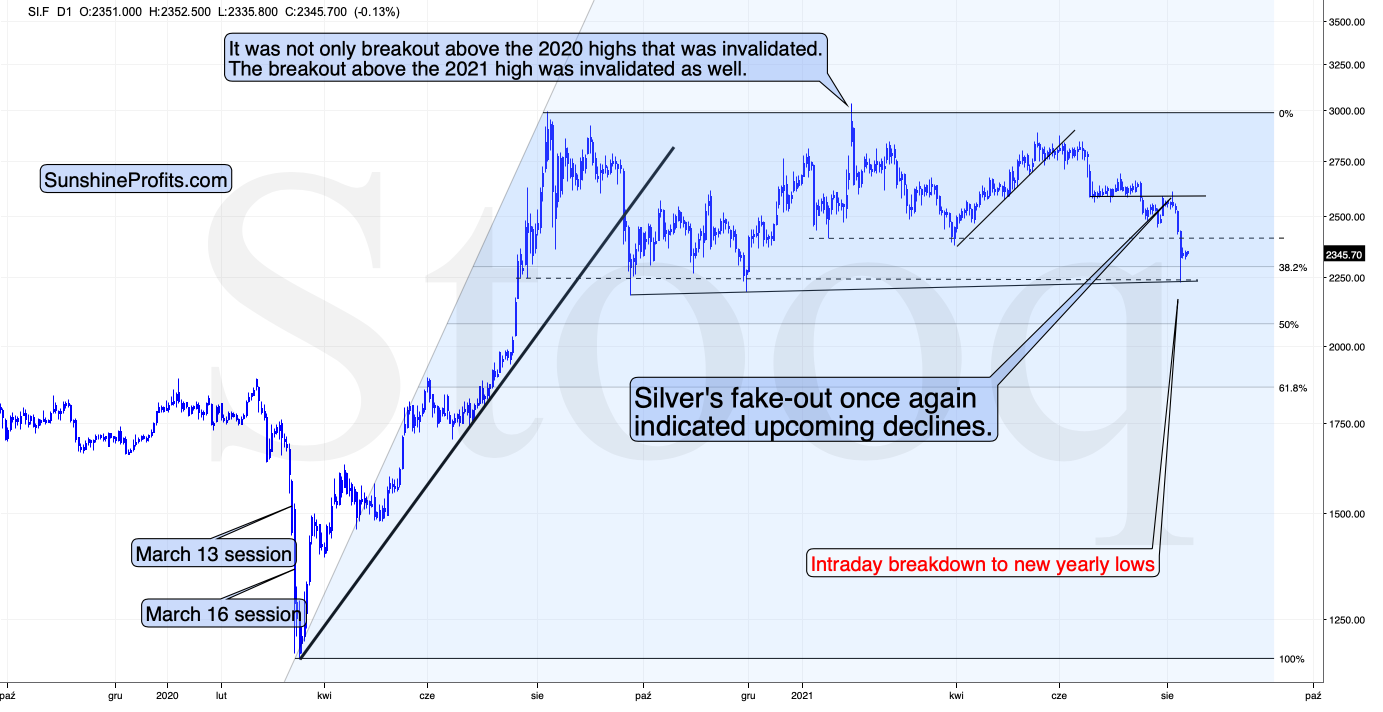
Silver did practically nothing, which means that it confirmed the breakdown below the previous 2021 lows. This “nothing” has, thus, bearish implications.
The Gold Miners

The GDX ETF (a proxy for senior miners) moved higher but gave some of the gains away before the end of the session. Interestingly, it declined enough not to invalidate the breakdown below the neck level of the head and shoulders pattern. This means that the breakdown was confirmed and that the overall implications of yesterday’s session are bearish.

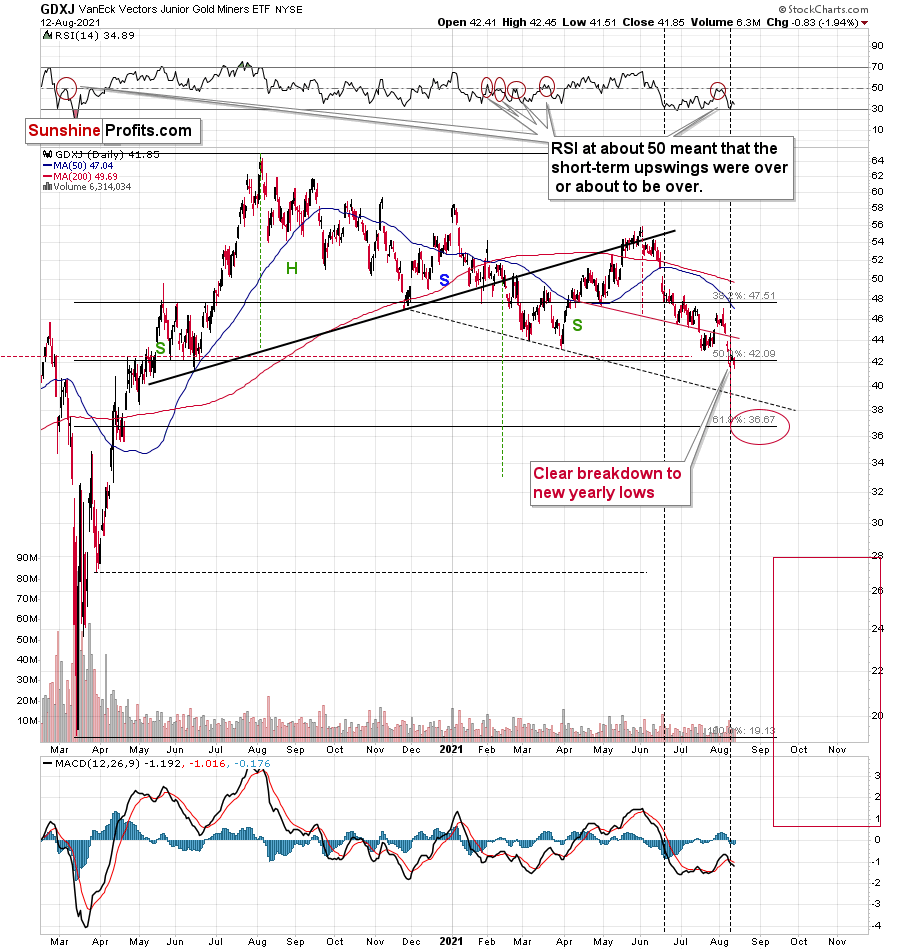
In the case of the GDXJ ETF (a proxy for junior miners), we saw something similar, but with regard to the breakdown to new yearly lows. Juniors moved slightly higher but ended the day below the July lows. Consequently, the breakdown to new 2021 lows was confirmed. This opens the door wide open to new lows.
In other words, it means that the profits from our short positions in the junior miners are likely to increase rather sooner than later.
Thank you for reading our free analysis today. Please note that the above is just a small fraction of the full analyses that our subscribers enjoy on a regular basis. They include multiple premium details such as the interim targets for gold and mining stocks that could be reached in the next few weeks. We invite you to subscribe now and read today’s issue right away.
Sincerely,
Przemyslaw Radomski, CFA
Founder, Editor-in-chief


Gold Investment News
Delivered To Your Inbox
Free Of Charge
Bonus: A week of free access to Gold & Silver StockPickers.
Gold Alerts
More-
Status
New 2024 Lows in Miners, New Highs in The USD Index
January 17, 2024, 12:19 PM -
Status
Soaring USD is SO Unsurprising – And SO Full of Implications
January 16, 2024, 8:40 AM -
Status
Rare Opportunity in Rare Earth Minerals?
January 15, 2024, 2:06 PM

