
tools spotlight

-
Downside Risks Ahead! Will Gold Dodge Bullets or Get Shot?
July 22, 2021, 6:29 AMThe FED’s taper talk, vaccines, Treasuries… the rifles are being fired at gold from every direction this week. Will it escape unharmed?
A Fog of Confusion
With investors’ manic mood swings whipsawing the U.S. yield curve in-and-out of hysteria, gold suffered another dose of reality on Jul. 21. And with inflation surging and the U.S. 10-Year Treasury yield still extremely oversold, the yellow metal could be dodging even more bullets in the coming weeks.
Case in point: while over-positioning, the U.S. Federal Reserve’s (FED) hawkish shift, unprecedented reverse repos (another $886.206 billion sold on Jul. 21) and the Delta variant have rocked investors’ boats, the reality on the ground is much different. To explain, with Canadian National Railway (CN) SVP James Cairns telling analysts on Jul. 20 that “during Q2 we saw the more balanced demand recovery that we expected,” the U.S. 10-Year Treasury yield is still underestimating the strength of the U.S. economic recovery.
For context, CN is a leading North American transportation and logistics company that transports more than C$250 billion worth of goods annually across a rail network of approximately 20,000 route-miles spanning Canada and mid-America.
Please see below:
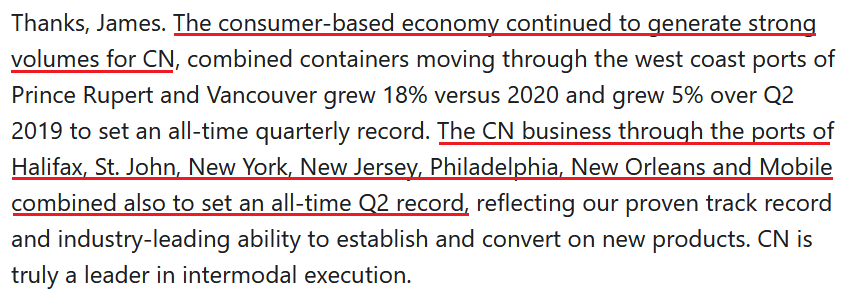 Source: CN/The Motley Fool
 Moreover, another excerpt from the conference call read:
“Labor and fringe benefit expense was up 28% versus last year. This was mostly driven by increased wages due to a 9% higher average headcount and higher incentive compensation. Fuel expense was up 86% driven by a 76% increase in price and a 14% higher workload, partially offset by another solid fuel efficiency improvement of 2%.”
On top of that, with CEO Jean-Jacques Ruest noting that “there is rail inflation [and that] eventually you will see it in the all-inclusive rail index of AAR because there is a bit of a lag in that index,” how is the company responding to the inflationary pressures?
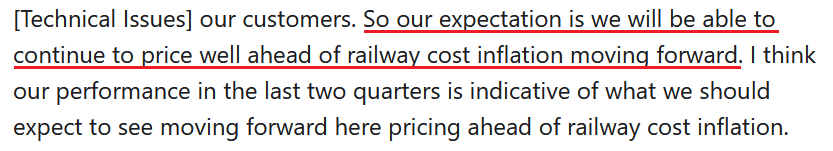 Source: CN/The Motley Fool
Singing a similar tune, Stellantis NV CEO Carlos Tavares said on Jul. 21 that rising raw material costs and a shortage of semiconductors could uplift inflation well into next year. For context, Stellantis NV is a European automaker that was created following the merger of PSA Group and Fiat Chrysler in 2021.
Please see below:
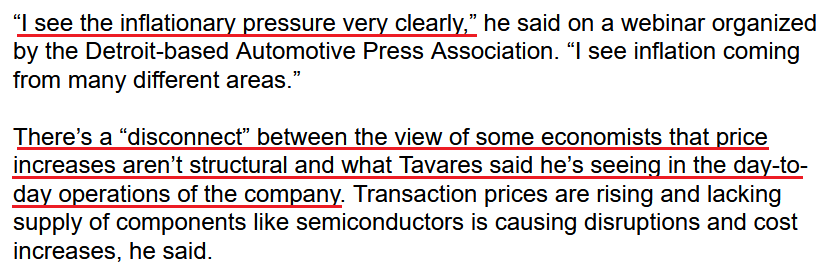 Source: Bloomberg
 Likewise, Daimler AG Chairman Ola Kallenius said the following during the automaker’s Q2 earnings call on Jul. 21:
“On the raw material, you're right. The headwinds we now see moving forward are stronger than what we assumed so far. We said, I think, at the beginning of the year, we could probably have on the full year 0.5% in terms of cost headwind. I mean, now you could hear us, I mean, saying 1% in the second half. And actually, I mean, we can see that all in all, in cars and vans, as well as in trucks and buses.”
He added:
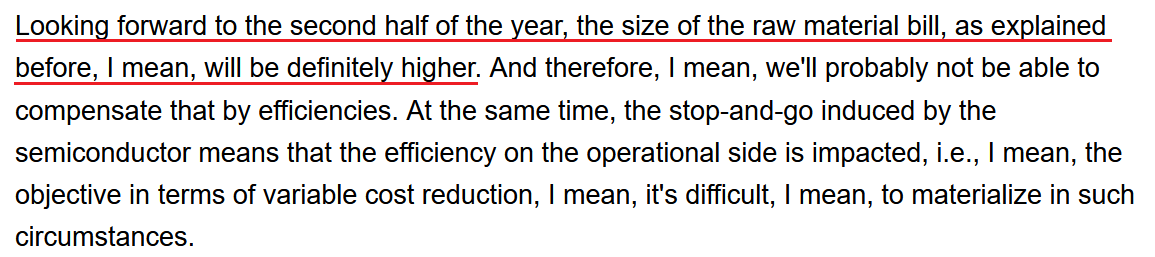 Source: Daimler/Seeking Alpha
Inflation and Commodities – Do We Still Fight for Lumber?
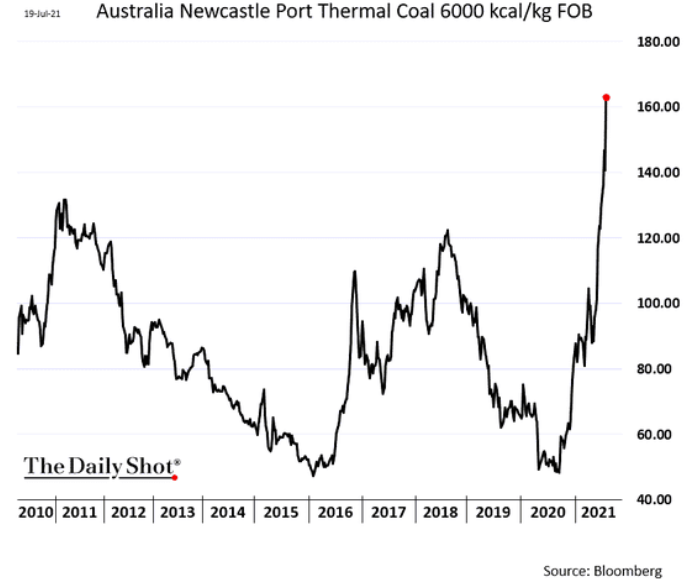
Furthermore, while I’ve been warning for months that inflationary pressures will likely force the FED’s hand in September, cost-push inflation remains alive and well. For example, while crude suffered a freak-out on Jul. 19 and lumber has fallen off a cliff, steel remains in the clouds and coal isn’t far behind.
Please see below:
In addition, with commodity producers still skittish over the wreckage that occurred during the global financial crisis (GFC), the group has been extremely cautious this time around. And with a lack of capital investments severely constraining production, the supply/demand equilibrium remains completely out of whack.
Please see below:
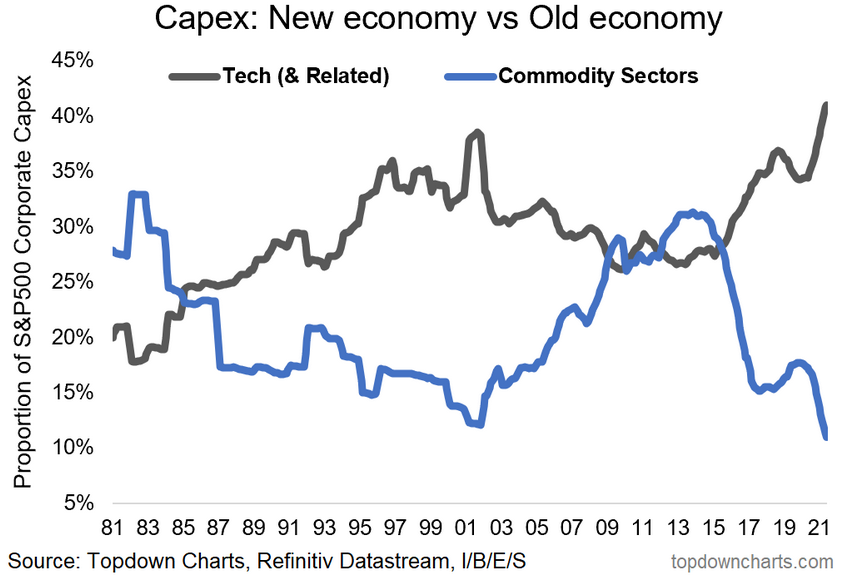
To explain, the black line above tracks capital investments made by technology-related firms in the S&P 500, while the blue line above tracks capital investments made by commodity producers in the S&P 500. If you analyze the right side of the chart, you can see that commodity cap-ex is at a 40-year low. On the flip side, technology-related firms are expanding at a pace that exceeds the dot-com bubble. As a result, not only could a Big Tech tirade upend the PMs, but realigning U.S. interest rates with the economic realities could be just as damaging.
To that point, BHP Group, the world’s largest mining company, released its full-year operational review on Jul. 20. For context, CEO Mike Henry said back in March that “there’s really no point in chasing production. The industry has a good track record of being quite a pro-cyclist, and it has ended in tears quite often.”
And with that, while BHP had 18 major projects in motion a decade ago, only two are in development now: the Mad Dog Phase 2 project in the Gulf of Mexico (24% stake) and its Jansen Potash project in Saskatchewan, Canada. Thus, please have a look at BHP’s forward guidance:
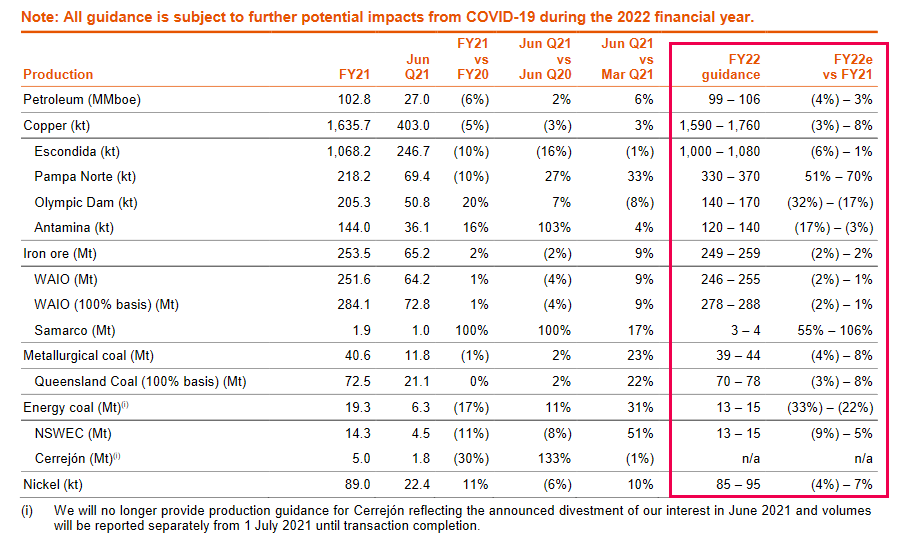 Source: BHP
To explain, if you analyze the red box above, you can see that BHP’s “FY22 guidance” includes lower-to-roughly-flat production. If you turn to the first column from the right, you can see that petroleum, copper, iron ore, coal and nickel could experience negative year-over-year (YoY) production growth (on the low-end) to low/mid-single digits production growth (on the high-end).
The bottom line? While cost-push inflation has been the main driver of the inflationary surge and the bond market is all-in on the FED’s “transitory” narrative, fresh commodities supply is not coming to the FED’s rescue.
10-Year Treasury: Goldman Sachs Doubles Down
Finally, while the U.S. 10-Year Treasury yield continues to weigh the FED’s likely taper (which would slow economic growth and reduce inflation) with the effects of the supply chain disruptions that continue underwriting the inflationary surge, Goldman Sachs has doubled down on its year-end forecast.
Please see below:
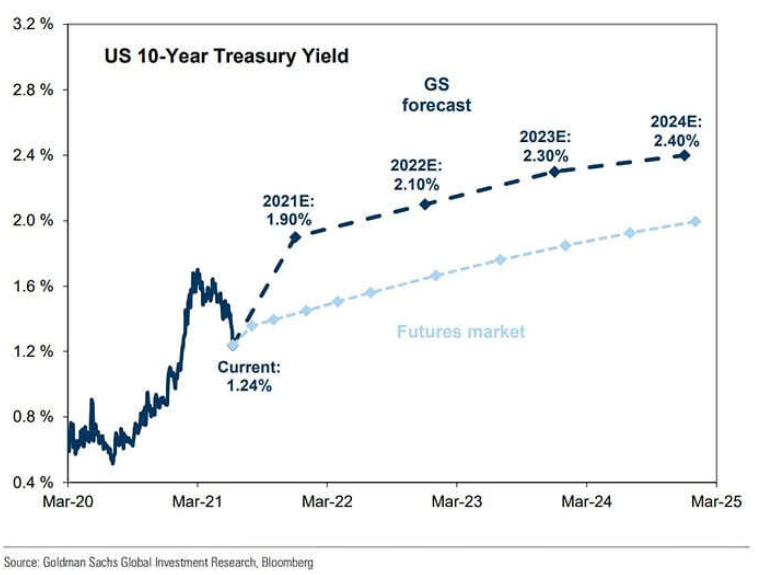
Despite the recent malaise, the U.S. investment bank expects the U.S. 10-Year Treasury yield to end the year at 1.90% (the dark blue line above). Moreover, with the futures market implying a year-end target of roughly 1.40% (the light blue line above), Goldman Sachs still sees upside risk to the consensus expectation.
In conclusion, the PMs remain in no man’s land, as the front-end and the back-end of the U.S. yield curve have the potential to push them over a cliff. Regarding the former, with the FED likely to announce its taper timeline in September, rising short-term interest rates reduce the PMs’ relative appeal. Regarding the latter, if the vaccines prove effective and reduce the impact of the Delta variant (which data shows that they already have), long-term interest rates are massively underestimating the inflationary pressures and the prospective strength of the U.S. economy. Thus, any way you slice it, the medium-term outlook for the PMs remains profoundly bearish (the long-term outlook is bullish, though).
Thank you for reading our free analysis today. Please note that the above is just a small fraction of the full analyses that our subscribers enjoy on a regular basis. They include multiple premium details such as the interim targets for gold and mining stocks that could be reached in the next few weeks. We invite you to subscribe now and read today’s issue right away.
Sincerely,
Przemyslaw Radomski, CFA
Founder, Editor-in-chief -
Junior Miners: New Yearly Lows! Will We See a Further Drop?
July 21, 2021, 7:10 AMIt seems that choosing GDXJ to short the PMs was a good decision – juniors closed the day at new 2021 lows. Will our profits only grow from now on?
Gold’s yesterday’s intraday attempt to rally was not bullish. On the contrary, it was what usually happens right before a big slide. Especially given the USDX’s breakout.
Let’s start with the latter.
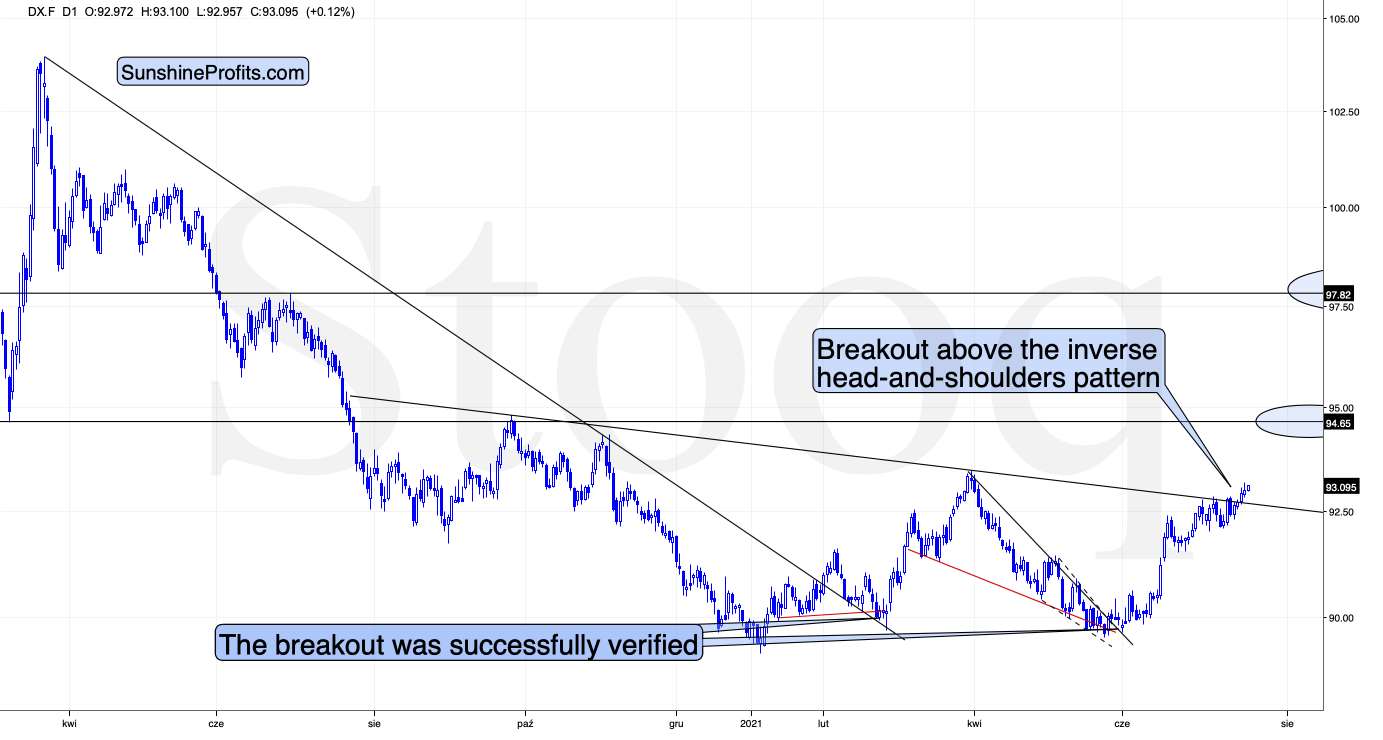
Yesterday there was a second session in a row when the USD Index closed above the neck level of the broad (~yearly) inverse head-and-shoulders pattern. Furthermore, it’s been moving slightly higher in today’s session, at least so far.
This is a very bullish price action – the USDX’s breakout was not accidental, nor was it based on geopolitical news (the latter tends to trigger temporary moves that are then reversed). Additionally, it was preceded by a consolidation. Consequently, it seems that this breakout has a huge chance of being confirmed (we need just one more – today’s – daily close) and followed by another sharp rally. The previous highs at about 94.5 are the initial upside target, but based on the inverse H&S pattern, the USDX is likely to rally to about 98.
Therefore, what just happened (the breakout above the formation’s neckline) has really bullish implications for the U.S. currency. And since the latter tends to move in the opposite direction to gold, silver, and mining stocks, it’s also very bearish for them.
Gold and Its Stocks
That would be enough on its own to make the outlook for the PMs bearish, but we have many more bearish indications, and some of them are truly profound. The most bearish confirmation of the bearish price prediction for gold doesn’t come from the USD Index but from the extreme underperformance of gold stocks relative to gold.
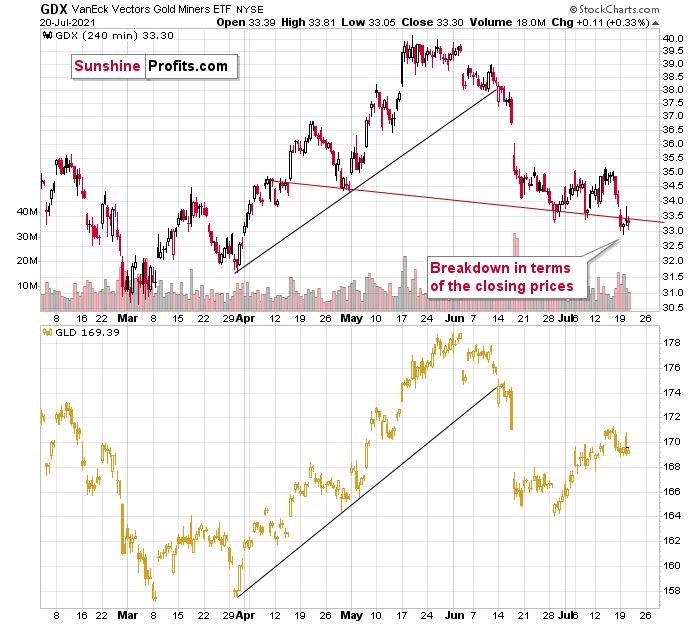
The GDX ETF (senior gold miners) moved below the recent lows, and it closed the day below the neck level of a head-and-shoulders pattern based on the 4-hour candlestick chart. At the same time, the GLD ETF is still relatively close to the middle of its previous decline. If the comparison is still unclear, please consider the mid-May bottom. The GLD ETF closed just slightly below it, while the GDX a few dollars below it.
And if you think this kind of relative weakness is bearish, just wait until you see what the junior mining stocks did.
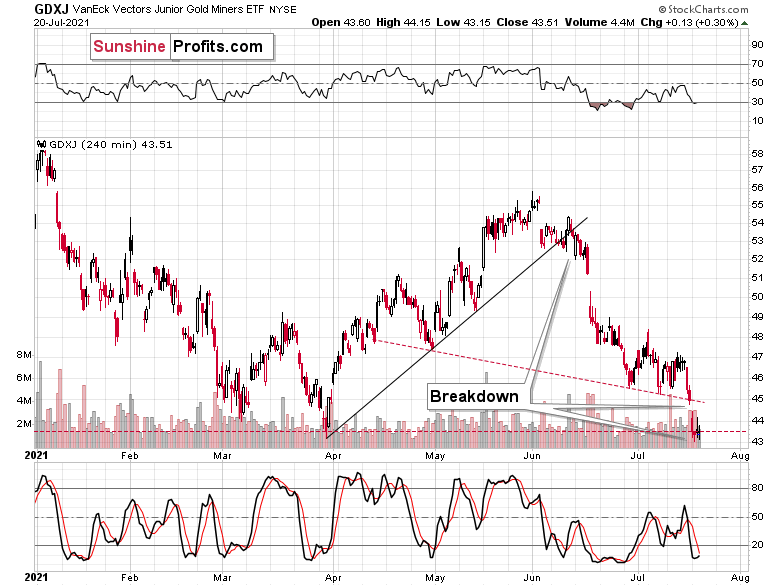
Junior miners declined not only below the neck level of the recent head-and-shoulders pattern (very clearly in both: intraday and closing price terms), but they actually closed the day at new 2021 lows! And they didn’t invalidate this breakdown yesterday, despite the intraday attempt!
There are two markets that primarily impact the performance of the junior mining stocks. One is gold, and the other is the general stock market. Gold is now about $140 above its 2021 lows, while the S&P 500 is over 16% above its 2021 highs. And yet, the GDXJ is below its previous 2021 lows. It seems that choosing junior miners as a proxy for shorting the precious metals sector was a good decision – our profits are rising rapidly, and it seems that they are going to soar much more in the following weeks.
What’s more, juniors are underperforming senior gold miners too. You can see that by comparing the two previous charts and by examining their ratio.
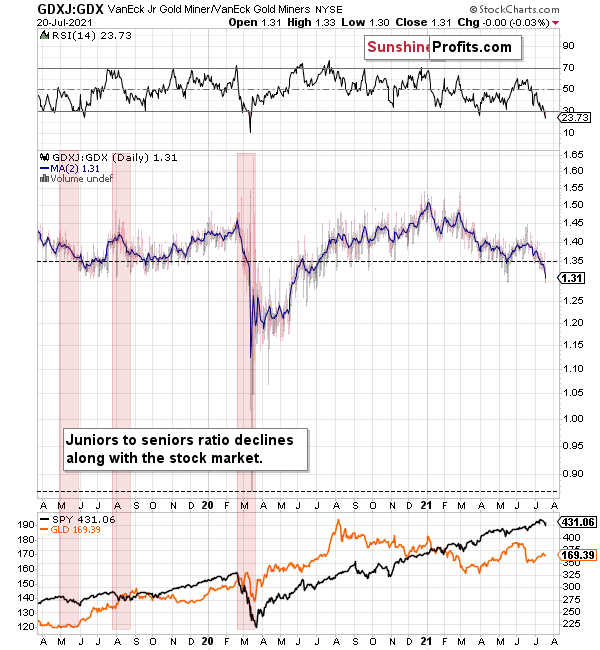
The ratio declines when junior miners underperform seniors. This happens often when the general stock market declines – juniors are more correlated with the latter than the seniors. Interestingly, juniors underperformed recently, even while stocks were strong. If the general stock market declines from here, the underperformance is likely to take an epic form – just as it did in early 2020.
This level of underperformance and weakness is truly breathtaking.
If miners – in particular, juniors – were able to decline so much without meaningful help from gold and the general stock market, just imagine the carnage they will suffer once this “help” finally arrives.
And given the breakout above the neck level of the inverse head-and-shoulders pattern in the USD Index, it seems like the key trigger to set the wheels in motion is already here.
Thank you for reading our free analysis today. Please note that the above is just a small fraction of the full analyses that our subscribers enjoy on a regular basis. They include multiple premium details such as the interim targets for gold and mining stocks that could be reached in the next few weeks. We invite you to subscribe now and read today’s issue right away.
Sincerely,
Przemyslaw Radomski, CFA
Founder, Editor-in-chief -
GDX, GDXJ: A Fall Before the Carnage
July 20, 2021, 9:04 AMGold holds tight, but this is rather an anomaly – after a fall, the mining stocks will be sent to slaughter. They are even declining on their own now.
Finally, after a few weeks of relatively small changes and telling you that whatever minor happened (or what didn’t happen) was a confirmation of the previous forecast, now I can report to you multiple interesting developments. And yes, they also confirm the previous forecast, and you already saw the results, as your trading account got bigger once again; but this time, the clues are even more decisive and more varied.
Let’s jump right into the charts. This time, we’ll start with the general stock market, which finally moved lower in a decisive manner.
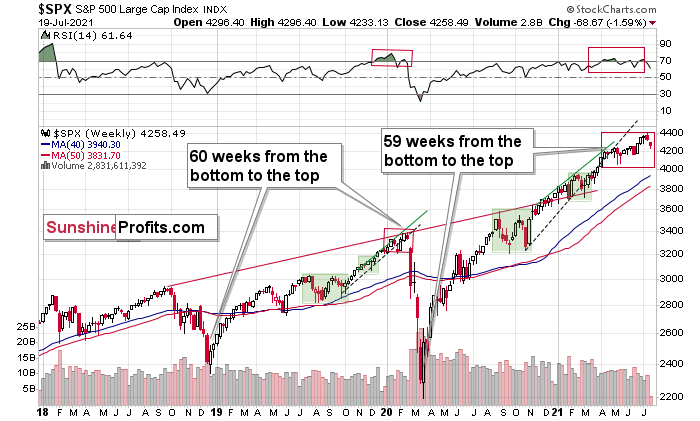
That was the third time when the stock-based RSI moved below the 70 level, which – based on the similarity to early 2020 – might be signaling that the top for this rally in stocks is already in. If it is indeed in, then the really bad times for the mining stocks and silver have just begun. Their yesterday’s performance seems to confirm that.
If it was not the final top for the stock market, then… The precious metals sector is likely to slide anyway because of what’s going on in the USD Index, and because the mining stocks’ underperformance provided us with not one, but multiple screaming sell signals in the previous weeks. Let’s take a look at the USDX.
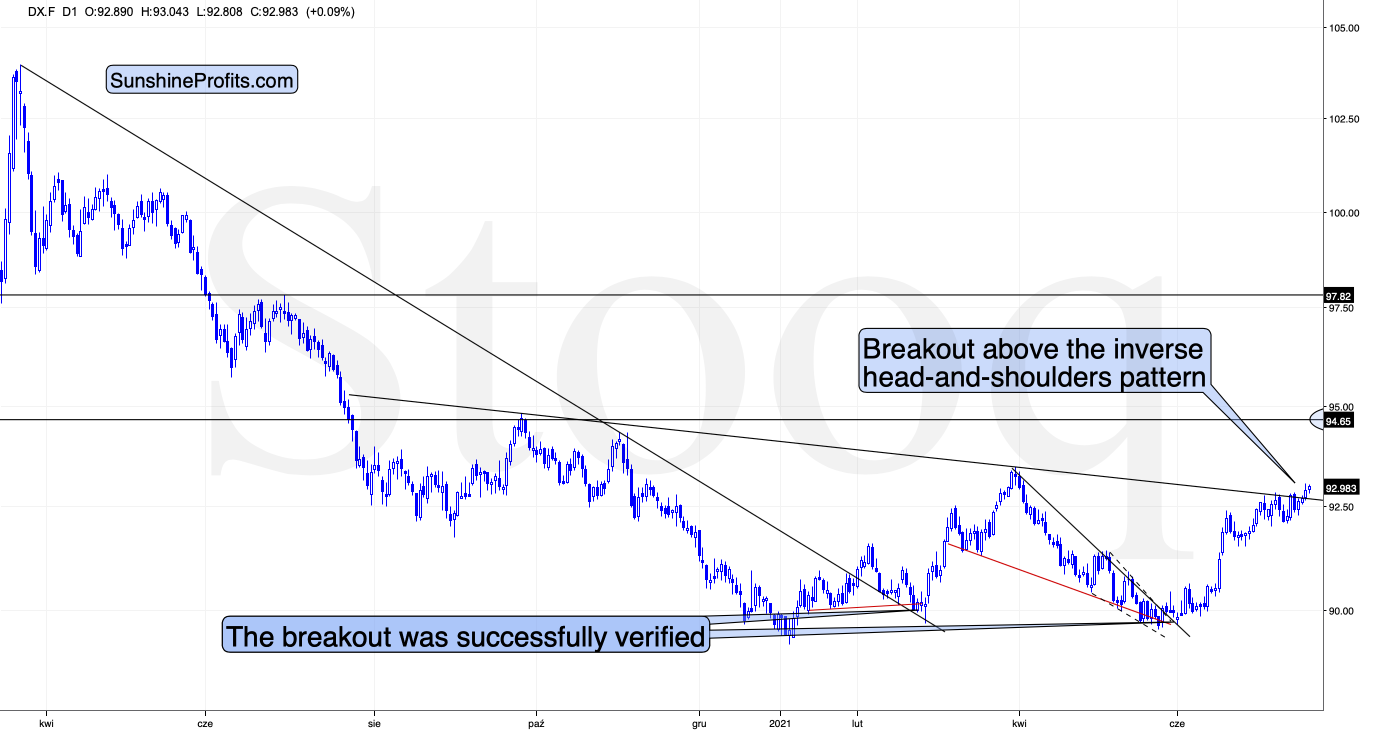
During yesterday’s session, the USD Index moved above the neck level of the broad (~yearly) inverse head-and-shoulders pattern and then it corrected somewhat while still closing the day above the neckline. And it’s been moving slightly higher in today’s session, at least so far.
This is a very bullish price action – the USDX’s breakout was not accidental, nor was it based on geopolitical news (the latter tends to trigger temporary moves that are then reversed). Additionally, it was preceded by a consolidation. Consequently, it seems that this breakout has a huge chance of being confirmed and followed by another sharp rally. The previous highs at about 94.5 are the initial upside target, but based on the inverse H&S pattern, the USDX is likely to rally to about 98.
Consequently, what just happened (the breakout above the formation’s neckline) has really bullish implications for the U.S. currency. And since the latter tends to move in the opposite direction to gold, silver, and mining stocks, it’s also very bearish for them.
Mining Stocks
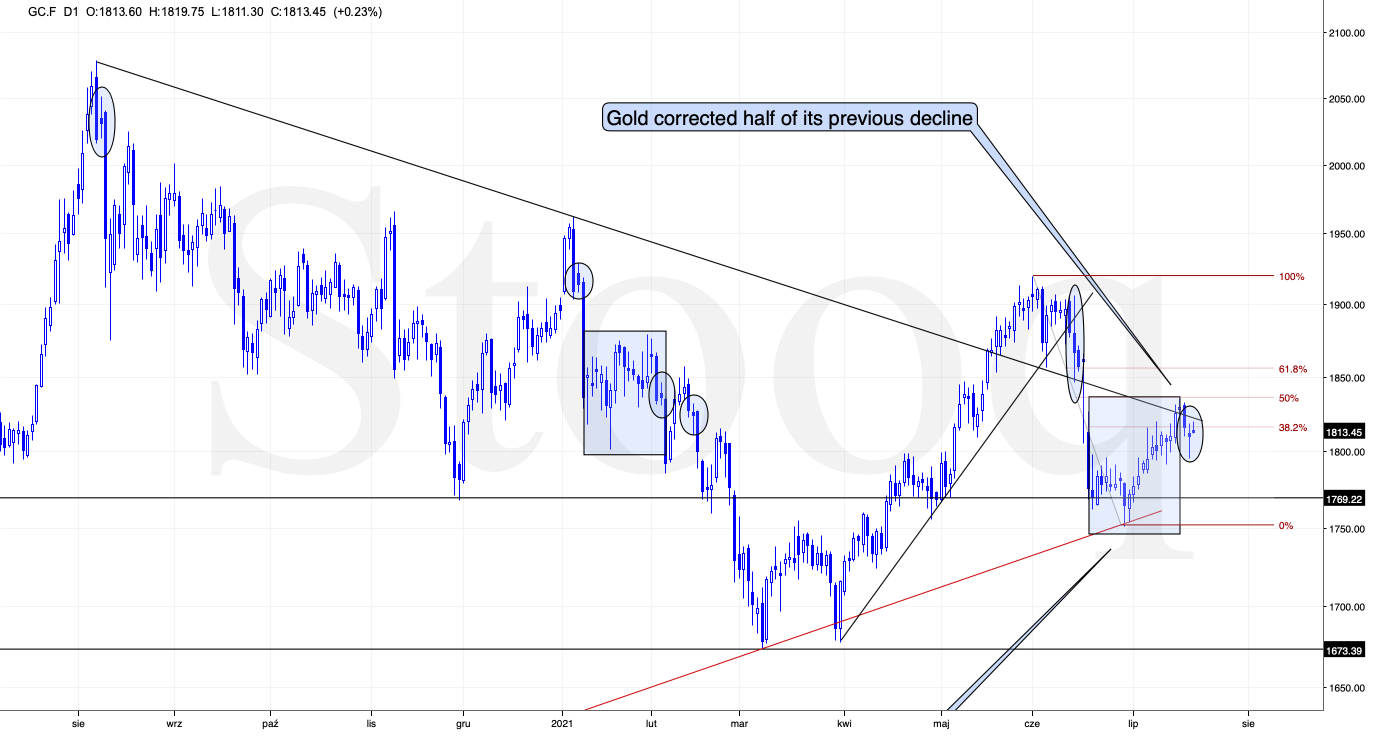
Interestingly, so far, gold didn’t do much. It declined visibly yesterday, but it then came back up before the end of the session. At the moment of writing these words, gold futures are trading just $1.50 below Friday’s (July 16) close. No wonder – even though the USD Index is completing its major, inverse H&S formation, it didn’t move significantly in nominal terms.
This is incredibly exciting for those who hold short positions in the mining stocks because this means that the huge impact falling gold will likely have on the miners is still ahead. And miners declined significantly anyway!
Before moving to the mining stocks, please note that the back-and-forth trading right after the first move lower is normal for gold. I marked those cases with ellipses. Consequently, the fact that gold moved back-and-forth now doesn’t make the forecast for gold bullish. Conversely, it’s a normal course of action right before a powerful slide.
And speaking of powerful slides, gold stocks could no longer wait and they declined before gold did.
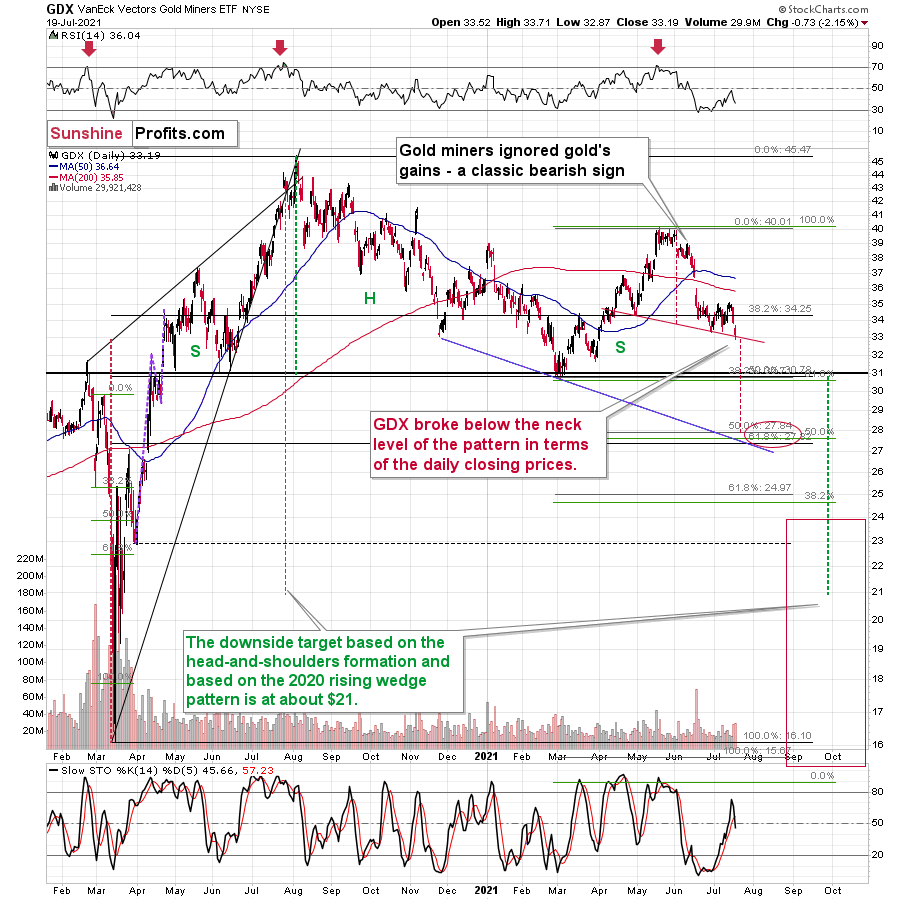
The GDX ETF (senior gold miners) moved below the recent lows, and it closed the day below the neck level of a head-and-shoulders pattern in terms of the closing prices. The stochastic indicator flashed a fresh sell signal as well. While gold is far from its late-April lows, the GDX just closed the day below them.
And if you think this kind of relative weakness is bearish, just wait until you see what the junior mining stocks did.
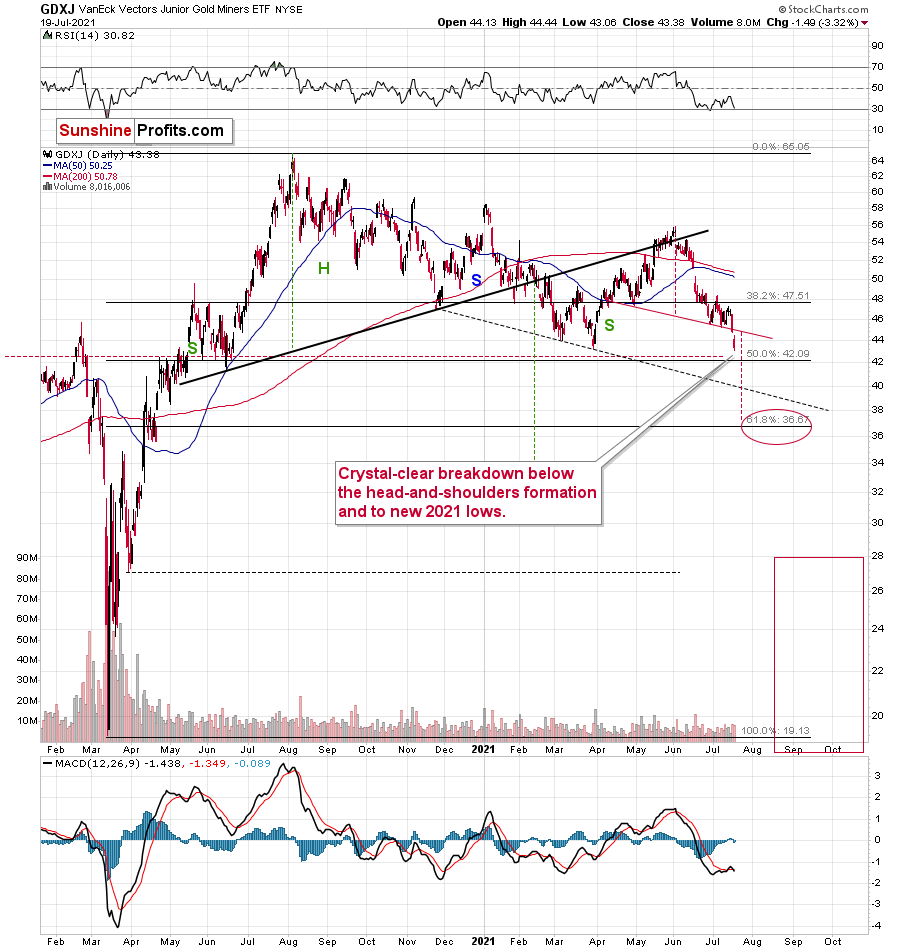
Junior miners just declined not only below the neck level of the recent head-and-shoulders pattern (in a clear way, in both: intraday and closing price terms), but they actually closed the day at new 2021 lows!
Yesterday’s close in the GDXJ was the lowest close in more than a year.
There are two markets that primarily impact the performance of the junior mining stocks. One is gold, and the other is the general stock market. Gold is now about $140 above its 2021 lows, while the S&P 500 is over 16% above its 2021 highs. And yet, the GDXJ is below its previous 2021 lows.
Juniors are underperforming senior gold miners too. You can see that by comparing two previous charts and by examining their ratio.
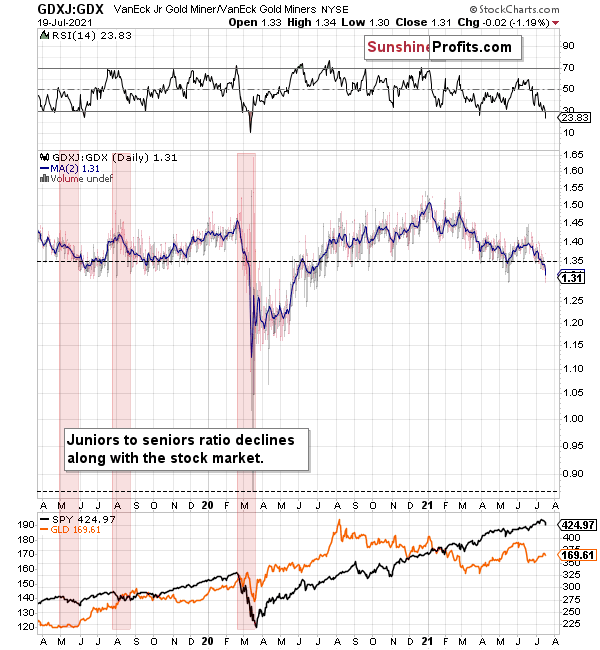
The ratio declines when junior miners underperform seniors. This happens often when the general stock market declines – juniors are more correlated with the latter than the seniors. Interestingly, juniors underperformed recently, even while stocks were strong. If the general stock market declines from here, the underperformance is likely to take an epic form – just as it did in early 2020.
This level of underperformance and weakness is truly breathtaking.
If miners – in particular, juniors – were able to decline so much without meaningful help from gold and the general stock market, just imagine the carnage they will suffer once this “help” finally arrives.
And given the breakout above the neck level of the inverse head-and-shoulders pattern in the USD Index, it seems like the key trigger to set the wheels in motion is already here.
Silver reacted too.
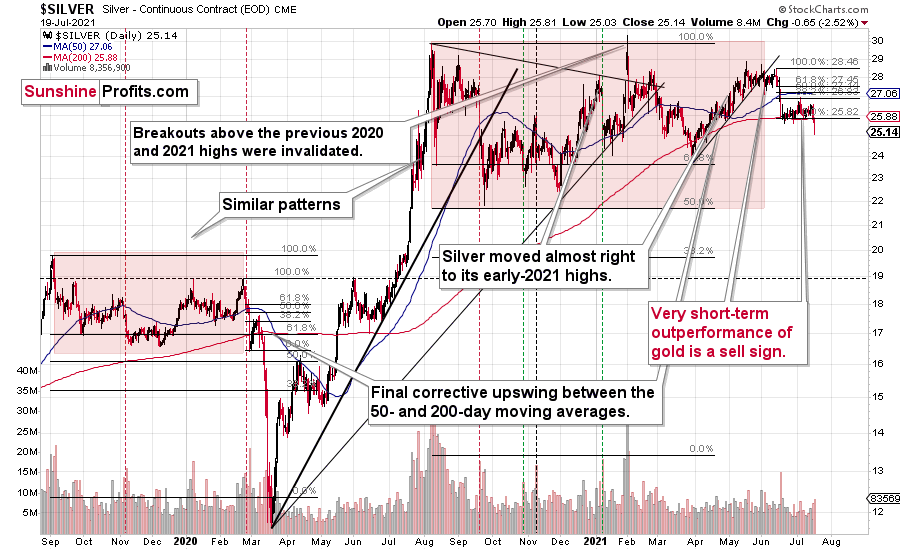
After the lengthy, boring consolidation, the silver price is moving lower once again. Unlike junior miners, it didn’t break below its previous 2021 lows, but it’s showing where the precious metals sector wants to go. Gold’s relative strength is an anomaly, not the key news.
Having said that, let’s take a look at the markets from a more fundamental point of view.
The Almighty Dollar
With U.S. equities suffering their first major bout of panic in months, unfamiliar lights lit up Wall Street on Jul. 19. However, while the sea of red drowned everything from crude to casinos, the development green-lit the USD Index for another rally.
Moreover, while stocks’ one-day weakness was merely a blip on the radar screen, a meaningful correction could light a fire under the USD Index. Case in point: With Bank of America’s Global Wealth and Investment Management (GWIM) clients’ exposure to equities at an all-time high, a reversion to the mean could elicit plenty of sell orders in the coming weeks.
Please see below:
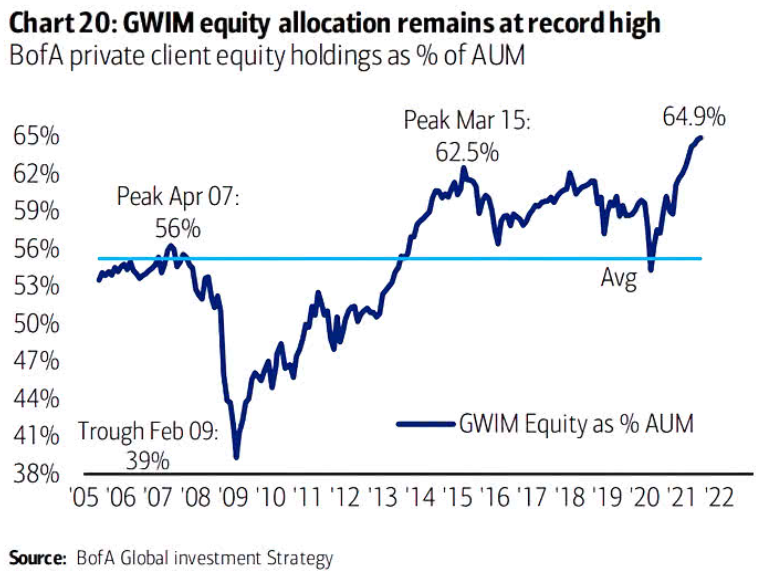
To explain, the blue line above tracks BofA’s GWIM clients’ stock holdings as a percentage of their total portfolio. If you analyze the right side of the chart, it’s easy to spot the excess. However, if their allocation returns to its historical average (roughly 56%), the USD Index should be a major beneficiary.
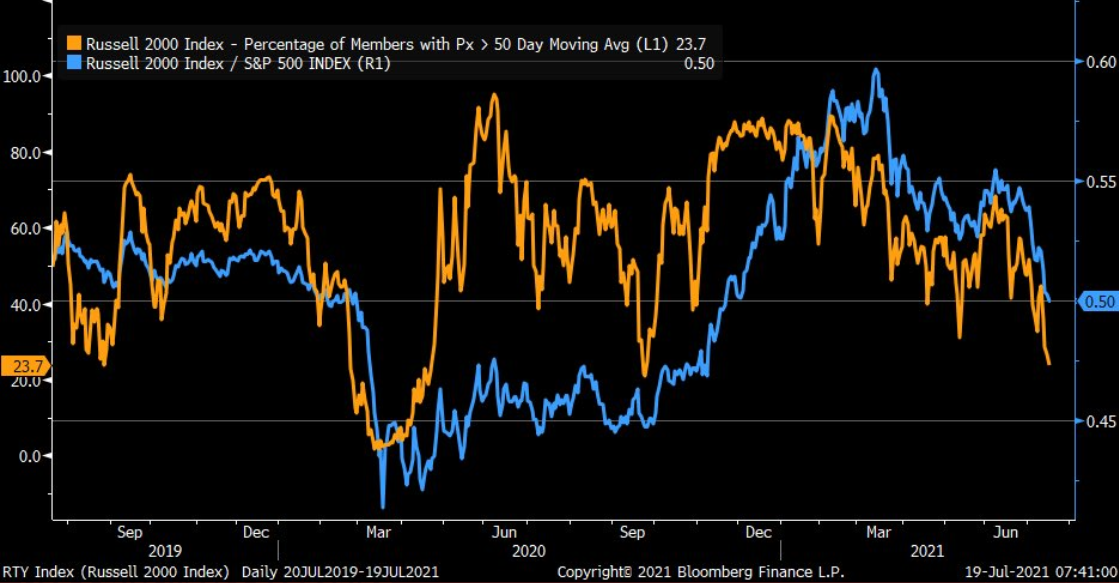
To that point, while the general stock market has been rising in recent weeks, breadth has completely fallen off a cliff. For context, breadth can take on many forms, but it often compares the number of stocks in an index that are rising to the number of stocks in an index that are falling. In a nutshell: if a small portion of stocks are responsible for the uprising, there is severe weakness beneath the surface. And with the Russell 2000 (small caps) demonstrating just that, the weak are already being sent to slaughter.
Please see below:
 Source: Bloomberg/Liz Ann Sonders
 To explain, the orange line above tracks the percentage of stocks in the Russell 2000 that are trading above their 50-day moving average, while the blue line above tracks the Russell 2000/S&P 500 ratio. If you analyze the right side of the chart, you can see that both metrics have moved sharply lower.
Furthermore, while investors have dropped the guillotine on the weakest members of their respective indices, the rotation has caused index heavyweights to become extremely bloated. For example, the five largest stocks in the S&P 500 – Microsoft, Apple, Amazon, Alphabet and Facebook – now account for 23% of the index’s market cap.
Please see below:
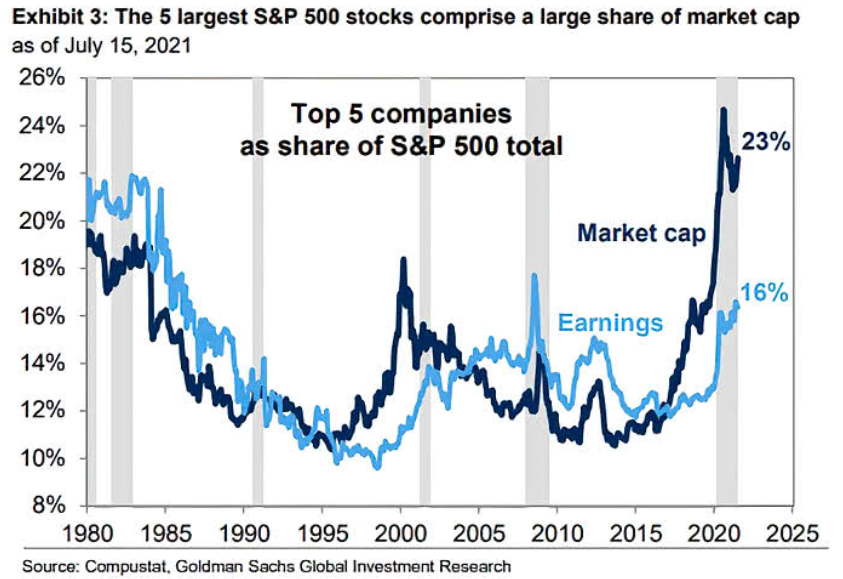
To explain, the five largest companies in the S&P 500 accounted for roughly 18% of the S&P 500’s market cap at the height of the dot-com bubble. And while the figure has declined from its 2020 peak (roughly 25%), it’s been moving higher in recent weeks (follow the dark blue line). As a result, a handful of stocks have been doing the bulk of the S&P 500’s heavy lifting.
Will There Ever Be a Renaissance in Europe?
And while the wheels are in motion, the EUR/USD – which accounts for nearly 58% of the movement of the USD Index – is already struggling to hold 1.1800. Moreover, hopes of an Eurozone economic Renaissance have already come undone.
To explain, I wrote on May 20:
With optimism abound, European banks, energy stocks and breakeven inflation rates have helped boost the EUR/USD. And while investors are extrapolating the cyclical strength as grounds for the European Central Bank (ECB) to reduce its bond-buying program in June, haven’t we seen this movie before?
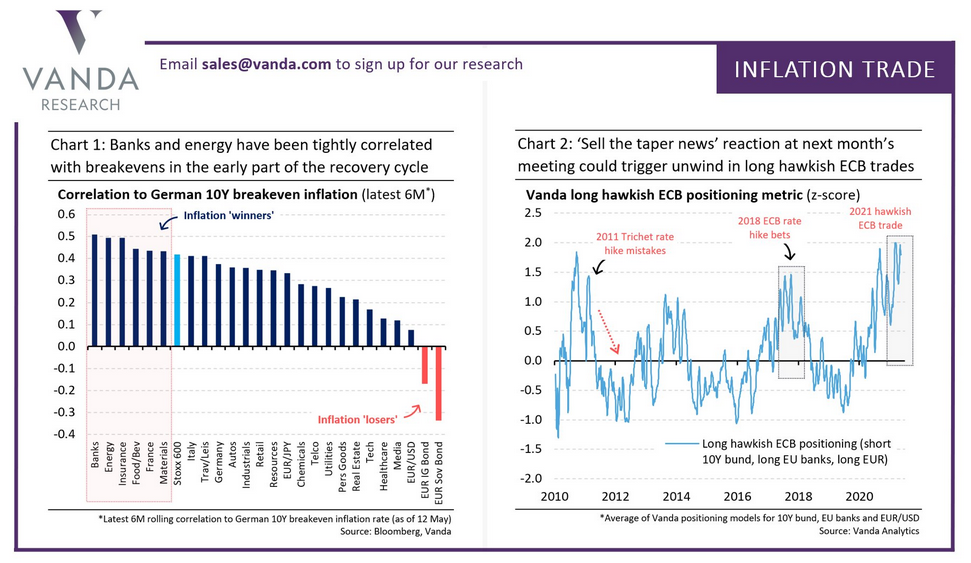
To explain, if you analyze the chart on the right, you can see that hawkish ECB positioning implies being long Eurozone banks, short Eurozone bonds and long the EUR/USD. However, if you analyze the peaks in the light blue line, you can see that prior bets on ECB tightening have ended in extreme disappointment. For example, when the ECB hiked rates twice in 2011, Portuguese sovereign debt was downgraded to junk, and less than a year later, Greece was forced to restructure its debt in order to remain in the European union. Likewise, it didn’t take long for all of the cyclical bets to unwind and for the EUR/USD to plunge. Second, after foolish optimism sent cyclicals soaring in 2018, the bets unraveled, and once again, the EUR/USD plunged. Thus, is this time really different?
Well, with two months mirroring the difference between night and day, cyclical positioning has sunk like a stone.
Please see below:
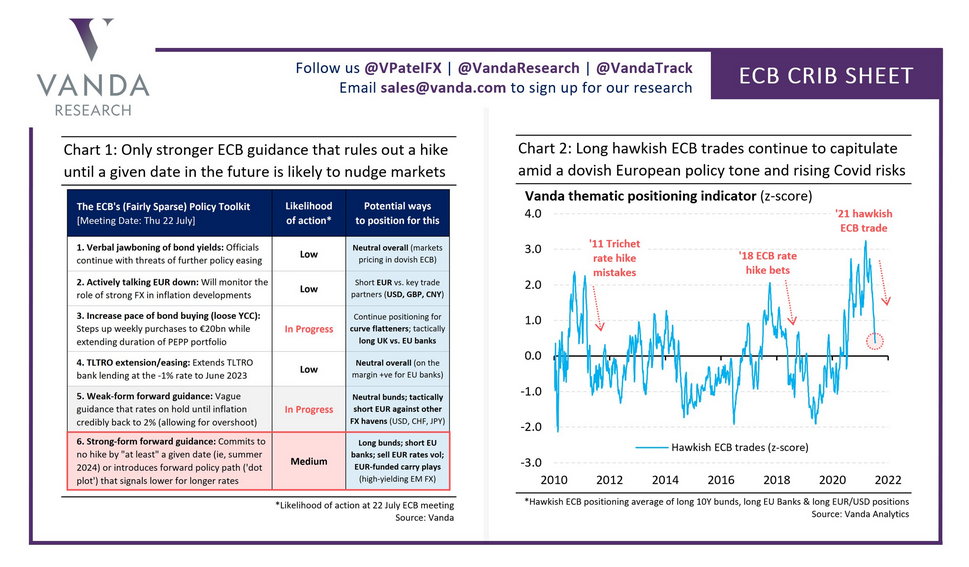
To explain, if you compare the position of the light blue line on the right side of the chart above (approaching zero) with its position on the first chart (roughly 1.75), you can see how much things have changed. As a result, not only is the U.S. economy outperforming the Eurozone, but the U.S. Federal Reserve (FED) and the ECB are worlds apart.
For example, with FED officials’ hawkish rhetoric contrasting Chairman Jerome Powell’s perpetual patience, a game of ‘will they or won’t they’ is already underway. However, with the FED likely to reveal its taper timeline in September, inflation differentials highlight the regional dichotomy.
Please see below:
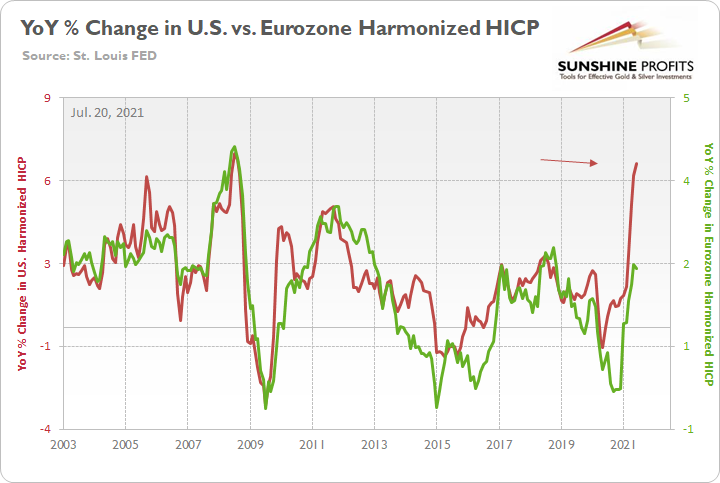
To explain, the green line above tracks the year-over-year (YoY) percentage change in the Eurozone Harmonized Index of Consumer Prices (HICP), while the red line above tracks the YoY percentage change in the U.S. HICP. If you analyze the right side of the chart, it’s not even close. And with the U.S. HICP rising by 6.41% YoY in June and the Eurozone HICP rising by 1.90%, the FED is likely to taper well in advance of the ECB.
Furthermore, investors already sense that the writing is on the wall.
Please see below:
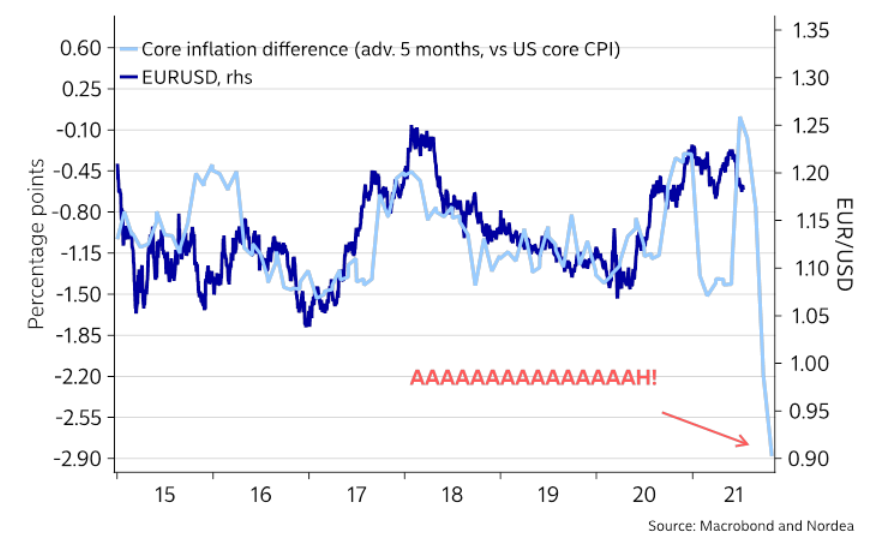
To explain, the dark blue line above tracks the EUR/USD, while the light blue line above tracks the Eurozone-U.S. core Consumer Price Index (CPI) differential (advanced by five months). For context, when the light blue line is falling, it means that the U.S. core CPI is higher than the Eurozone core CPI. Moreover, if you focus your attention on the right side of the chart, you can see that the Eurozone-U.S. inflation spread has fallen precipitously. And with the EUR/USD still relatively elevated, there is plenty of room for the currency pair to move lower.
When Will We See the Taper Timeline?
Finally, with investors coming around to our way of thinking, institutions expect the FED to reveal its taper timeline in August or September.
To explain, I wrote on Jun. 16:
While I’ve been warning for months that the FED will likely taper its asset purchases much sooner than investors think, suddenly, the answer to a question that wasn’t even in Bank of America’s Global Fund Managers Survey in April or May has now become the consensus.
Please see below:
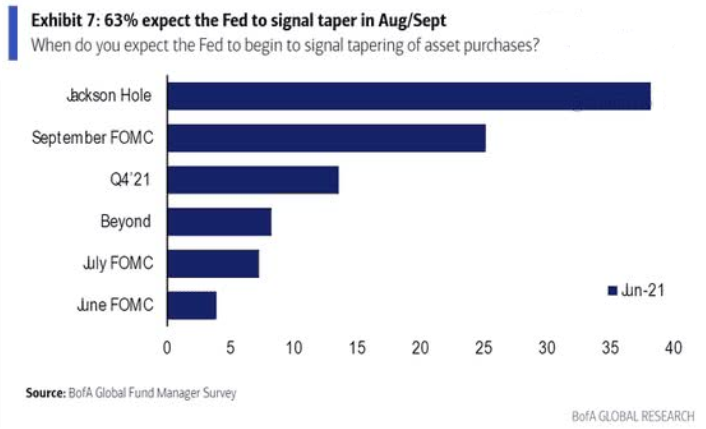
To explain, 63% of respondents now believe that the FED will “signal” a reduction in its bond-buying program by either the Jackson Hole Economic Policy Symposium (which is scheduled for Aug. 26-28) or the Sep. 21/22 policy meeting.
Moreover, with a hawkish shift becoming even more popular in July, institutions realized that Powell’s promises are likely to fade with the summer sun.
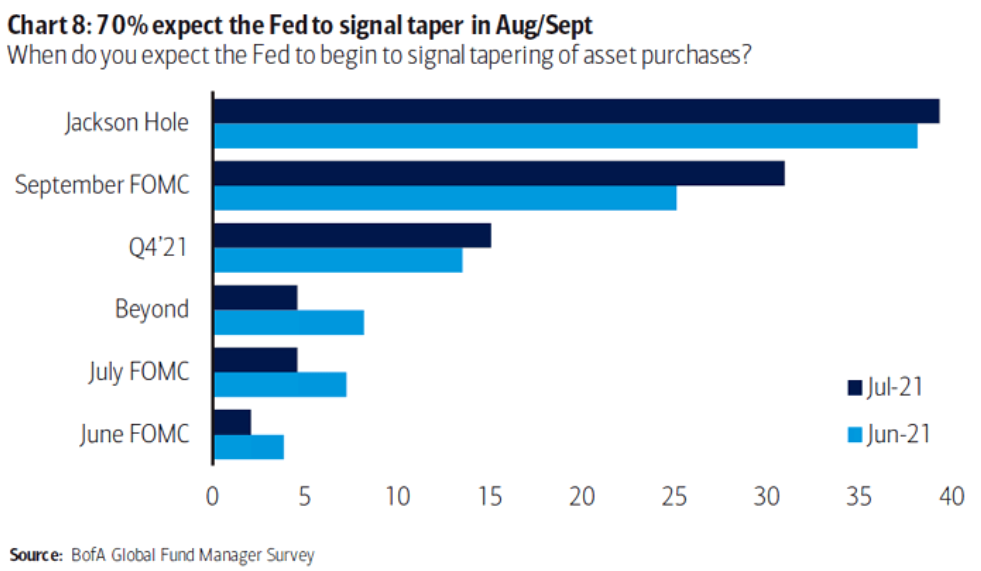
To explain, 70% of respondents now believe that the FED will “signal” a taper by either Jackson Hole or the Sep. 21/22 policy meeting. As such, while the PMs have been major beneficiaries of the FED’s liquidity splurge, they may experience a September to remember for all of the wrong reasons.
In conclusion, while gold demonstrated relative strength on Jul. 19, silver and the gold miners weren’t so lucky. And with the latter’s underperformance an extremely bearish sign, technical and fundamental headwinds continue to plague the precious metals market. On top of that, with the bulk of their recent weakness occurring alongside the S&P 500 strength, if the general stock market suffers a material correction, the slope of the PMs’ slide could steepen. Thus, while corrective upswings are expected along the way, the PMs’ medium-term trend still remains down.
Thank you for reading our free analysis today. Please note that the above is just a small fraction of the full analyses that our subscribers enjoy on a regular basis. They include multiple premium details such as the interim targets for gold and mining stocks that could be reached in the next few weeks. We invite you to subscribe now and read today’s issue right away.
Sincerely,
Przemyslaw Radomski, CFA
Founder, Editor-in-chief -
USDX: A Crocodile Just About To Strike
July 19, 2021, 8:34 AMTaking a sip from a crocodile pond is risky, but some animals try anyway. And die. Beware, as trying to profit from the PM’s pool now could end alike.
Just as ignoring a crocodile hiding in plain sight, ignoring the USD Index is a dangerous activity. And while investors continue to drink from the pond, the greenback’s nose is literally perched at the water’s surface. The USD Index is currently consolidating below the neckline of its inverse (bullish) head & shoulders pattern, so its wide eyes are also glaringly visible. And with a strike liable to happen at any moment, a leap above 93 could make the USD Index devour gold, silver and mining stocks.
To explain, the USD Index often soars during the summer months (major USDX rallies often start during the middle of the year), and while the greenback’s back-and-forth movement has uplifted the PMs, once the USDX resumes its likely uptrend, the former’s optimism could dissipate rather quickly. As a result, if the ambush ushers the USD Index above 93, the next stop is likely 98.
Please see below:
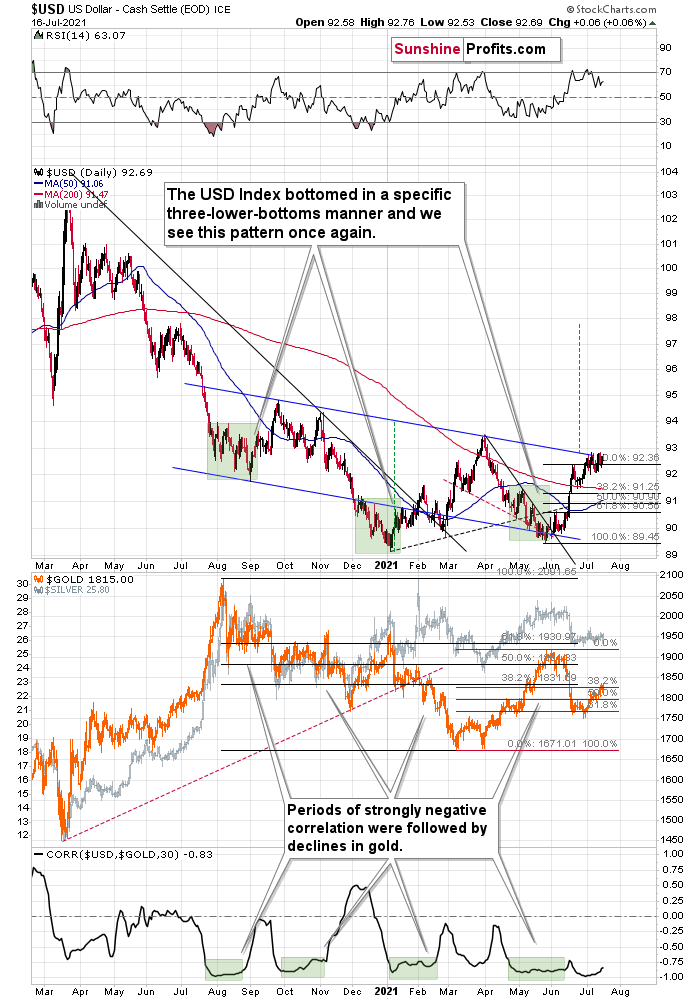
Furthermore, the seasonal thesis remains intact: I mentioned above that the USD Index often records material upswings during the middle of the year. And with the hunter’s disguise nearly always catching overzealous investors by surprise, will the next trap be any different?
In fact, the USD index seems to be breaking above the neck level of its inverse head-and-shoulders formation at the moment of writing these words.
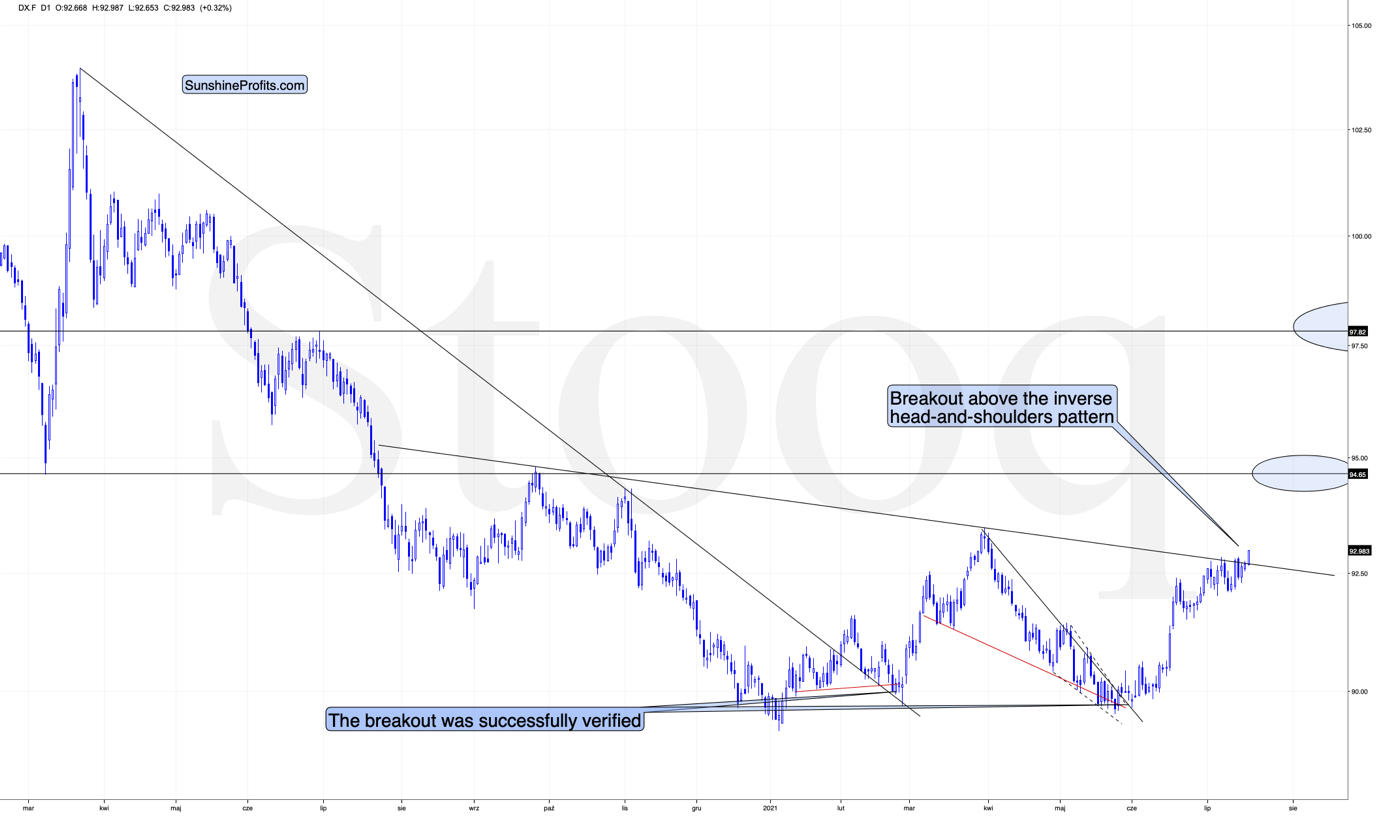
The week started with a breakout, so there’s plenty of time for the markets to react before the next bigger break takes place (the next weekend). In other words, this week could be quite volatile and nothing like the previous weeks’ boredom. Gold, silver, and mining stocks might slide quite profoundly before we hear Friday’s closing bell.
If you analyze the chart below, you can see that summertime surges have been mainstays on the USD Index’s historical record and double bottoms often signal the end of major declines or ignite significant rallies. For example, in 2004, 2005, 2008, 2011, 2014 and 2018, a retest of the lows (or close to them) occurred before the USD Index began its upward flights. In addition, back in 2008, U.S. equities’ plight added even more wind to the USD Index’s sails. And if the general stock market suffers another profound decline (along with gold miners and silver), a sharp re-rating of the USDX is likely in the cards.
Please see below (quick reminder: you can click on the chart to enlarge it):
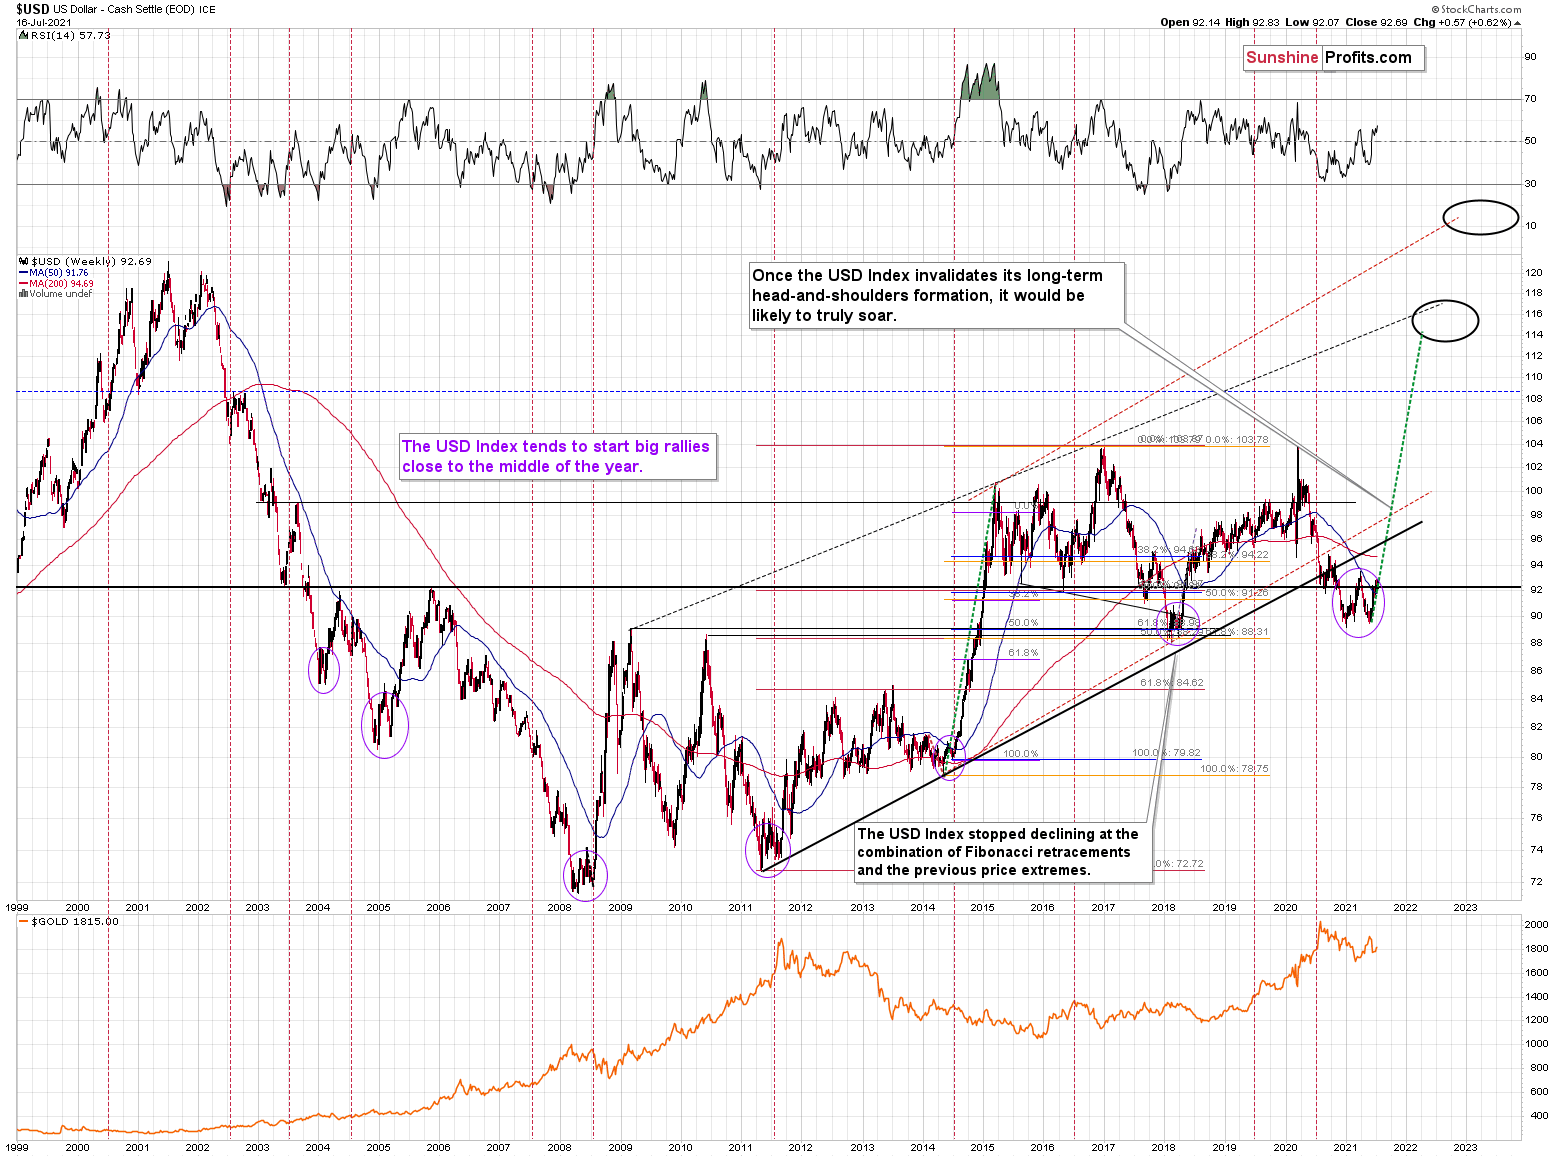
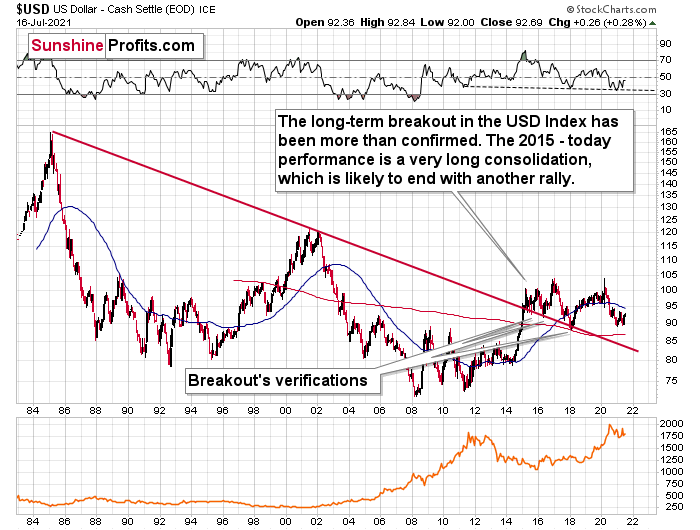
On top of that, the eye in the sky doesn’t lie. And with the USDX’s long-term breakout clearly visible, a profound uptrend is already in place.
Please see below:
As another important variable, the Euro Index’s recent symmetrical decline mirrors the drawdown that we witnessed in mid-2020. And if the Euro Index breaks below the neckline of its bearish head & shoulders pattern, the steep decline could usher the index back to the June 2020 lows or even lower. For context, the EUR/USD accounts for nearly 58% of the movement of the USD Index.
In addition, when the Euro Index reached the neckline of its bearish H&S pattern in early April 2021, late September 2020, and late October 2020, a fierce rally ensued. However, this time around, the corrective upswing has been extremely weak. As a result, with lower highs and lower lows plaguing the Euro Index in recent weeks, it’s likely only a matter of time before the neckline breaks.
Please see below:
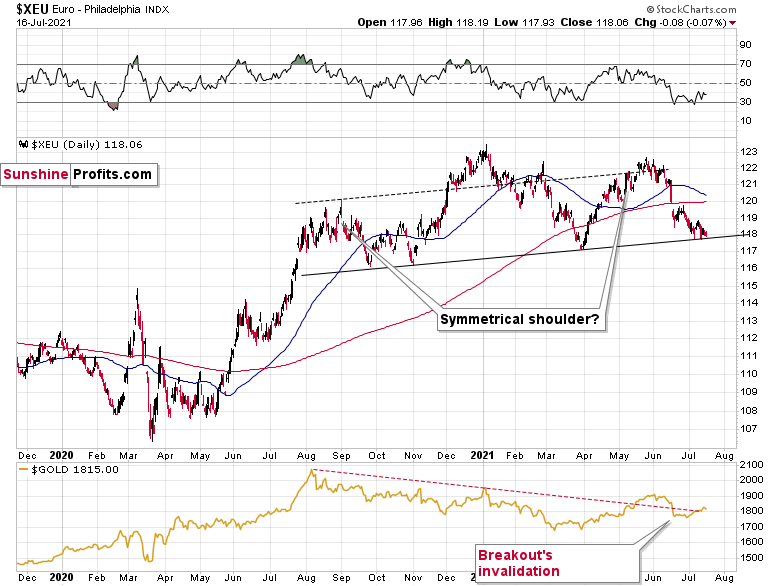
Even more relevant, the completion of the masterpiece could have a profound impact on gold, silver and mining stocks. To explain, gold continues to underperform the euro. If you analyze the bottom half of the chart above, you can see that material upswings in the Euro Index have resulted in diminishing marginal returns for the yellow metal. Thus, the relative weakness is an ominous sign. That’s another point for the bearish price prediction for gold.
The bottom line?
Once the momentum unfolds, ~94.5 is likely the USD Index’s first stop, ~98 is likely the next stop, and the USDX will likely exceed 100 at some point over the medium or long term. Keep in mind though: we’re not bullish on the greenback because of the U.S.’ absolute outperformance. It’s because the region is fundamentally outperforming the Eurozone, and the relative performance is what really matters.
In conclusion, while gold, silver and mining stocks are increasingly treading water, the USD Index’s jaws are expanding. And with the greenback poised to take a bite out of the trio’s performance over the medium term, the precious metals could be in for a long and arduous recovery. However, after the drama unfolds, gold, silver and mining stocks are poised to continue their long-term secular uptrends.
Thank you for reading our free analysis today. Please note that the above is just a small fraction of the full analyses that our subscribers enjoy on a regular basis. They include multiple premium details such as the interim targets for gold and mining stocks that could be reached in the next few weeks. We invite you to subscribe now and read today’s issue right away.
Sincerely,
Przemyslaw Radomski, CFA
Founder, Editor-in-chief -
Is FED Playing Cat and Mouse with Investors?
July 16, 2021, 8:44 AMInvestors prick up their ears to front-run the FED’s taper. It looks like a tricky game though, given its contradictory statements – what’s the truth?
You Don't Say!
At first it was nothing, then it was something, and now it’s…
 Source: CNBC
Speaking with CNBC on Jul. 15, U.S. Treasury Secretary Janet Yellen – who preceded Jerome Powell as the Chairman of the U.S. Federal Reserve (FED) – said that declining long-term Treasury yields is “the market expressing its views that inflation does remain under control.” However, while the contradictory statements of “several more months of rapid inflation” and “inflation does remain under control” are quite humorous, she has a point: with bond investors eager to front-run the FED’s forthcoming taper, the U.S. 10-Year Treasury yield has been the main casualty. And with gold often moving inversely of the U.S. 10-Year real yield, the development has strengthened the yellow metal.
Please see below:
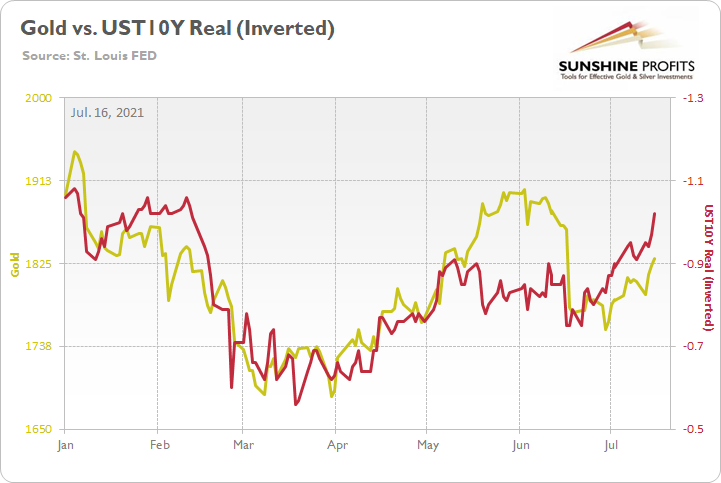
To explain, the gold line above tracks the London Bullion Market Association (LBMA) Gold Price, while the red line above tracks the inverted U.S. 10-Year real yield. For context, inverted means that the latter’s scale is flipped upside down and that a rising red line represents a falling U.S. 10-Year real yield, while a falling red line represents a rising U.S. 10-Year real yield.
If you analyze the relationship, you can see that one’s pain is often the other one’s gain. And if you focus your attention on the right side of the chart, you can see that the U.S. 10-Year real yield’s recent malaise has uplifted the yellow metal.
Despite that, while Powell and Yellen continue to make excuses for their lack of foresight, Powell actually told Congress on Jul. 15 that surging inflation caught ‘everyone’ by surprise.
Please see below:
 Source: CNBC
However, while I’ve been warning for months that inflation was likely to boil, both policymakers are underestimating the lasting effects. And in the process, bond investors have buried their heads in the sand. Conversely, while “temporary” and “transitory” remain Powell’s favorite buzzwords, supply chain disruptions still haven’t fully filtered into the core Consumer Price Index (CPI).
Please see below:
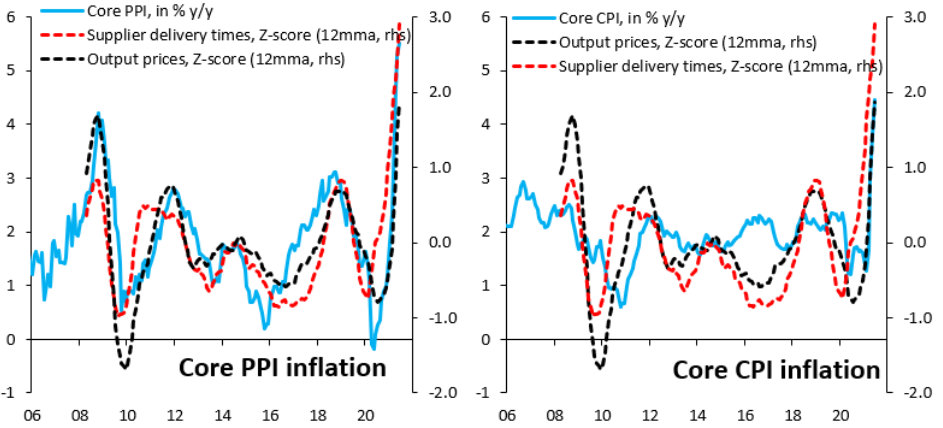 Source: Robin Brooks/Institute of International Finance (IIF)
To explain, the chart on the left depicts the effect of supplier delivery times on the core Producer Price Index (PPI). If you analyze the relationship, you can see that the red and light blue lines are roughly three standard deviations above their historical average (follow the scales on the right side of both charts). Conversely, if you analyze the chart on the right, you can see that the core CPI (the light blue line) is still less than two standard deviations above its historical average. As a result, the core CPI still hasn’t felt the brunt of the inflationary surge.
What’s more, the New York FED released its Empire State Manufacturing Survey on Jul. 15. And with one header reading “Selling Prices Increase at Record-Setting Pace,” cost-push inflation remains alive and well.
Please see below:
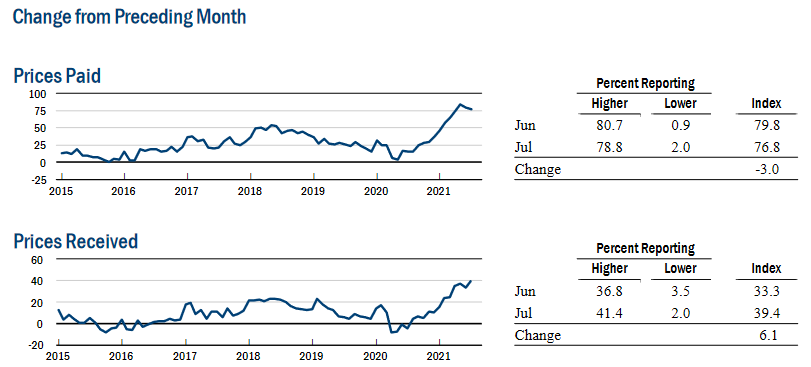 Source: NY FED
In addition, New York’s’ manufacturing sector expanded rapidly and supply chain disruptions (delivery times) remain an issue. An excerpt from the report read:
“Business activity grew at a record-setting pace in New York State, The headline general business conditions index shot up twenty-six points to 43.0. New orders and shipments increased robustly. Delivery times continued to lengthen substantially, and inventories expanded. Employment grew strongly, and the average workweek increased. Input prices continued to increase sharply, and selling prices rose at the fastest pace on record. Looking ahead, firms remained optimistic that conditions would improve over the next six months, with the index for future employment reaching another record high.”
Turning to the second major player in gold’s bearish forecast, the USD Index is hitting its stride. And as sentiment shifts, the U.S. dollar is gaining significant support from speculators.
Please see below:
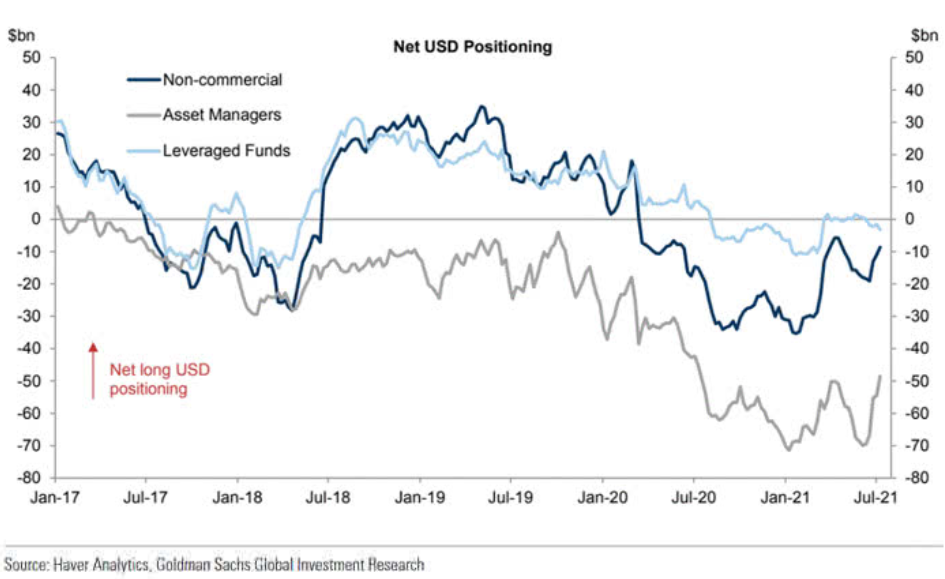
To explain, the dark blue, gray and light blue lines above represent net-long positions of non-commercial (speculative) futures traders, asset managers and leveraged funds. When the lines are falling, it means that the trio have reduced their net-long positions and are expecting a weaker U.S. dollar. Conversely, when the lines are rising, it means that the trio have increased their net-long positions and are expecting a stronger U.S. dollar. And if you analyze the right side of the chart, you can see that non-commercial futures traders and asset managers have completely changed their tune (though leveraged funds’ movement has been minimal).
On top of that, the latest USD Outlook from Vanda Research offers an interesting take on the FED’s forthcoming taper. Predicting that a ‘buy the rumor, sell the news’ event will unfold over the next several weeks, the firm believes that speculators will likely front-run the expected announcement.
Please see below:
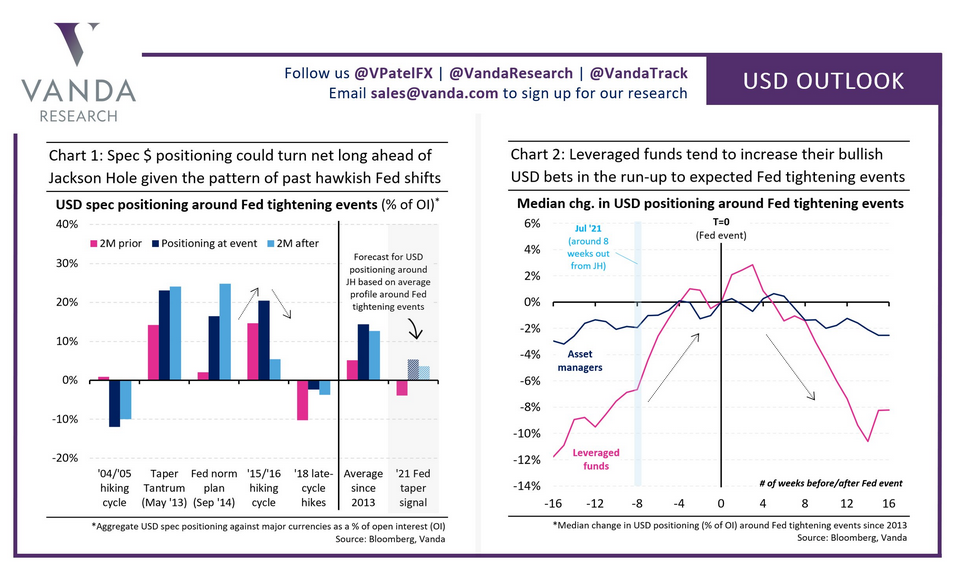
To explain, if you analyze the first chart on the left, the pink bars (two months before), the dark blue bars (actual event) and the light blue bars (two months after) depict speculators’ USD positioning before, during and after hawkish FED announcements. And if you analyze the relationship, more often than not, speculators buy the U.S. dollar in anticipation, hold throughout the event and then bail after the drama unfolds. As further evidence, if you turn to the chart on the right, you can see that leveraged funds are notorious for front-running the FED’s actions. With eight weeks preceding major FED events often resulting in significant increases in net-long positioning, leveraged funds aim to strike while the iron is hot. The bottom line? With the Jackson Hole Economic Policy Symposium scheduled for Aug. 26-28 (roughly six weeks away), another front-run could already be underway.
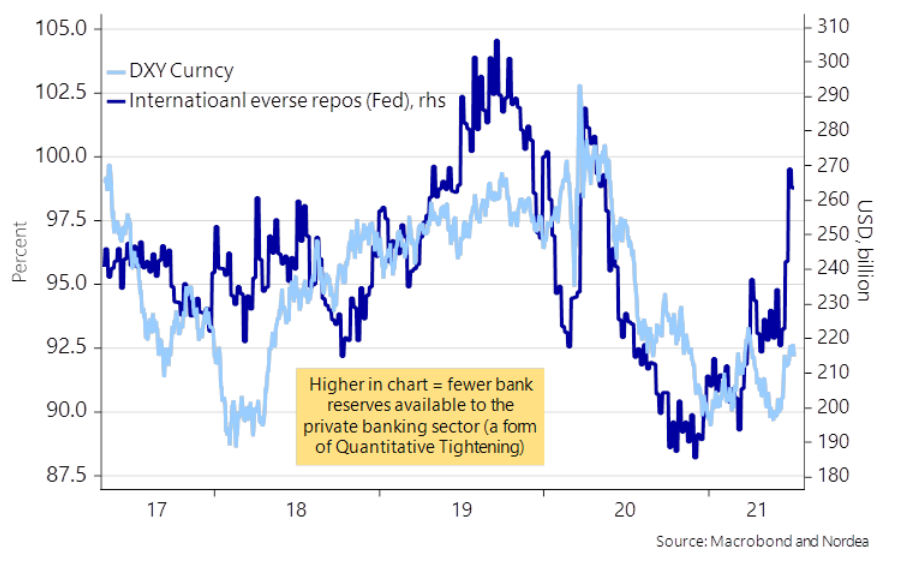
Finally, while I’ve been warning for some time that the FED’s daily reverse repurchase agreements are the fundamental equivalent of a shadow taper (though, it doesn’t have the same psychological effect), the FED sold $776.261 billion worth of reverse repos on Jul. 15 and $859.975 billion worth of reverse repos on Jul. 14. More importantly, though, with the U.S. 10-Year Treasury yield often moving inversely of the FED’s international reverse repos, bond investors are behaving as if the taper is already underway.
Please see below:
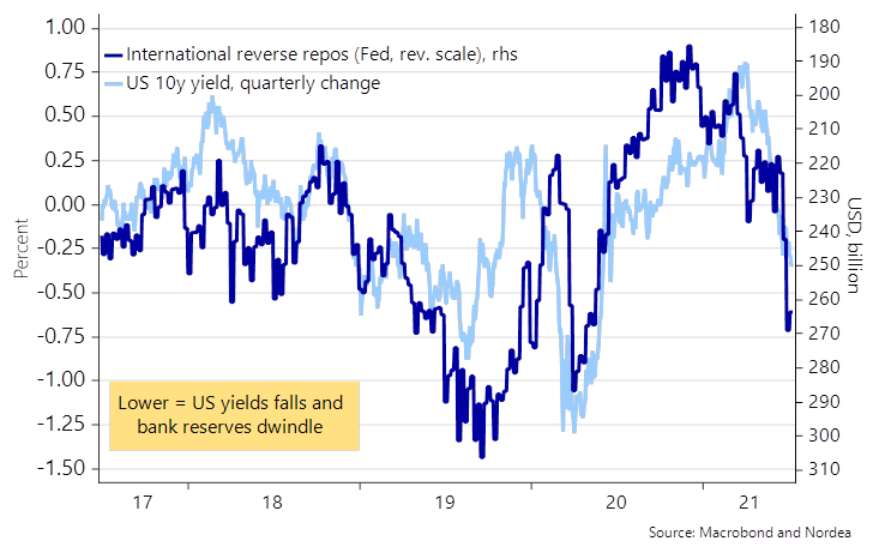
To explain, the dark blue line above tracks the quarterly percentage change in the U.S. 10-Year Treasury yield, while the light blue line above tracks the FED’s inverted (scale flipped upside down) international reverse repos. If you analyze the relationship, you can see that the larger the liquidity drain, the more bond investors position for slower growth, lower inflation and a hawkish FED.
Conversely, the dynamic has the opposite effect on the USD Index. With U.S. dollars being siphoned out of the system, it’s akin to the FED reducing its QE program. As such, the liquidity drain (lower supply of dollars) is extremely bullish for the greenback.
In conclusion, while the PMs have been buoyed by falling real yields, their relative performance has been extremely subdued. From March through May, gold rallied sharply once the U.S. 10-Year real yield reversed course. This time around, however, the bounce has been tepid, as concerns over a prospective taper counters the bullish optimism. As a result, with the USD Index gaining steam, inflation surging and a taper announcement likely to commence in September, the PMs’ optimism could evaporate at the drop of a dime. Thus, it’s prudent to avoid reading too much into their recent strength.
Thank you for reading our free analysis today. Please note that the above is just a small fraction of the full analyses that our subscribers enjoy on a regular basis. They include multiple premium details such as the interim targets for gold and mining stocks that could be reached in the next few weeks. We invite you to subscribe now and read today’s issue right away.
Sincerely,
Przemyslaw Radomski, CFA
Founder, Editor-in-chief


Gold Investment News
Delivered To Your Inbox
Free Of Charge
Bonus: A week of free access to Gold & Silver StockPickers.
Gold Alerts
More-
Status
New 2024 Lows in Miners, New Highs in The USD Index
January 17, 2024, 12:19 PM -
Status
Soaring USD is SO Unsurprising – And SO Full of Implications
January 16, 2024, 8:40 AM -
Status
Rare Opportunity in Rare Earth Minerals?
January 15, 2024, 2:06 PM

