

Briefly: in our opinion, full (300% of the regular position size) speculative short positions in mining stocks are justified from the risk/reward point of view at the moment of publishing this Alert.
After profound declines, corrective upswings are not uncanny – they are the norm. Consequently, seeing one in gold is not bullish.
The lack of bullish implications here is confirmed by the lack of true strength in the rest of the precious metals sector: silver, senior miners, and junior miners.
Let’s jump into the charts for details:
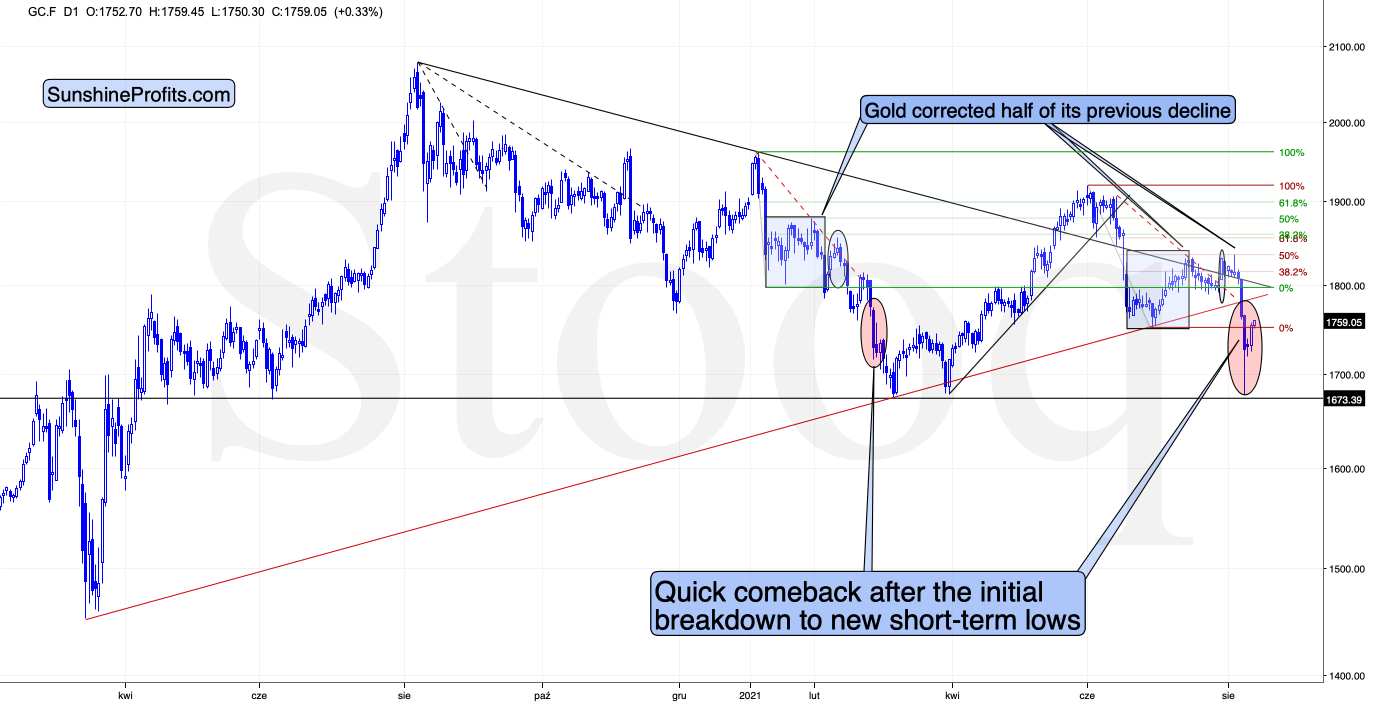
In yesterday’s analysis I wrote that if gold moved back to the previously broken lows at about $1,750, it wouldn’t invalidate the bearish narrative.
At the moment of writing these words, gold is trading at $1,759, which – from the broader point of view – is still “about $1,750”. The June low in terms of closing prices is $1,763.60, so there was no invalidation of the breakdown in terms of closing prices. In other words, nothing really changed.
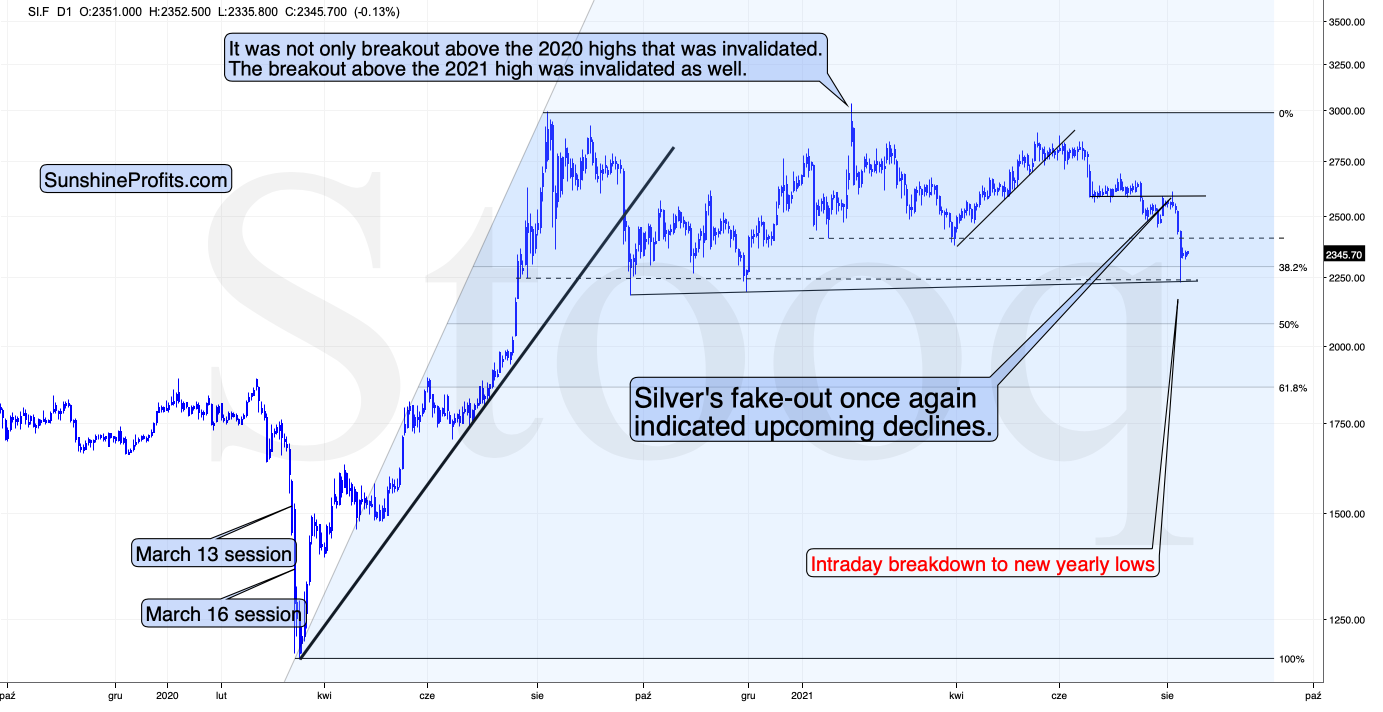
Silver did practically nothing, which means that it confirmed the breakdown below the previous 2021 lows. This “nothing” has, thus, bearish implications.
The Gold Miners
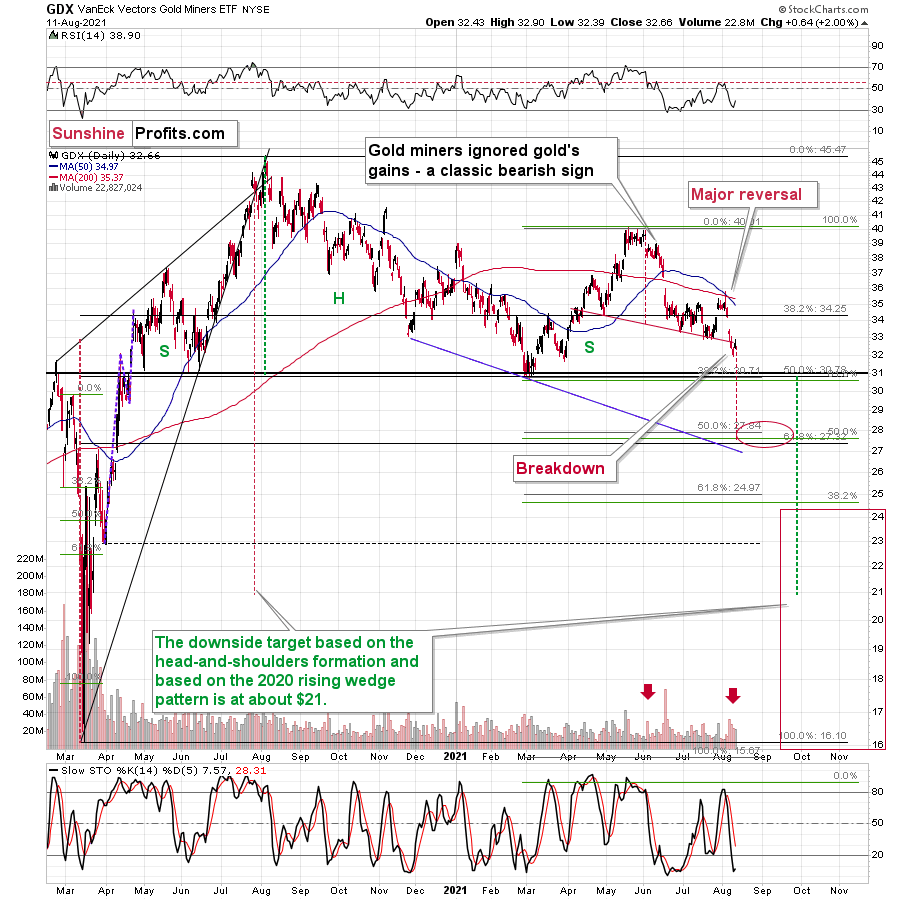
The GDX ETF (a proxy for senior miners) moved higher but gave some of the gains away before the end of the session. Interestingly, it declined enough not to invalidate the breakdown below the neck level of the head and shoulders pattern. This means that the breakdown was confirmed and that the overall implications of yesterday’s session are bearish.
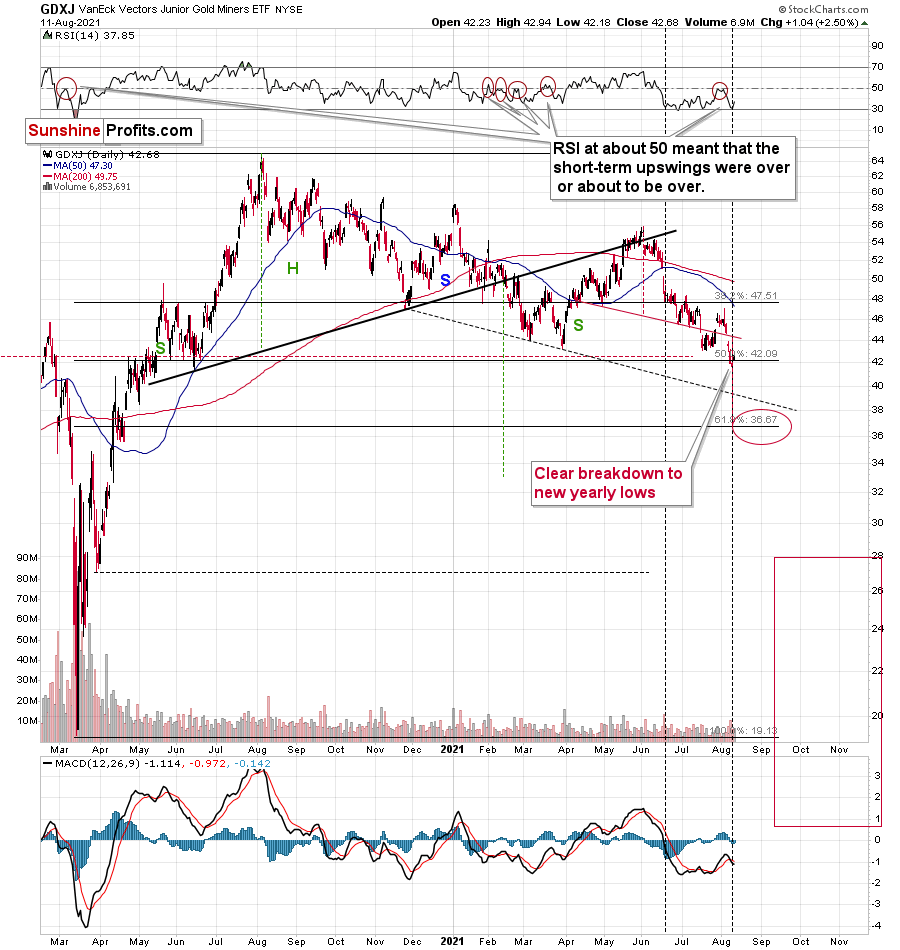
In the case of the GDXJ ETF (a proxy for junior miners), we saw something similar, but with regard to the breakdown to new yearly lows. Juniors moved slightly higher but ended the day below the July lows. Consequently, the breakdown to new 2021 lows was confirmed. This opens the door wide open to new lows.
In other words, it means that the profits from our short positions in the junior miners are likely to increase rather sooner than later.
Having said that, let’s take a look at the market from a more fundamental angle.
Open to Interpretation
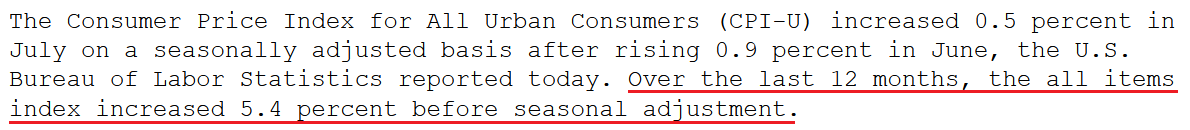
With inflation surging and investors attempting to rationalize the recent spikes, I warned on Jul. 15 (and Aug. 11) that soaring prices would likely persist a lot longer than many expect.
I wrote:
The year-over-year (YoY) increase in the commodity PPI implies a headline CPI print of roughly 5.15% to 5.65% for July (when the data is released on Aug. 11). Thus, while economists have finally caught up to our estimates – with the consensus expecting a 5.3% YoY increase in the headline CPI today – the autumn months will likely generate even more upside surprises.
And how has it turned out? Well, with the headline CPI rising by 5.4% YoY on Aug. 11, the inflation gauge is now 2.7x the U.S. Federal Reserve’s (FED) annual 2% target.
Please see below:
 Source: The U.S. Bureau of Labor Statistics (BLS)
More importantly, though, with CNBC leading with the headline “Dow rises 220 points to new record after inflation report is not as bad as feared,” notice how the perception of weak inflation is actually bullish for the precious metals. For context, I’ve been warning for months that surging inflation is a net-negative for the PMs, due to the reaction function of the bond market, the FED’s taper timeline and the behavior of the USD Index.
Please see below:
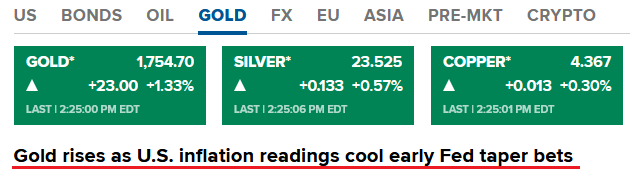 Source: CNBC
On the flip side, while the daily narratives are entertaining and often lift the PMs’ spirits, the reality is that their medium-term outlooks remain extremely treacherous. To explain, while the USD Index suffered on Aug. 11, the liquidity drain was on full display. And with a lower supply of U.S. dollars extremely bullish for the greenback, the merry-go-round of QE resulted in the FED’s daily reverse repurchase agreements surpassing $1 trillion for the second time on record.
For context, a reverse repurchase agreement (repo) occurs when an institution offloads cash to the FED in exchange for a Treasury security (on an overnight or short-term basis). And with U.S. financial institutions currently flooded with excess liquidity, they’re shipping cash to the FED at an alarming rate.
Please see below:
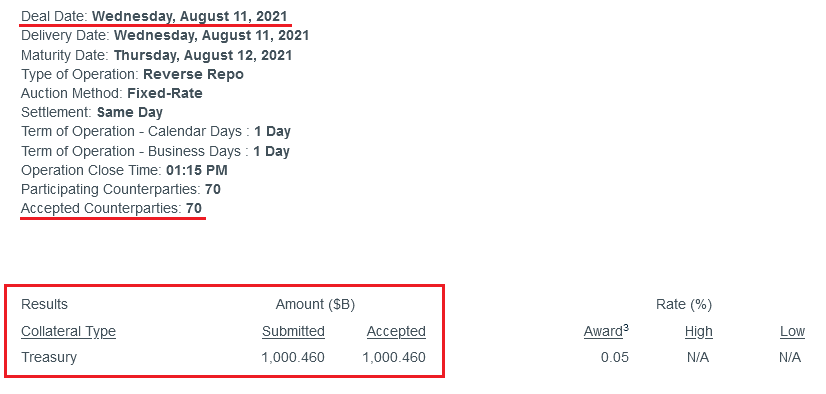 Source: New York FED
What’s more, while CNBC considers 2.7x the FED’s inflation target enough to “cool” the taper talk, the hawks were still out in full force on Aug. 11. Speaking with the aforementioned CNBC, Dallas FED President Robert Kaplan said that “the reason I’m saying we ought to begin the tapering soon is I think these purchases are very well-equipped to stimulate demand. But we don’t have a demand problem in the economy …. What I don’t want to do is keeping running at this speed for too long, and then we’re going to have to take more aggressive action down the road.”
And what does that mean for his taper timeline?
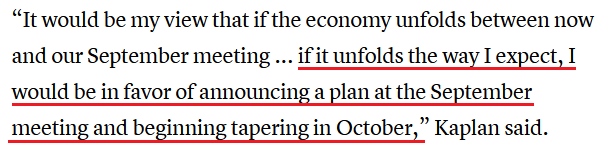 Source: CNBC
In addition, Richmond FED President Thomas Barkin also said on Aug. 11 that he thinks that "we will get there in the next few months."
"We are closing in,” he said .... “I don't know exactly when that will be. When we do close in on it I am very supportive of tapering and moving back toward a normal environment as quickly as the economy allows us.”
Speaking her mind as well, Kansas City FED President Esther George also said on Aug. 11 that “with the recovery underway, a transition from extraordinary monetary policy accommodation to more neutral settings must follow.”
She added:
 Source: Bloomberg
Could You Increase Oil Output… Please?
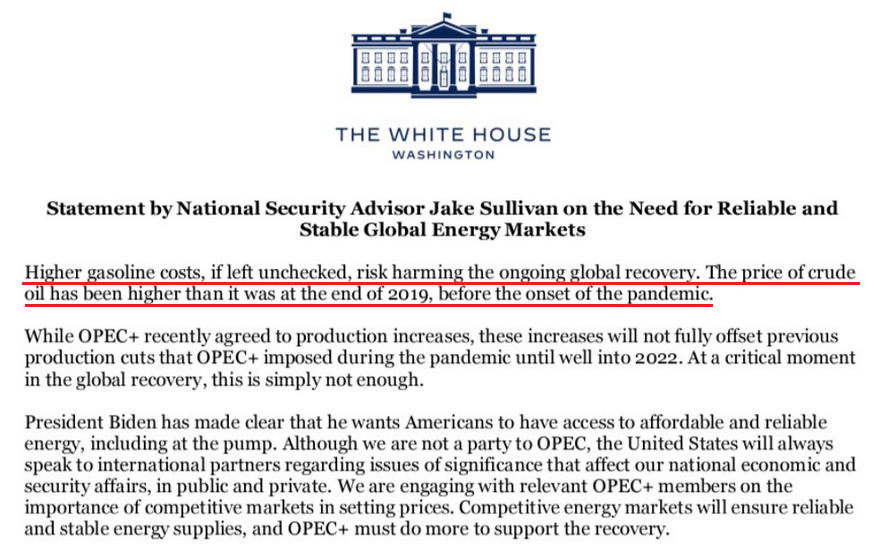
On top of that, with The White House apparently not getting the ‘peak inflation’ memo, the Biden administration actually put out a statement on Aug. 11 asking OPEC+ to increase its oil output to help curb surging gasoline prices. And while the action not only contradicts the administration’s promotion of green energy, it also highlights the extreme anxiety regarding the inflationary pressures that confront the United States.
Please see below:
 Source: The White House
Circling back to the USD Index, while the currency basket fell below 93 on Aug. 11, the daily weakness is much more semblance than substance. Case in point: I warned on Jun.9 (and updated the data on Jul. 7) that the EUR/USD was materially overvalued and that prophecies of an Eurozone economic Renaissance would eventually unwind.
I wrote:
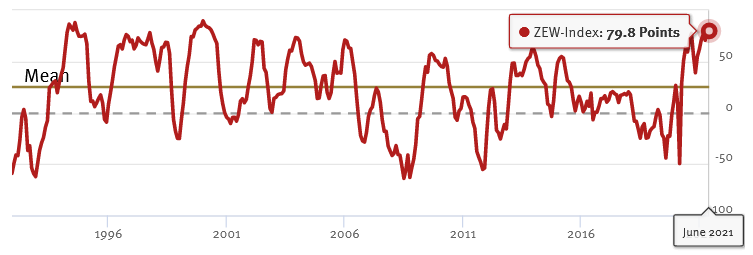
Because the EUR/USD accounts for nearly 58% of the movement of the USD Index, the currency pair is of critical importance. And while investors continue to buy hope and sell reality, rather than rising to 86.0 (the consensus estimate), the German ZEW Economic Sentiment Index (released on Jun. 8) fell from 84.4 in May to 79.8 in June. For context, Germany is Europe’s largest economy.
Please see below:
 Source: ZEW
To explain, the red line above tracks the German ZEW Economic Sentiment Index. If you analyze the behavior, you can see that 79.8 is still well above its historical average. More importantly, tough, notice how abnormally high readings are often followed by swift reversions? And with the prior high (84.4) only superseded by 2000, there is an awful lot of optimism already priced into the EUR/USD.
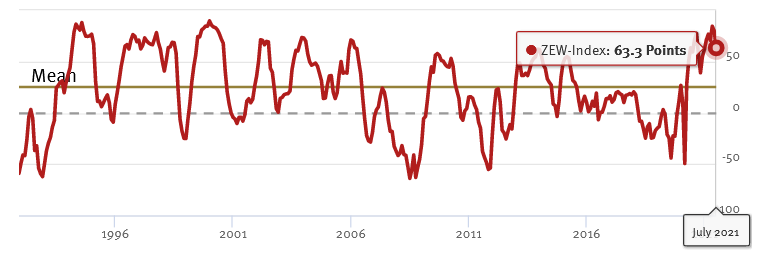
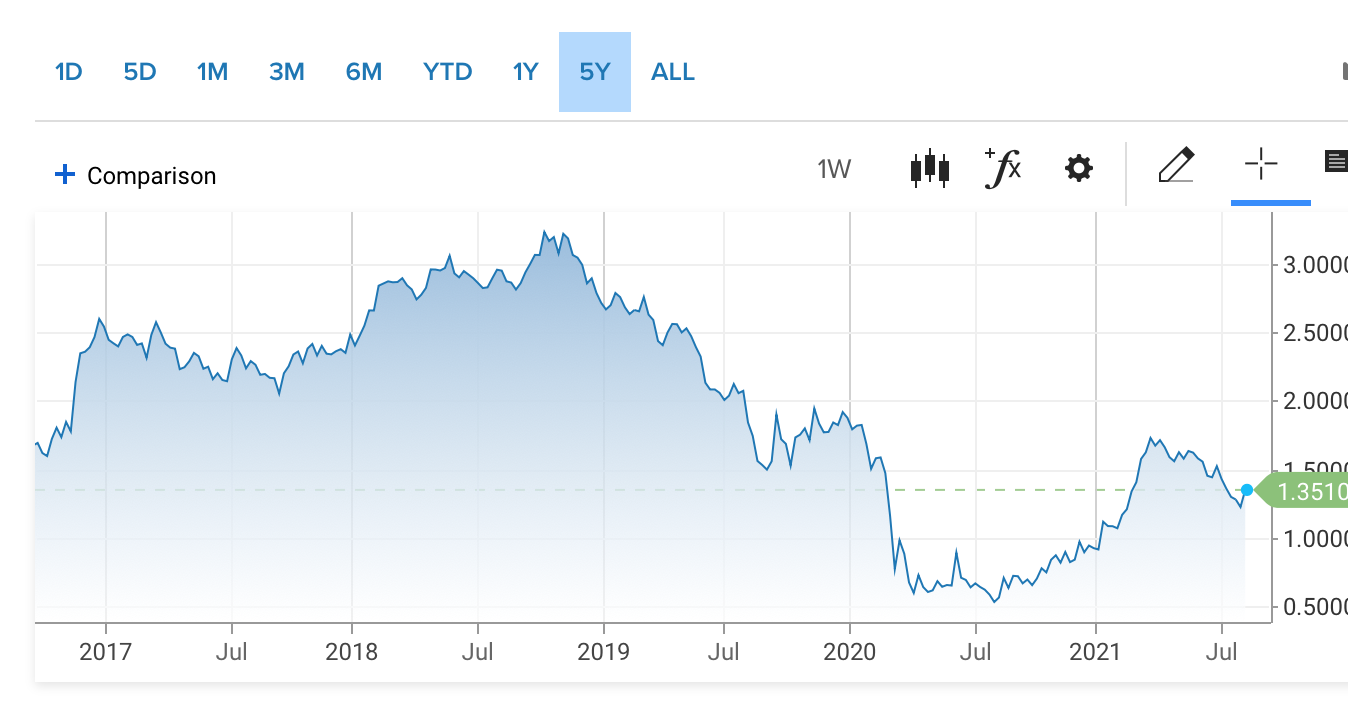
To that point, if we fast forward to Jul. 6, the German ZEW Economic Sentiment Index sunk to 63.3. And following right along, the EUR/USD ended the Jul. 6 session at its lowest level since Mar. 24.
Please see below:
 Source: ZEW
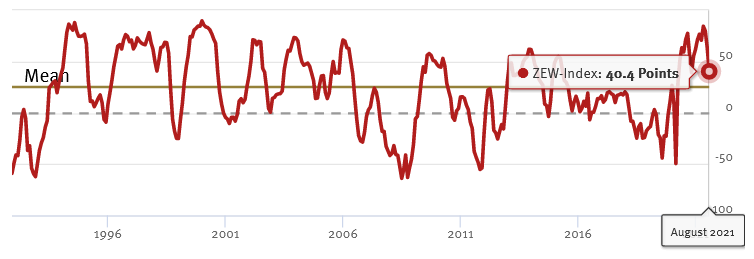
And now, with August’s reading falling off a cliff, the German ZEW Economic Sentiment Index (released on Aug. 10) fell to 40.4 – its lowest level since November 2020.
Please see below:
 Source: ZEW
What’s more, ZEW President Achim Wambach wrote the following:
“Expectations have declined for the third time in a row. This points to increasing risks for the German economy, such as from a possible fourth COVID-19 wave starting in autumn or a slowdown in growth in China. The clear improvement in the assessment of the economic situation, which has been ongoing for months, shows that expectations are also weakening due to the higher growth already achieved.”
EUR/USD Rolling Down The Hill
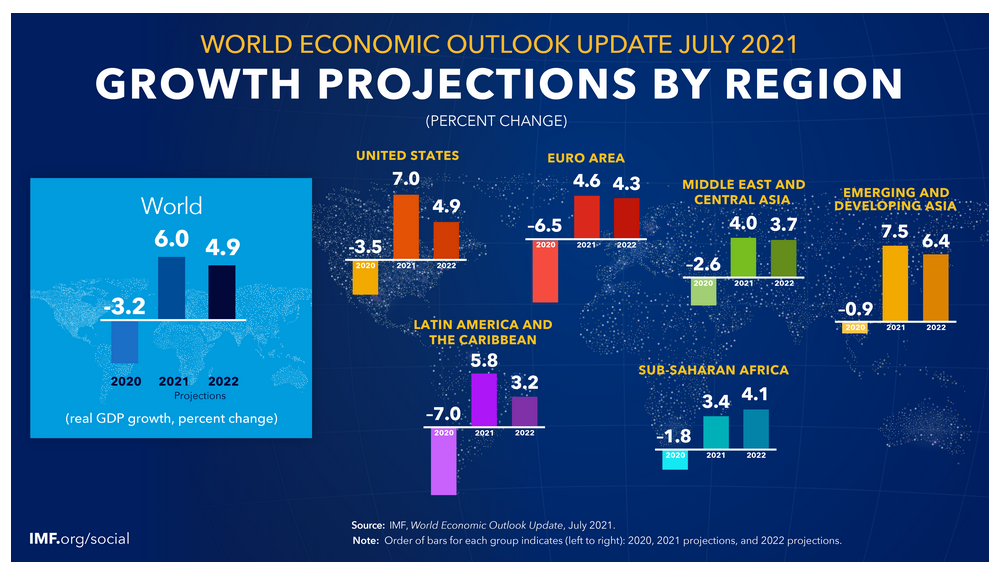
Finally, with the International Monetary Fund (IMF) releasing its World Economic Outlook update on Jul. 27, the group’s forecasts also support a weaker EUR/USD. An excerpt from the report read:
“Growth prospects have been revised up for 2021–22 from expected further normalization in the second half of 2021 as vaccine rollout proceeds and with additional fiscal support. The significantly improved outlook for the US economy derives from the impact of anticipated legislation boosting infrastructure investment and strengthening the social safety net in the second half of 2021. The additional support is expected to lift 2021 US GDP growth by 0.3 percentage point and 2022 growth by 1.1 percentage points, with positive spillovers to trading partners.”
For context, while the IMF increased its 2021 and 2022 U.S. real GDP growth forecasts by 0.6 points and 1.4 points respectively, Euro Area forecasts only increased by 0.2 and 0.5 points (both updates are relative to the IMF’s projections in April). The bottom line? With the U.S. suffering a smaller decrease in real GDP growth than the Eurozone in 2020 and expected to record larger increases in real GDP growth in 2021 and 2022, the EUR/USD remains poised for a downward re-rating over the next few months.
In conclusion, shifting sentiment uplifted the PMs on Aug. 11, as reality was silenced amid the daily optimism. However, with FED officials still hawkish, reverse repos still rising, the USD Index still undervalued and the U.S. yield curve largely ignoring all of the daily noise, the PMs’ serenity will likely fade once again. As such, while corrective upswings are perfectly normal within the context of a medium-term decline, a plethora of fundamental indicators signal that the PMs will likely experience lower lows in the coming months.
Overview of the Upcoming Part of the Decline
- The corrective upswing in gold is over, and the big decline seems to be already underway.
- After miners slide in a meaningful and volatile way, but silver doesn’t (and it just declines moderately), I plan to switch from short positions in miners to short positions in silver. At this time, it’s too early to say at what price levels this would take place – perhaps with gold close to $1,600. I plan to exit those short positions when gold shows substantial strength relative to the USD Index, while the latter is still rallying. This might take place with gold close to $1,350 - $1,500 and the entire decline (from above $1,900 to about $1,475) would be likely to take place within 6-20 weeks, and I would expect silver to fall the hardest in the final part of the move. This moment (when gold performs very strongly against the rallying USD and miners are strong relative to gold – after gold has already declined substantially) is likely to be the best entry point for long-term investments, in my view. This might also happen with gold close to $1,475, but it’s too early to say with certainty at this time.
- As a confirmation for the above, I will use the (upcoming or perhaps we have already seen it?) top in the general stock market as the starting point for the three-month countdown. The reason is that after the 1929 top, gold miners declined for about three months after the general stock market started to slide. We also saw some confirmations of this theory based on the analogy to 2008. All in all, the precious metals sector would be likely to bottom about three months after the general stock market tops.
- The above is based on the information available today, and it might change in the following days/weeks.
Please note that the above timing details are relatively broad and “for general overview only” – so that you know more or less what I think and how volatile I think the moves are likely to be – on an approximate basis. These time targets are not binding or clear enough for me to think that they should be used for purchasing options, warrants or similar instruments.
Gold / Silver Trade Info
In the previous weeks, I’ve been featuring a specific section in the description of my thoughts about one’s trading capital. It stated:
For-your-information targets (our opinion; we continue to think that mining stocks are the preferred way of taking advantage of the upcoming price move, but if for whatever reason one wants / has to use silver or gold for this trade, we are providing the details anyway.):
Silver futures upside profit-take exit price: unclear at this time - initially, it might be a good idea to exit when gold moves to $1,683
Gold futures upside profit-take exit price: $1,683
Now, since gold touched this level on Monday (Aug. 9), if one’s profits on the short positions in gold and/or silver were realized (congratulations!), I think that re-entering those positions is justified from the risk to reward point of view right now, with the same profit-take price. Naturally, I prefer to be shorting junior gold miners than gold or silver at this time, but if the reason due to which one couldn’t enter a short position in the junior miners is still intact, re-entering the short position in gold and/or silver would be justified from the risk to reward point of view (at least in my view).
Letters to the Editor
Q: I have another question for PR. He gives as the target price of gold $1683, but then he refers to a sell-off that will take gold to 1500. I am missing the timing of these two events.
My question is: Could you provide clarification on whether PR expects two different events or one event with two possible price levels?
Should I take profit at $1683 or keep the positions until the sell-off which PR describes? A: I expect gold to decline to its previous 2021 lows (perhaps bottoming close to $1670), then to rebound somewhat and consolidate, and then to slide once again, bottoming in the $1,350 - $1,500 range. I plan to exit the short position with gold close to its 2021 lows (but I’m going to base the GDXJ’s exit on the GDXJ price, not on gold itself). It’s not yet clear if I want to profit from the rebound. The more volatile it is in the case of the miners and the more bullish indications we get at that time, the more likely it will become. Either way, I plan to get back on the short side of the market and exit it when gold moves to the $1,350 - $1,500 area. When exactly? When gold shows substantial strength regardless of the continuation of the rally in the USD Index. If gold stocks show strength relative to gold at that time, it will serve as another bullish confirmation. This is also when I will most likely write about buying precious metals with one’s long-term investment capital.
Q: Hello, thank you for your analyses. I realize you are reading trends as they come, and these trends can change. But as it is right now, I am wondering about the reference to the 2nd half of August as a probable gold bottom. Would this be the scenario in which there is a short-term bottom, corresponding to the JDST sell around $16? Does it seem likely that we will see JDST at the original $39 sell threshold? Would you go long in miners after JDST goes to $16, then re-enter JDST and follow to $39? Is it likely for silver to continue to fall after that level in JDST? I realize you cannot answer any of these questions with any certainty, I’m just wondering which trends are more likely. Thank you.
A: Thank you, I’m very happy that you enjoy reading them.
Yes, the short-term bottom in the precious metals sector in the second half of August would be likely to correspond to the GDXJ and the JDST at my short-term target levels, meaning the JDST at around $16.
The JDST might move to $39 later this year, but I will recalculate this – final – target once we are closer to it. A lot depends on the performance of the general stock market with regard to the more distant/extreme price targets for juniors.
I will consider going long miners (or gold) after the above-mentioned targets are reached, but as I discussed in the previous reply, a lot “depends”. It might even be the case that in addition to going long a part of the precious metals sector (if I choose to do so at all), I might short bitcoin. This might seem very surprising at this time, but based on my preliminary research, the quick, short-term declines in bitcoin tend to start when gold rebounds. I will research this phenomenon more and will likely (if I find that relationship meaningful after digging into it) report it to you in one of the upcoming analyses.
It might be the case that I exit the short positions in the mining stocks ( / long positions in the JDST) in order to short silver for a very short time. This would require a situation in which miners slide but silver doesn’t. This might or might not happen on a short-term basis though. If it doesn’t happen now, then it’s still likely to happen before the final bottom, and we could still take advantage of the fact that silver tends to catch up with miners close to the end of a given price move.
Q: I have read the reports on your site and understood the possibility of higher interest rates and a possible taper. At the same time, there is the infrastructure bill and its enormous spending and the specter of inflation. My understanding is that the U.S. cannot afford higher interest rates because of the high debt. So it seems that the talk of higher rates and a taper is a smoke screen. To add to my confusion, some analysts are saying we are years away from the next cycle low and that the real cycle high that many see around the corner is actually a couple of decades away. What is Mr. Radomski's outlook for gold in the one-to-five-year range given these circumstances?
A: Thank you for the question. I will discuss the fundamental issues more thoroughly in the following analyses, but for now, please note that long-term rates are likely to go higher based on the very long-term cycles in them.
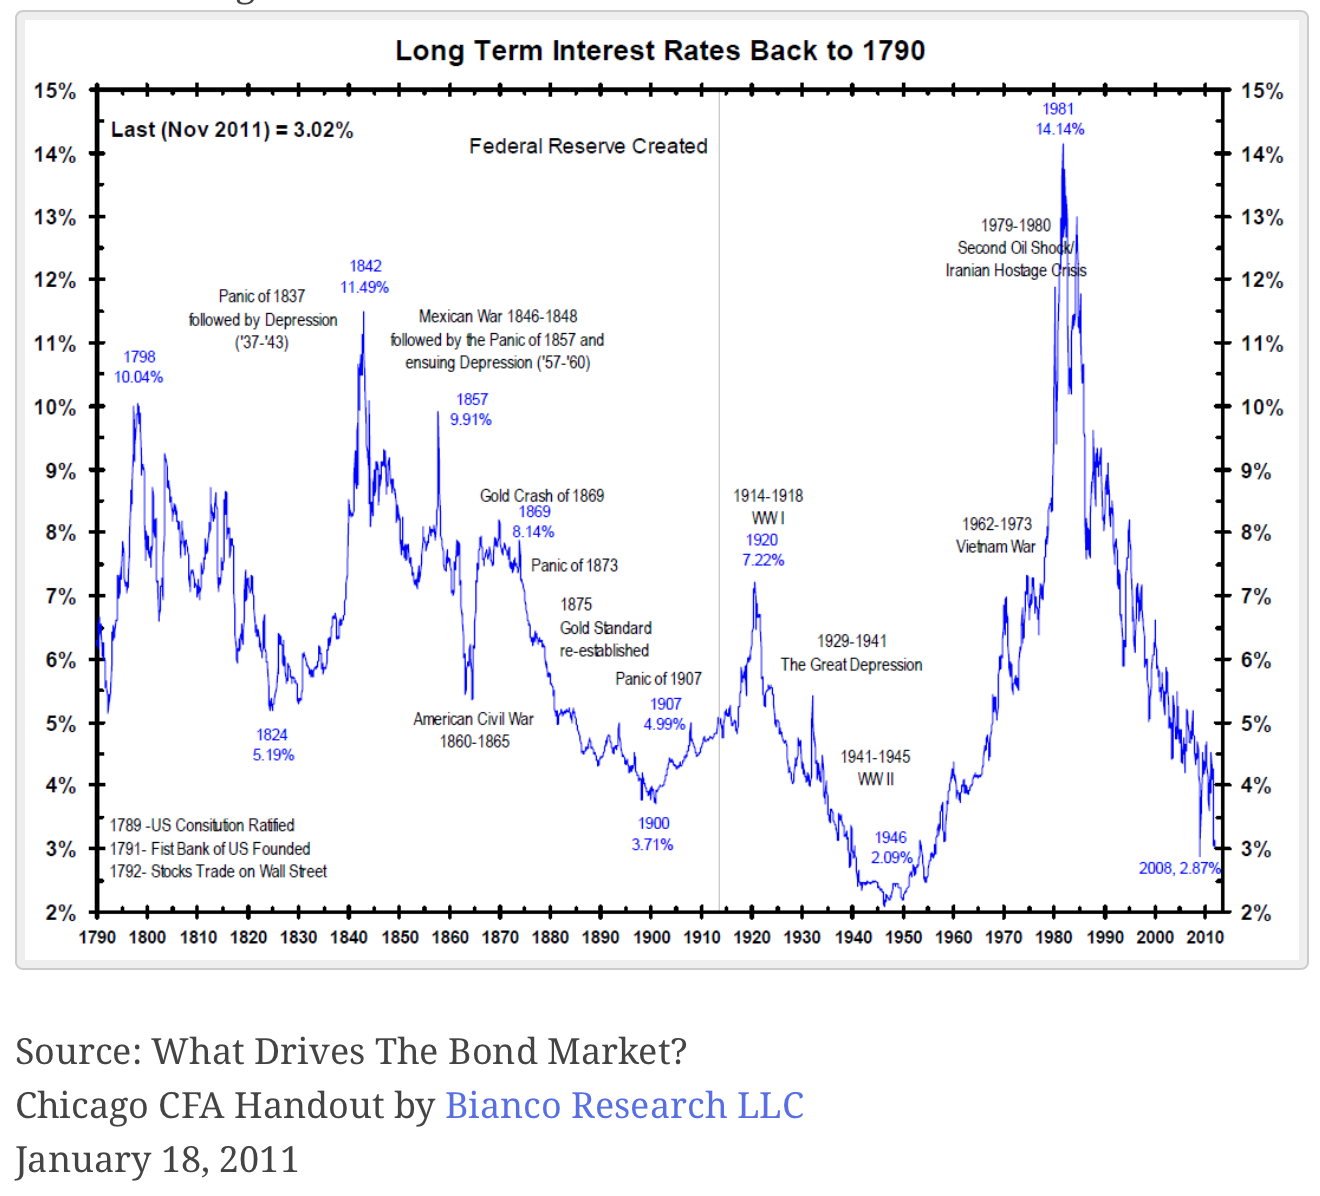
There were quite many times in history when the governments and states couldn’t really afford higher rates, but that’s what the market dictated anyway.
Source: CNBC
In the last couple of years, the rates moved even lower, but they seem to have bottomed in 2020, and now the trend seems to have reversed.
Will we see tapering? In my view, most likely yes, as it’s becoming a more and more popular narrative and the inflation is all too evident.
What will gold do given this environment? I think that gold will initially (this year) decline because the short-term effect of tapering will boost the USD Index and reduce the inflation expectations –hurting gold on both fronts. Plus all the technical details that I’ve been writing about previously.
Then, however – after the bottom – I expect gold to rally because of the stagflationary environment that all this is likely to create. The 70s were a stagflationary period, and it was when gold truly soared. Rising long-term rates are not good for business, and the huge amounts of money that have been created recently are likely to keep inflation in place. And I don’t think that the Powers That Be will really fight the inflation (besides talking about how they care about price stability etc.), as it will help to drive the debt obligations away.
Summary
To summarize, the corrective upswing in gold is over, and it seems that the big downswing in gold, silver, and mining stocks is already underway. While the next few days may (!) bring some back-and-forth action instead of the decline’s continuation, it’s unlikely that this will take place for long. Based on the self-similar pattern in gold (similarity is mostly to the 2011-2013 period), gold is likely to decline to its previous 2021 lows relatively soon, even if it doesn’t happen right away. Based on the analogies to the recent past, it seems quite likely that gold will move lower in the following days and bottom in the second half of August.
It seems that our profits from the short position in the junior mining stocks are going to grow substantially in the following weeks.
After the sell-off (that takes gold to about $1,350 - $1,500), I expect the precious metals to rally significantly. The final part of the decline might take as little as 1-5 weeks, so it's important to stay alert to any changes.
Most importantly, please stay healthy and safe. We made a lot of money last March and this March, and it seems that we’re about to make much more on the upcoming decline, but you have to be healthy to enjoy the results.
As always, we'll keep you - our subscribers - informed.
To summarize:
Trading capital (supplementary part of the portfolio; our opinion): Full speculative short positions (300% of the full position) in mining stocks are justified from the risk to reward point of view with the following binding exit profit-take price levels:
Mining stocks (price levels for the GDXJ ETF): binding profit-take exit price: $37.12; stop-loss: none (the volatility is too big to justify a stop-loss order in case of this particular trade)
Alternatively, if one seeks leverage, we’re providing the binding profit-take levels for the JDST (2x leveraged) and GDXD (3x leveraged – which is not suggested for most traders/investors due to the significant leverage). The binding profit-take level for the JDST: $15.96; stop-loss for the JDST: none (the volatility is too big to justify a SL order in case of this particular trade); binding profit-take level for the GDXD: $37.02; stop-loss for the GDXD: none (the volatility is too big to justify a SL order in case of this particular trade).
For-your-information targets (our opinion; we continue to think that mining stocks are the preferred way of taking advantage of the upcoming price move, but if for whatever reason one wants / has to use silver or gold for this trade, we are providing the details anyway.):
Silver futures upside profit-take exit price: unclear at this time - initially, it might be a good idea to exit, when gold moves to $1,683
Gold futures upside profit-take exit price: $1,683
HGD.TO – alternative (Canadian) inverse 2x leveraged gold stocks ETF – the upside profit-take exit price: $12.88
Long-term capital (core part of the portfolio; our opinion): No positions (in other words: cash
Insurance capital (core part of the portfolio; our opinion): Full position
Whether you already subscribed or not, we encourage you to find out how to make the most of our alerts and read our replies to the most common alert-and-gold-trading-related-questions.
Please note that we describe the situation for the day that the alert is posted in the trading section. In other words, if we are writing about a speculative position, it means that it is up-to-date on the day it was posted. We are also featuring the initial target prices to decide whether keeping a position on a given day is in tune with your approach (some moves are too small for medium-term traders, and some might appear too big for day-traders).
Additionally, you might want to read why our stop-loss orders are usually relatively far from the current price.
Please note that a full position doesn't mean using all of the capital for a given trade. You will find details on our thoughts on gold portfolio structuring in the Key Insights section on our website.
As a reminder - "initial target price" means exactly that - an "initial" one. It's not a price level at which we suggest closing positions. If this becomes the case (like it did in the previous trade), we will refer to these levels as levels of exit orders (exactly as we've done previously). Stop-loss levels, however, are naturally not "initial", but something that, in our opinion, might be entered as an order.
Since it is impossible to synchronize target prices and stop-loss levels for all the ETFs and ETNs with the main markets that we provide these levels for (gold, silver and mining stocks - the GDX ETF), the stop-loss levels and target prices for other ETNs and ETF (among other: UGL, GLL, AGQ, ZSL, NUGT, DUST, JNUG, JDST) are provided as supplementary, and not as "final". This means that if a stop-loss or a target level is reached for any of the "additional instruments" (GLL for instance), but not for the "main instrument" (gold in this case), we will view positions in both gold and GLL as still open and the stop-loss for GLL would have to be moved lower. On the other hand, if gold moves to a stop-loss level but GLL doesn't, then we will view both positions (in gold and GLL) as closed. In other words, since it's not possible to be 100% certain that each related instrument moves to a given level when the underlying instrument does, we can't provide levels that would be binding. The levels that we do provide are our best estimate of the levels that will correspond to the levels in the underlying assets, but it will be the underlying assets that one will need to focus on regarding the signs pointing to closing a given position or keeping it open. We might adjust the levels in the "additional instruments" without adjusting the levels in the "main instruments", which will simply mean that we have improved our estimation of these levels, not that we changed our outlook on the markets. We are already working on a tool that would update these levels daily for the most popular ETFs, ETNs and individual mining stocks.
Our preferred ways to invest in and to trade gold along with the reasoning can be found in the how to buy gold section. Furthermore, our preferred ETFs and ETNs can be found in our Gold & Silver ETF Ranking.
As a reminder, Gold & Silver Trading Alerts are posted before or on each trading day (we usually post them before the opening bell, but we don't promise doing that each day). If there's anything urgent, we will send you an additional small alert before posting the main one.
Thank you.
Przemyslaw Radomski, CFA
Founder, Editor-in-chief

